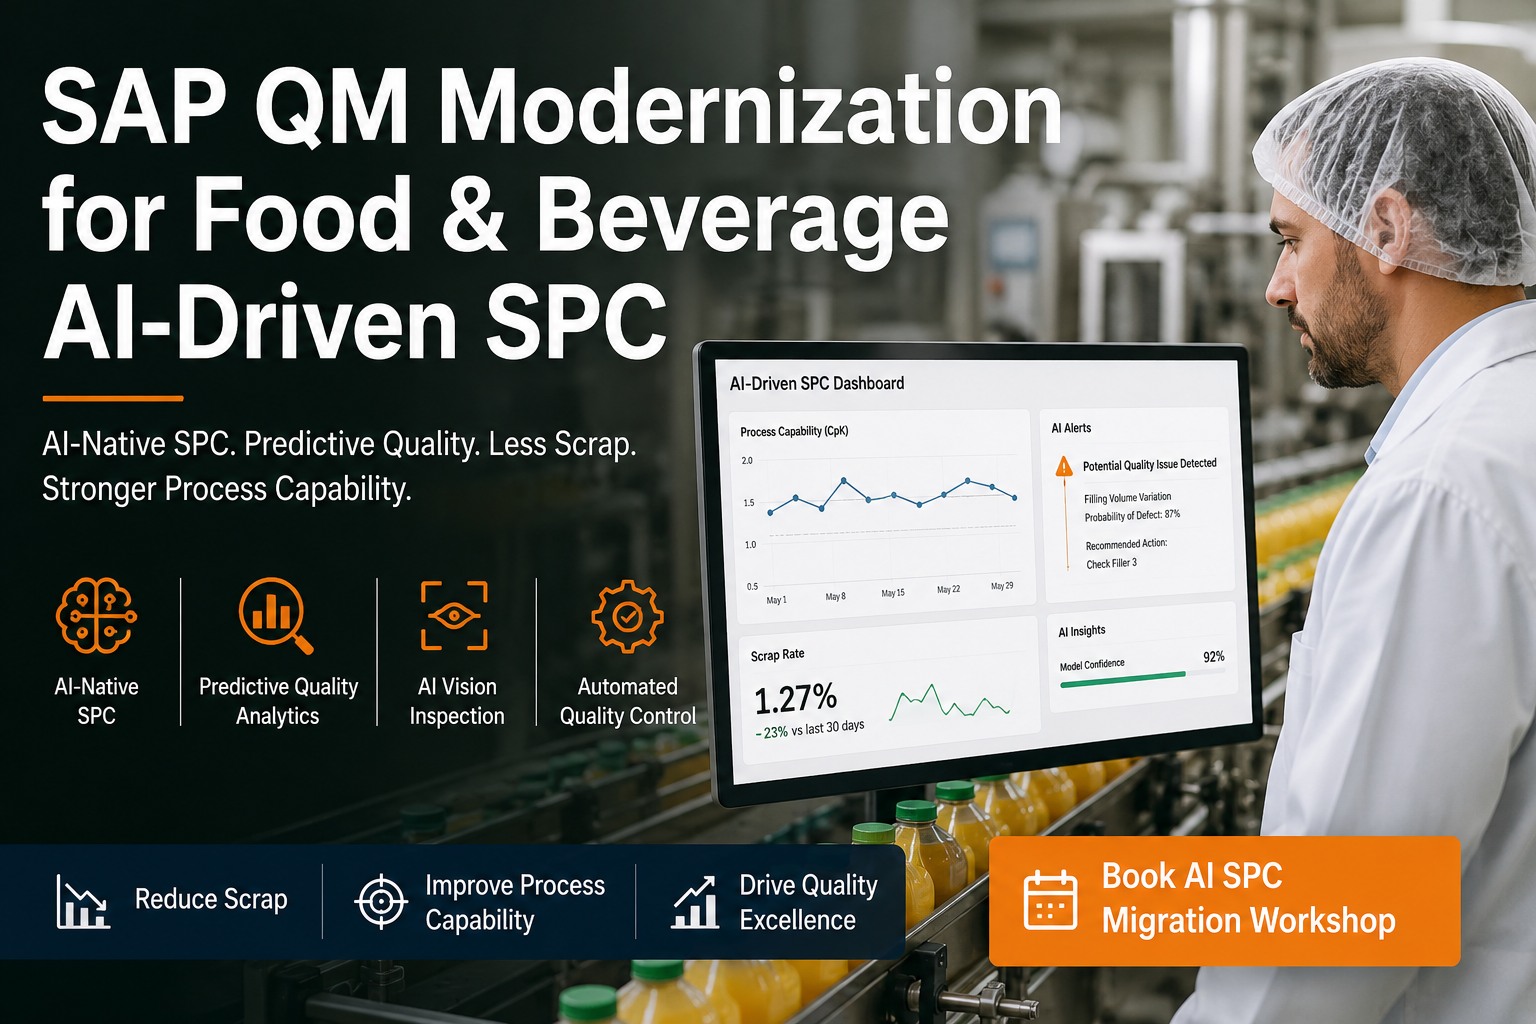
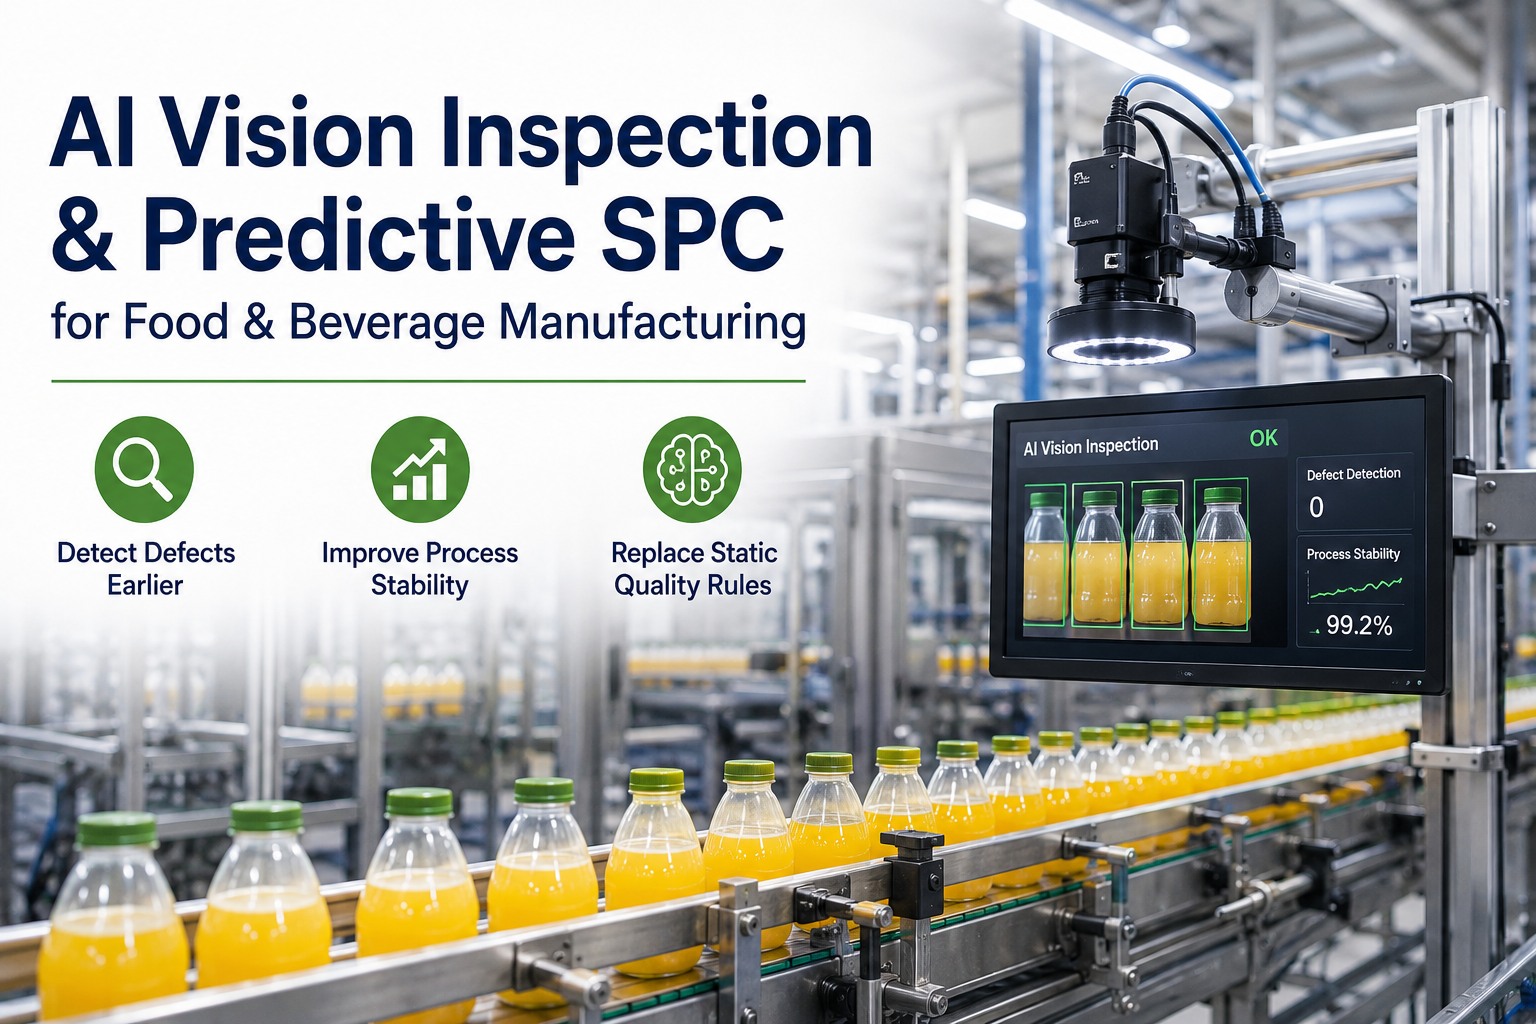
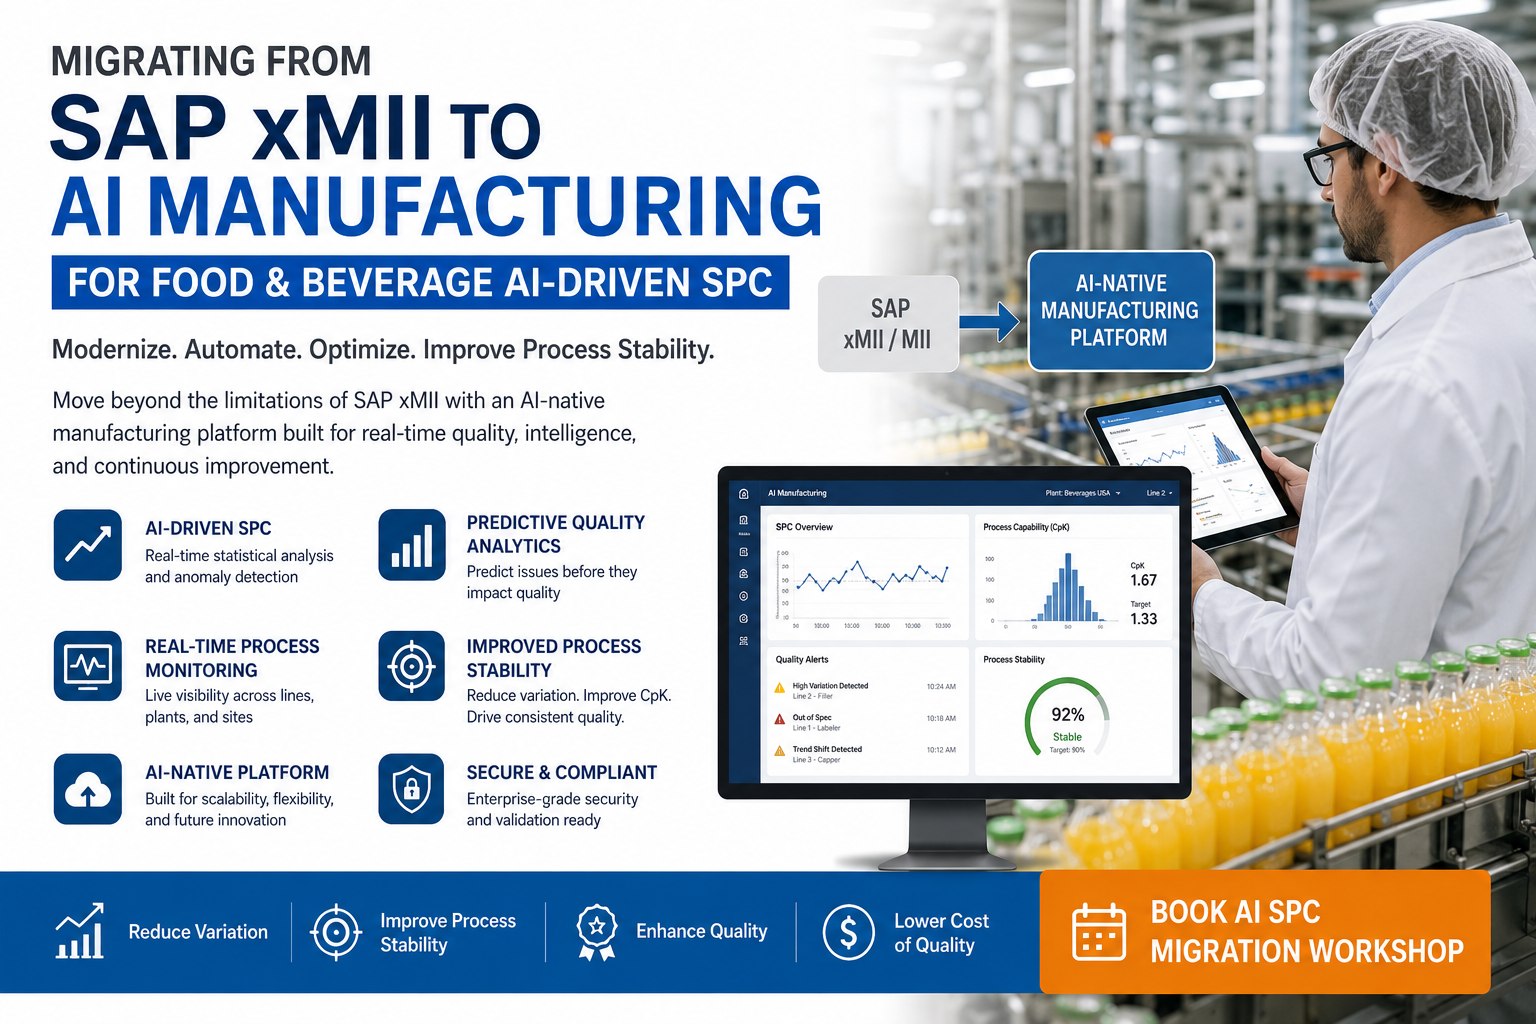
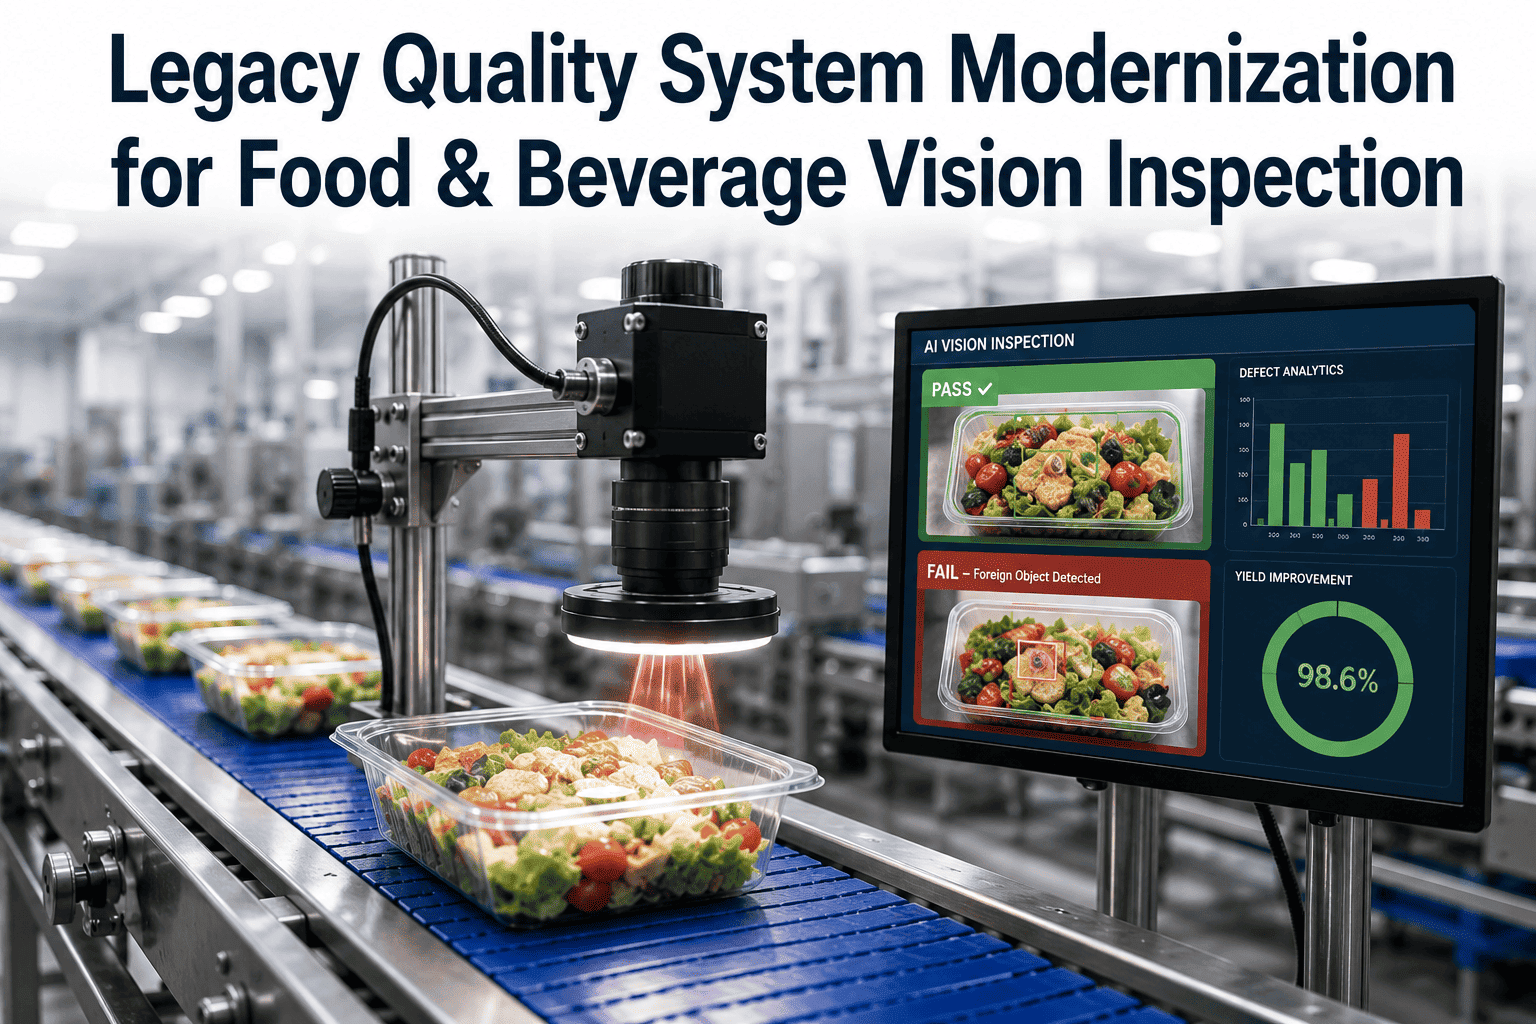
The 1-10-100 rule for quality cost is the most under-applied principle in F&B manufacturing. A defect caught at the sensor costs roughly $0.10 to handle. The same defect caught at in-line QC costs $2. Caught at warehouse release: $10. Caught by the retailer or customer: $100+ — and that's before recall liability, brand damage, and supplier scorecard collapse compound the number. SAP QM is excellent at the layers it was designed for: certificate of analysis generation, vendor scorecard management, batch release records, quality notification workflows, sample plan execution. But QM was architected to catch defects at batch release — Stage 4 in the escalation chain. By then the defect has already cost 100x what early detection would have cost. AI-driven SPC catches the same defects at Stage 1-2: sensor-level multivariate anomaly detection and AI vision inspection on the line, in sub-second windows, before the defect propagates further. The result for F&B operations: 30-60% scrap reduction in year one, defects caught at the cheapest possible stage, and SAP QM freed to do the strategic quality work it does best — leaving real-time detection to the AI layer engineered for it. This guide breaks down the 5 detection stages, where F&B scrap actually originates, and the 8-12 week migration roadmap. Book an AI SPC migration workshop for your plant.
Stage 01
$0.10
Sensor
Multivariate anomaly detection · sub-second
AI-driven SPC
×10
Stage 02
$0.50
Vision Inspection
AI vision on the line · 99%+ catch rate
AI-driven SPC
×4
Stage 03
$2
In-Line QC
Reject scan + diversion · seconds latency
Traditional SPC
×5
Stage 04
$10
Warehouse Release
COA fails · batch hold · disposition
SAP QM
×10+
Stage 05
$100+
Customer / Recall
Brand damage · liability · scorecard hit
No platform · disaster
Why SAP QM Catches Defects Too Late
SAP QM does an excellent job at the layers it was designed for — but those layers sit at the wrong end of the cost escalation ladder for scrap reduction. Five structural reasons QM-only quality strategies leave 30-60% of available scrap reduction on the table. None of these are SAP QM failures — they're capability boundaries that AI-driven SPC complements rather than replaces.
01
Designed for Batch Release, Not Real-Time
SAP QM excels at COA generation, batch release records, and vendor scorecards. These are Stage 4 layers in the cost ladder. By the time QM sees the defect, the batch is made and the cost is locked in at 100x sensor-level detection.
02
Inspection Plans Run on Samples
QM inspection lots sample a fraction of production. Defects between samples are invisible. AI-driven SPC inspects every unit continuously — 100% inspection rate at sub-second latency.
03
No Native AI Vision Inspection
QM Q-Records capture pass/fail from human or instrument inspectors. They don't run AI vision classifiers, don't detect visual defects on the line, and don't catch the visual quality failures driving most F&B consumer complaints.
04
Static Specs, Not Adaptive Limits
QM specifications are set once and stay static until manually updated. AI-driven SPC adapts limits to process behavior, product variant, line, shift — catching drift QM can't see because the drift stays within the static spec window.
05
Reactive Defect Codes, Not Predictive Causes
QM defect codes classify what already happened. AI-driven SPC predicts the defect from upstream signals 1-30 minutes ahead, identifies the root cause autonomously, and prevents the recurrence in addition to documenting it.
The 5 Detection Layers · Detailed
Each layer of the cost ladder has its own detection capability, its own latency, and its own platform fit. The deep-dive below shows what catches defects at each stage and why moving detection earlier delivers the bulk of the scrap reduction opportunity. The 1-10-100 escalation is mathematical — every stage further down multiplies the same defect's cost.
Stage 01 · $0.10
Sensor-Level Anomaly Detection
Multivariate ML monitors every sensor stream continuously — temperature, pressure, flow, viscosity, pH, fill weight, seal heat, environmental conditions. Catches the precursor signals that lead to defects before any product fails spec. Sub-second latency. 100% coverage. Cheapest stage to catch defects.
Stage 02 · $0.50
AI Vision Inspection on Line
Computer vision classifiers inspect every unit visually — fill level, seal integrity, label placement, color uniformity, foreign object presence. Catches what sensors miss and catches it before the unit moves to packaging. 99%+ detection accuracy. Replaces sample-based human inspection entirely.
Stage 03 · $2
In-Line QC Rejection
Traditional SPC threshold breaches trigger reject diversion — units physically removed from the line. Works for obvious failures but only triggers on already-failed product. Static thresholds miss drift. Defect cost is already 10-20x higher than sensor-level prevention would have been.
Stage 04 · $10
Warehouse / Batch Release
SAP QM inspection lot fails, COA shows out-of-spec result, batch placed on hold. Disposition: rework, downgrade, or scrap. Excellent QM workflow for the work it covers — but the defect already cost 100x what sensor-level detection would have cost. Strategic role: documentation, not prevention.
Stage 05 · $100+
Customer / Recall · The Disaster
Defect reaches the retailer or end consumer. Recall liability, brand damage, supplier scorecard collapse, FDA Form 483 risk, and reputation cost that lasts years. No platform catches defects here — by definition the defect escaped every prior layer. Single recall events can cost $5M-$50M+.
Move Defect Detection From Stage 4 to Stage 1
iFactory's F&B AI SPC practice deploys sensor-level multivariate anomaly detection plus AI vision inspection — the Stage 1-2 layers SAP QM was never designed to deliver. On existing QM infrastructure in 8-12 weeks per line. Built for 30-60% scrap reduction in year one.
F&B Scrap Categories · Where Each Lives
F&B scrap isn't a single bucket — it's six major categories with very different root patterns, very different detection requirements, and very different cost profiles. The breakdown below shows typical share of total scrap, where each lives on the line, and which platform layer catches it most cost-effectively.
Scrap Category
Typical Share
Where It Lives
Best Caught By
Fill Weight / Volume Out-of-Spec
25-30%
Filler stations · liquid + dry
Stage 1 · Sensor SPC
Seal Integrity Failures
15-20%
Sealers · vacuum / MAP / pouches
Stage 1-2 · Sensor + Vision
Visual Defects (Color / Texture / Shape)
15-20%
Post-cook · packaging · labeling
Stage 2 · AI Vision
Foreign Object Contamination
8-12%
Anywhere upstream of packaging
Stage 2 · AI Vision + X-ray
Cook / Process Out-of-Spec
10-15%
Cookers · pasteurizers · fermenters
Stage 1 · Sensor SPC
Allergen / Cross-Contamination
5-10%
Changeover boundaries
Stage 1-2 · Sensor + Vision
Need a scrap category audit for your plant? Book a scrap composition review with our F&B quality team.
Traditional vs AI-Driven SPC · Capability Comparison
"AI-driven SPC" isn't a vendor label — it's a specific set of capabilities that traditional rule-based SPC doesn't deliver. The comparison below shows what AI-driven actually means at the capability level. Each row maps to a specific scrap reduction outcome.
Capability
Traditional SPC
AI-Driven SPC
Scrap Reduction Impact
Control Limits
Static · set once
Adaptive · learns process drift
Catches drift static limits miss
Variables Monitored
Single-variable threshold
Multivariate ML correlation
Catches interaction-effect defects
Inspection Coverage
Sample-based (1-5%)
100% per-unit
No defects slip between samples
Detection Latency
Threshold breach event
1-30 min ahead prediction
Prevent vs document defects
Vision Capability
Human inspector + sample
AI vision · 99%+ classification
Visual defects caught at line
Root Cause Analysis
Manual 5-Whys (days)
Autonomous correlation (seconds)
Recurring defects stop recurring
Year One Outcome
5-10% scrap reduction
30-60% scrap reduction
3-6x ROI multiplier on same effort
Want a traditional-to-AI-driven SPC gap diagnostic for your plant? Connect with our F&B quality team for a tailored review.
Migration Path · 4-Phase Roadmap in 8-12 Weeks
The AI-driven SPC layer deploys on top of existing SAP QM infrastructure. QM retains its strategic quality work — COA, vendor scorecards, batch release records, quality notifications. The AI layer adds Stage 1-2 detection that QM was never designed for. Four phases take a plant from QM-only quality to a multi-layer defect detection architecture in 8-12 weeks per line.
Phase 1
Scrap Audit
Audit current scrap composition by category · map QM coverage to cost stages · identify highest-ROI use cases · baseline scrap rate
Weeks 1-2
→
Phase 2
Edge + Sensor Models
On-prem AI appliance installed · Stage 1 multivariate sensor models trained · QM integration for downstream flow tested
Weeks 2-5
→
Phase 3
Vision Inspection Deploy
AI vision cameras + classifiers deployed · defect taxonomy trained on plant samples · reject diversion wired
Weeks 5-9
→
Phase 4
Full Multi-Layer Live
Stages 1-2 catching defects at sensor + vision · QM workflows continue at Stage 4 · scrap reduction measured
Weeks 9-12
Need a tailored migration roadmap for your QM stack? Book a roadmap planning session with our F&B AI team.
Expert Perspective
The F&B plants getting the biggest scrap reductions in 2026 aren't replacing SAP QM. They're moving QM up to where it's most valuable — strategic quality work like COA generation, vendor management, batch release records, audit pack assembly. The thing QM was never going to do well, no matter how it's configured, is real-time defect detection at the sensor and vision layers. That work belongs to a platform engineered for sub-second multivariate inference at the edge. When the plant deploys both layers properly, the scrap math changes shape. Instead of catching 80% of defects at Stage 4 (where each defect already costs $10) and 20% at Stage 5 (where each defect costs $100+), the plant catches 70-80% at Stage 1-2 (where each defect costs $0.10-$0.50). The same defect rate produces a fraction of the cost. The same QM team produces a fraction of the deviations. The same retailer scorecard goes from explaining variances to leading the category. The 30-60% scrap reduction is the headline number, but the architectural lesson is that scrap reduction isn't really about catching more defects — it's about catching them at cheaper stages of the line.
— F&B Quality Strategy Best Practice, 2026
30-60%
Scrap reduction · AI-driven year one
1-10-100
Stage-by-stage cost multiplier
99%+
AI vision detection accuracy
8-12 wks
Implementation per line
Bottom Line · Cheapest Defect Is the One Caught at the Sensor
SAP QM modernization for F&B scrap reduction isn't really about modernizing QM — it's about extending the quality detection architecture upstream of where QM was ever designed to operate. QM lives at Stage 4 in the 1-10-100 cost ladder and does that work excellently: COA generation, batch release records, vendor scorecards, audit packs. AI-driven SPC adds Stages 1 and 2: multivariate sensor-level anomaly detection and AI vision inspection on the line. Defects caught at Stage 1 cost $0.10. The same defects caught at Stage 4 cost $10. The same defects reaching Stage 5 cost $100+ and trigger recalls. The 30-60% scrap reduction available in year one is the difference between a quality architecture that catches defects at Stages 1-2 vs one that catches them at Stage 4 only. Keep SAP QM for the strategic quality work. Add AI-driven SPC for the real-time detection work. Win on the cost-of-quality math the 1-10-100 rule predicts.
Catch Defects at the Cheapest Possible Stage
iFactory's F&B AI SPC practice deploys Stage 1-2 detection — multivariate sensor SPC plus AI vision inspection — on top of existing SAP QM infrastructure in 8-12 weeks per line. Sovereign on-prem AI keeps recipe IP inside the plant. Built for 30-60% scrap reduction in year one with QM retained for strategic quality work.
Frequently Asked Questions
What is the 1-10-100 rule for F&B defect cost?
A quality cost principle: a defect caught at the sensor costs roughly $0.10, the same defect caught in-line costs $2, at warehouse release $10, and reaching the customer $100+. Every stage further down the line multiplies cost by approximately 10x. AI-driven SPC catches defects at Stage 1-2 (sensor + vision) where cost is lowest. SAP QM catches defects at Stage 4 (batch release) where cost is already 100x higher.
Does AI-driven SPC replace SAP QM?
No. SAP QM does strategic quality work well: COA generation, vendor scorecards, batch release records, audit pack assembly, quality notifications. AI-driven SPC handles real-time line-side detection QM was never designed for — sub-second multivariate sensor anomaly detection and AI vision inspection at Stages 1-2. The two layers complement each other; the AI layer extends quality coverage upstream of where QM operates.
How much scrap reduction does AI-driven SPC deliver in F&B?
30-60% scrap reduction in year one is typical. Industry average F&B scrap rate is 2-8% of production. The reduction comes from catching defects at Stage 1-2 (sensor anomaly detection plus AI vision) before they propagate downstream where cost is 10-100x higher. Largest gains come from fill weight (25-30% of scrap), seal integrity (15-20%), and visual defects (15-20%) — all categories AI vision handles well.
What does AI vision inspection actually do in an F&B plant?
Computer vision classifiers inspect every unit on the line at production speed — fill level, seal integrity, label placement, color uniformity, foreign object presence, container damage. 99%+ detection accuracy. Sub-second classification. Replaces sample-based human inspection entirely. Defects identified trigger automatic reject diversion so the bad unit never reaches packaging. Visual defects represent 15-30% of total F&B scrap and are best caught at this layer.
How long does SAP QM modernization with AI-driven SPC take?
8-12 weeks per line across 4 phases: Scrap Audit (Wk 1-2, scrap composition mapping and ROI prioritization), Edge + Sensor Models (Wk 2-5, on-prem AI appliance with Stage 1 multivariate sensor models), Vision Inspection Deploy (Wk 5-9, AI vision cameras and defect taxonomy training), Full Multi-Layer Live (Wk 9-12, Stages 1-2 catching defects with QM continuing at Stage 4). Measurable scrap reduction from week 6 forward.
Book a workshop for your plant.