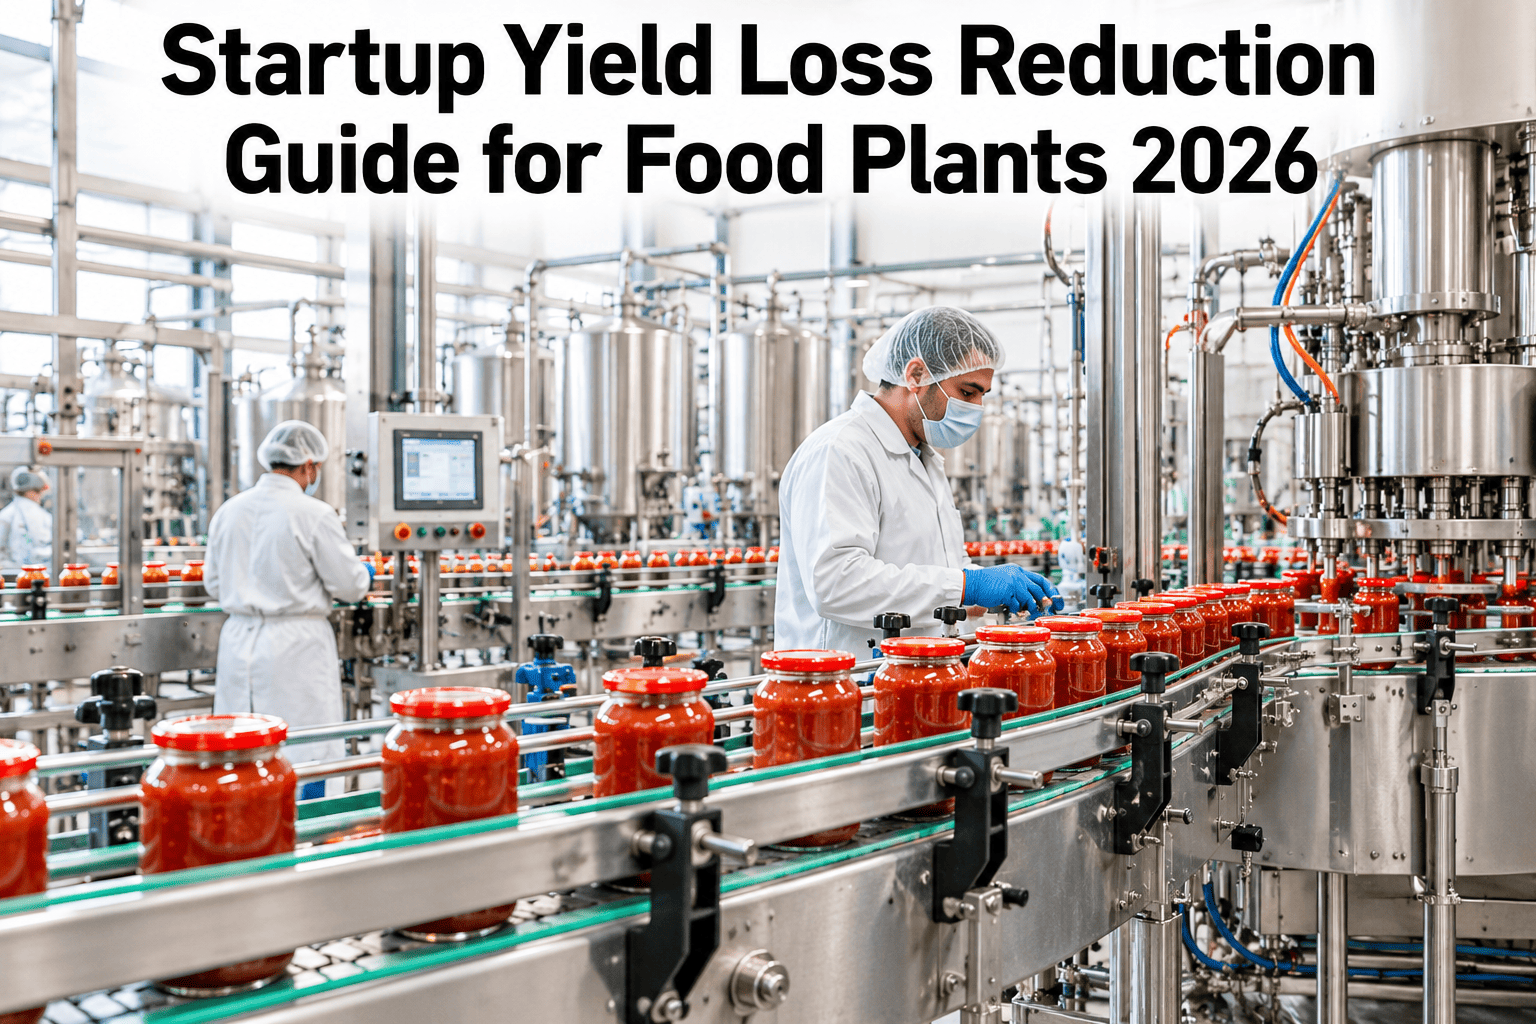
The first hour after a food line starts up almost always produces more reject product than any other hour of the shift, and most plants accept that as simply the cost of starting a line. Some of that loss is genuinely unavoidable, purge product, temperature stabilization, first-article checks. A meaningful share of it is not, and comes instead from avoidable startup errors that get bundled into the same "startup waste" bucket as the unavoidable kind. Separating the two is what actually reclaims output, and plants ready to see that split on their own startup data can walk through a first-hour yield breakdown on their own line.
Not Every First-Hour Reject Is Unavoidable
iFactory AI separates genuine startup loss, purge, stabilization, first-article holds, from avoidable startup errors, giving food plants a reclaimable first-hour yield number instead of a shrug.
Why "Startup Loss" Became a Catch-All
Startup reject rates have always run higher than steady-state rates, so plants built the habit of writing the whole first hour off as expected waste. That habit made sense decades ago when nobody had the data resolution to separate a thermal stabilization curve from an operator error during warmup. Today the data exists, but the habit of treating the whole hour as one unavoidable number often survives anyway.
What Belongs in Each Category
Drawing the line between unavoidable and avoidable loss is not a judgment call once a plant has the right data, it is a matter of comparing actual startup behavior against a known physical or procedural baseline for that specific line and product.
Find Out How Much of Your Startup Loss Is Reclaimable
Book a 30-minute session and bring a week of startup data. iFactory AI will show the actual split between unavoidable and avoidable loss.
Building the Stabilization Baseline
A reliable split between the two categories depends on knowing each line's actual stabilization curve, not a generic industry number. A filler that genuinely needs eleven minutes to stabilize temperature should not be compared against a nine-minute industry average, since that comparison would wrongly flag normal behavior as avoidable loss.
| Line Element | Typical Stabilization Driver | How Baseline Is Set |
|---|---|---|
| Filler temperature | Product viscosity and ambient conditions | Measured across multiple clean startups, not assumed |
| Capper torque | Mechanical warmup of the capping head | Tracked against torque consistency over the first cycles |
| Labeler alignment | Web tension settling after a new roll | Compared against historical alignment drift curves |
| Oven or retort ramp | Thermal mass reaching target temperature | Fixed by equipment physics, rarely variable shift to shift |
The Cost of Not Separating the Two Categories
A plant that never separates unavoidable from avoidable loss faces a quiet but real cost beyond the lost product itself. Every improvement conversation about startup yield either stalls on the assumption that the whole number is fixed, or wastes effort trying to shrink the unavoidable physical stabilization time, which no procedural fix can actually touch.
Separating the categories redirects that improvement energy toward the part that actually responds to a fix, which tends to produce faster, more durable gains than attempting to compress a stabilization curve the equipment itself sets.
Where Avoidable Startup Error Actually Comes From
Avoidable startup loss rarely comes from one dramatic mistake. It usually comes from small procedural inconsistencies that compound across the first hour, the kind that would never show up as a single flagged event but add up to real lost output once totaled across a month of startups.
Setpoint Drift
A setpoint entered slightly off from the prior shift's handoff, caught only after several minutes of off-spec product.
Skipped Warmup Steps
A warmup sequence shortened under time pressure, pushing product through before the line is genuinely stable.
Inconsistent First-Article Timing
First-article checks that start late or get delayed by staffing gaps, extending the window of unverified product.
Material Staging Delays
Startup proceeding before the right material lot is confirmed staged, forcing a pause mid-ramp.
Why Shift Handoff Notes Rarely Catch This
A shift handoff note typically covers what broke, what needs attention, and what inventory is staged, but it rarely captures the quality of the last startup in a way the next shift can learn from. A supervisor who rushed warmup to hit a production target has little reason to flag that in a handoff, since the line did eventually stabilize and the shift met its number.
That gap means avoidable startup patterns can repeat for months without ever surfacing in a formal conversation, simply because no single shift's startup looked bad enough on its own to mention. Only a baseline comparison across many startups reveals the pattern that a handoff note never would.
A Composite Month: What Separation Actually Recovers
The scenario below reflects an illustrative food line running the same product family across a month, comparing total first-hour reject volume before and after the two categories were separated and the avoidable portion targeted.
| Metric | Before Separation | After Targeting Avoidable Loss |
|---|---|---|
| Average first-hour reject rate | 6.8% | 4.1% |
| Avoidable share of total loss | Unknown, bundled together | Identified at 40% of total startup loss |
| Unavoidable baseline reject rate | Unmeasured | Confirmed stable at 4.1% |
Why Product Mix Changes the Baseline
A plant running several SKUs on the same line cannot use one stabilization baseline across all of them, since viscosity, fill volume and packaging format all affect how long genuine stabilization takes. A thin sauce and a thick dressing running on the same filler will have meaningfully different unavoidable startup curves, even though they share the same equipment.
Building a baseline per product family, rather than one generic baseline per line, is what keeps the avoidable-versus-unavoidable split accurate as a plant rotates through its full SKU mix across a week. A baseline built only from the most common product will misclassify startups on less frequent SKUs.
Building the Case Across Shifts and Leadership
A startup yield program touches shift supervisors, quality and plant leadership differently, and each tends to ask a different question before supporting a change to how startup is measured and reviewed.
How This Connects to Changeover and Micro-Stop Tracking
Startup yield loss rarely exists in isolation from the other micro-stop and changeover patterns a food plant already tracks. A line with chronic avoidable startup error often shows related patterns in changeover consistency, since both draw on the same procedural discipline from the crew running the line.
Plants that already track changeover time or micro-stop frequency often find the same underlying signals, operator sequencing, setpoint consistency, feed into a startup yield baseline with minimal additional setup, since the data sources overlap significantly.
Where iFactory AI Fits
Separating unavoidable from avoidable startup loss requires a line-specific stabilization baseline built from real historical startups, checked continuously against live startup data as each shift begins. iFactory AI builds and maintains that baseline automatically, so the split is available every shift, not just during a one-time study.
Line-Specific Baseline Modeling
Stabilization curves are built from a line's own historical startups rather than a generic industry assumption.
Live Startup Classification
Each startup is scored against the baseline in real time, separating unavoidable loss from avoidable error as it happens.
Avoidable Error Attribution
Setpoint drift, skipped steps and staging delays are flagged individually, not bundled into one generic waste number.
First-Hour Yield Reporting
A reclaimable yield figure is reported per line, per shift, replacing a single flat startup waste percentage.
What Changes in the First Thirty Days
Most plants do not see a dramatic shift in the first week of tracking startup yield this way, since the initial value is mostly in establishing the baseline itself. The real change tends to show up once supervisors start seeing their own line's avoidable-loss trend in a recurring report, which turns an abstract concept into something they can watch move week over week.
By the end of the first month, most plants have enough data to identify at least one concrete procedural fix, whether that is a staging checklist, a setpoint confirmation step, or a staffing adjustment during the first-article window, that measurably narrows the avoidable gap without requiring any capital investment.
Expert Review
Food plant quality leads who have run a startup yield study tend to describe the same realization: most of what everyone assumed was unavoidable turns out to have a real, measurable baseline well below the number the plant had been accepting for years. The gap between that baseline and actual performance is where the real opportunity sits. Bring your own first-hour reject data to a working session and see where your line's real baseline sits.
Frequently Asked Questions
How is a line's unavoidable stabilization baseline actually measured?
It is built from multiple clean, well-executed startups on that specific line and product, tracking temperature, torque, alignment and reject rate until a consistent curve emerges. Ask how many startups are typically needed to establish a reliable baseline.
Does this apply to allergen or flavor changeover purges?
Purge requirements stay governed by food safety rules and are treated as unavoidable loss, though the timing and consistency of the purge itself can still be tracked for avoidable delay beyond the required amount.
Can this be used to compare shifts fairly?
Yes, since the baseline is set per line and product rather than per shift, a fair comparison is possible without penalizing a crew for a longer stabilization curve the equipment itself requires. Ask support how shift comparisons are structured.
How long before a plant sees a reliable avoidable-loss number?
Most lines produce a usable baseline within the first few weeks of connected data, though confidence improves as more startups accumulate across different operators and shifts.
Does this require new sensors on the line?
Most lines already generate temperature, torque and reject data that can be tapped directly, though older equipment occasionally needs a retrofit sensor to capture startup behavior reliably. Ask support about your specific equipment.
Reclaim the Startup Yield You've Been Writing Off
iFactory AI separates unavoidable startup loss from avoidable error on every line, every shift. Book a walkthrough using your own startup data.