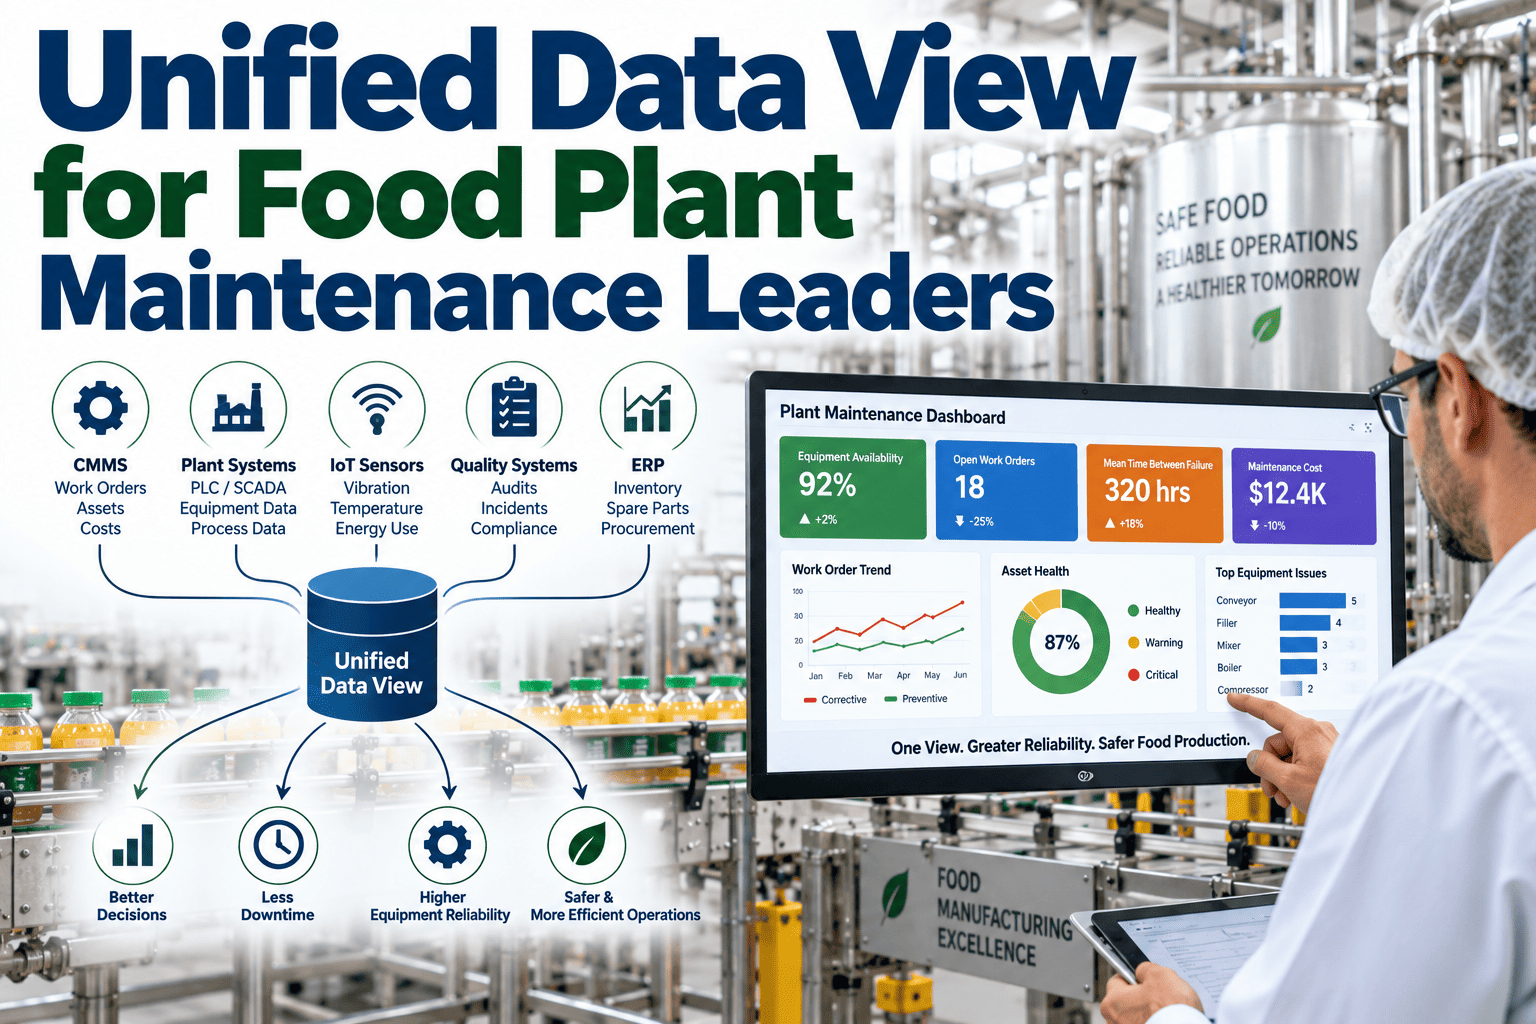
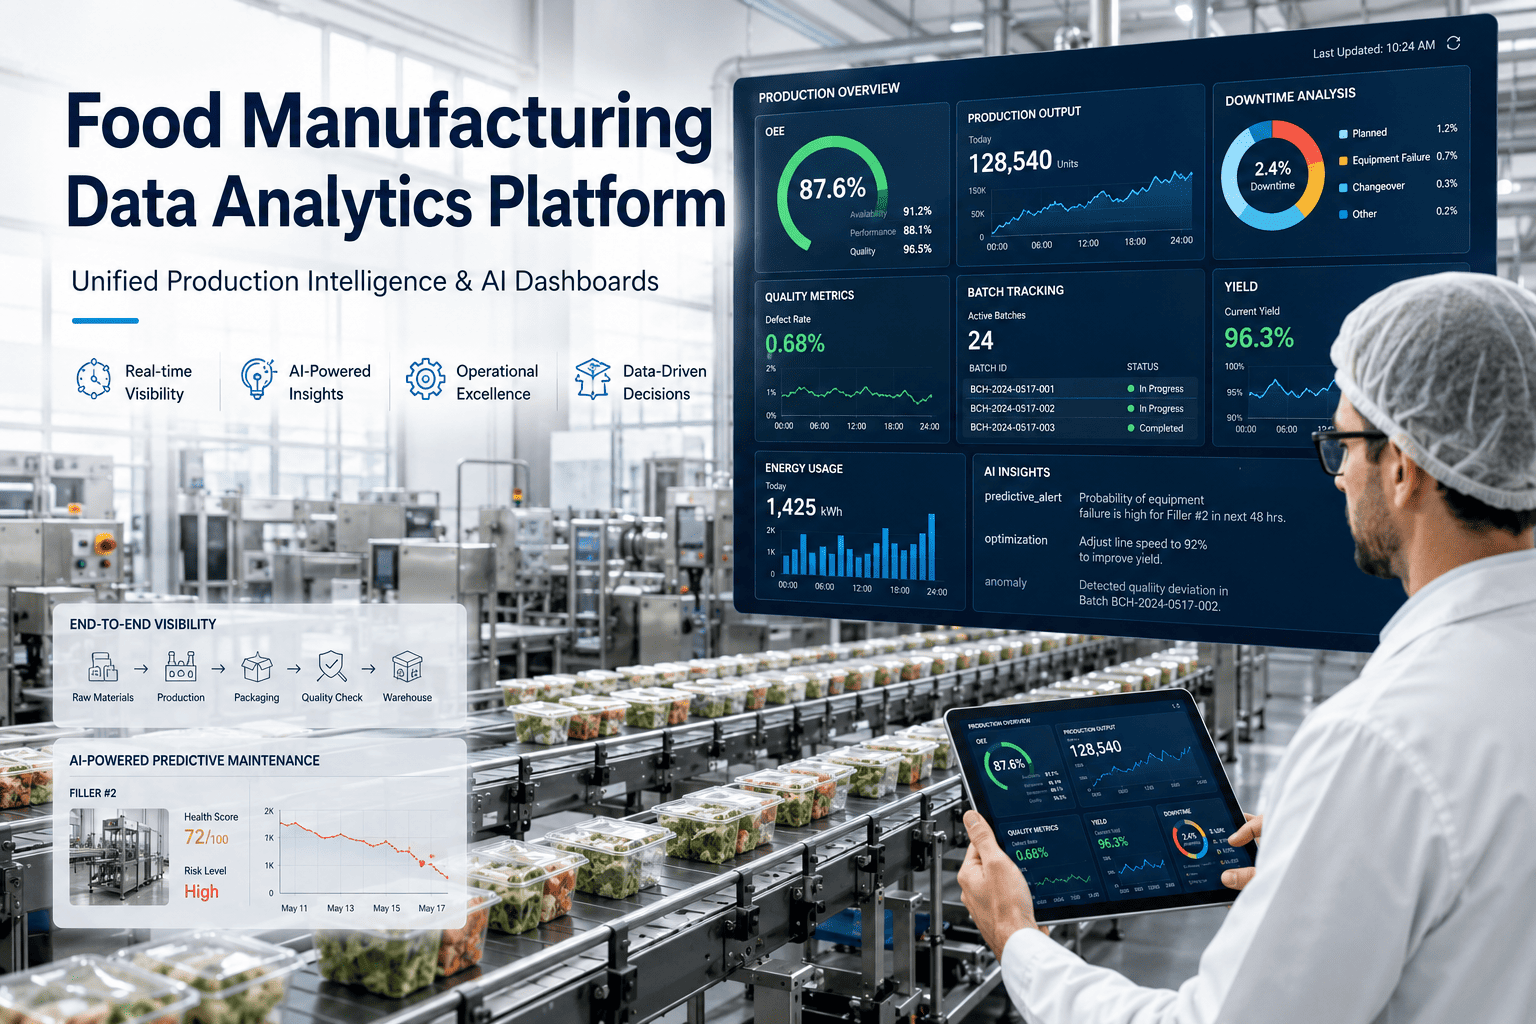
Ask a maintenance leader how many different screens they open in a typical day to understand what's actually happening across their facility, and the honest answer is usually somewhere between four and seven — a CMMS, a couple of spreadsheets, a PLC historian, an ERP report, and whatever tool the reliability team uses for condition data. Each system is authoritative for its own slice of the truth, and none of them talks to the others, which means the real state of maintenance only exists in the leader's head, reconstructed fresh every single day. That reconstruction work is exactly what iFactory's unified data view is built to eliminate.
DATA UNIFICATION
A Unified Data View for Food Plant Maintenance Leaders
End the CMMS, spreadsheet, PLC, ERP, and report tab-switching routine that hides the real state of maintenance behind five disconnected screens.
CMMS
ERP
PLC
Sheets
Reports
ONE VIEW
The Real Cost of Living Across Five Disconnected Systems
The cost of data fragmentation rarely shows up as a single dramatic failure — it shows up as a slow accumulation of small frictions that together add up to something significant. A maintenance leader spends time reconciling numbers that should already agree, misses a pattern that would have been obvious if two data sets sat side by side, and makes a resourcing decision based on whichever system happened to be open at the moment, rather than the complete picture.
Where Each System Holds a Different Piece of the Truth
Every one of the systems a maintenance leader juggles daily is genuinely good at its specific job — the problem has never been that any individual system is wrong, it's that none of them was ever designed to talk to the others.
CMMS
Holds work order history, backlog, and PM scheduling — the system of record for what work has been assigned and completed.
ERP
Holds parts inventory, purchase orders, and labor cost data — the financial and logistical side of maintenance operations.
PLC / SCADA
Holds real-time equipment and line status, downtime events, and process data straight from the plant floor.
Spreadsheets & Reports
Often the informal home for data that fell through the gaps between formal systems — manually tracked and easily out of date.
What "Unified" Actually Means in Practice
Unification is not about replacing any of the source systems above — each remains the system of record for its own data type. It means building a layer above them that pulls the relevant pieces from each into one consistent, current view, so a maintenance leader stops manually reconciling numbers that live in separate places.
| Before Unification | After Unification |
|---|
| Open five separate tools to answer one question | Answer appears in a single consolidated view |
| Numbers manually cross-referenced between systems | Data reconciled automatically behind the scenes |
| Reports built manually, once a week or month | Live view updated continuously as source data changes |
| Patterns across systems noticed only by chance | Correlations surfaced because the data sits side by side |
See Your Own Systems Unified Into One View
iFactory connects your existing CMMS, ERP, PLC, and reporting data into a single consolidated view, without requiring you to replace any of the underlying systems.
The Path From Fragmented to Unified
Bringing together data that has lived in separate systems for years is a structured process, not a single technical switch. The stages below reflect the typical path a maintenance organization follows toward a genuinely unified view.
1
Map Every Existing Data Source
Catalog which system holds which specific data type, including informal spreadsheets that have quietly become a system of record for something important.
2
Establish Connections to Each Source
Build live or near-live data connections to each system, rather than one-time exports that require manual repetition to stay current.
3
Reconcile Definitions Across Systems
Align terminology and calculation methods — a "downtime hour" defined differently in the PLC log versus the CMMS needs a single agreed definition.
4
Build the Consolidated View
Present the unified data in a single interface designed around the actual questions maintenance leaders need answered daily.
A Director of Maintenance on the Correlation Nobody Had Ever Seen
"
We had run our maintenance operation across separate systems for so long that the fragmentation just felt normal — it was simply how the job worked, and I don't think any of us thought of it as a solvable problem until someone from our leadership team asked why we hadn't noticed a pattern that, once unified, was actually fairly obvious. Our parts stockout rate for a specific category of bearing had been climbing for months, tracked in the ERP, at the exact same time backlog aging for that equipment type was climbing in the CMMS, and neither number alone told the story, but side by side they clearly pointed to a supplier lead time issue that was cascading into delayed repairs. We genuinely could have caught this months earlier if the two numbers had ever sat on the same screen, but they lived in completely separate systems that nobody was cross-referencing regularly, because doing that manually every week simply wasn't realistic given everything else on our plates. Once we had a unified view, that kind of cross-system pattern stopped being something we got lucky enough to notice and became something the data surfaced on its own.
— Director of Maintenance, Food Manufacturing Facility · Oversees Maintenance Operations Across 5 Production Lines
Governance Considerations Once the View Is Unified
Bringing data together into one view raises a question that fragmented systems never had to answer clearly: who is responsible for keeping it accurate once it's live. A unified view is only as trustworthy as the ongoing discipline behind it, which means governance deserves the same attention as the technical build itself.
Data Ownership
Each source system should retain a named owner responsible for the accuracy of what it feeds into the unified view.
Change Management
Updates to a source system's structure or fields should trigger a review of how that change affects the unified view downstream.
Access Control
A unified view often surfaces data across departments, so access permissions need review to ensure appropriate visibility by role.
Periodic Definition Audits
Revisiting reconciled metric definitions periodically catches drift as teams and processes evolve after the initial build.
Facilities that treat unification as a one-time technical project rather than an ongoing operational discipline tend to see the value erode within a year or two, as source systems change and nobody is specifically responsible for keeping the unified view in step with them.
Frequently Asked Questions
Do we need to replace our CMMS, ERP, or PLC systems to get a unified view?
No — a unified data view is designed to sit above your existing systems, connecting to each one to pull the relevant data into a consolidated display, rather than replacing any of them. Each source system remains the authoritative record for its own specific data type, and unification simply removes the manual work of cross-referencing between them. This approach is generally faster and less disruptive than a full system replacement project, since your existing workflows in each individual system continue to function as they always have.
What happens to the spreadsheets our team has been using informally for years?
Informal spreadsheets often exist because they capture something no formal system was tracking, and the mapping phase of unification specifically surfaces these gaps rather than ignoring them. In many cases, the data being tracked in a spreadsheet can be incorporated into the unified view directly, or it reveals a genuine gap in a formal system that should be addressed properly rather than continuing to rely on a manually maintained file. Either way, identifying these informal data sources is an important part of building a truly complete unified picture.
How do you handle situations where two systems define the same metric differently?
This is a common and important part of the unification process — reconciling definitions across systems, as described in the path above, so that a term like "downtime hour" or "critical asset" means the same thing regardless of which source system originally recorded it. Without this reconciliation step, a unified view risks simply displaying conflicting numbers side by side rather than actually resolving the fragmentation problem, so this step deserves real attention rather than being treated as a minor technical detail.
How long does it typically take to build a fully unified data view?
For a facility with a moderate number of source systems and reasonably documented data structures, the full process from initial mapping through a working consolidated view typically takes six to ten weeks. Facilities with a larger number of informal spreadsheet-based systems, or significant inconsistency in how metrics are currently defined across departments, may need additional time during the reconciliation phase, since resolving those definitional conflicts properly tends to take longer than the technical integration work itself.
Can iFactory map our specific systems and build a unified view for our facility?
Yes — the initial system mapping and data source assessment is typically the first working session in any unification engagement, cataloging exactly which systems your team currently relies on and where the gaps and inconsistencies exist before any technical connection work begins. iFactory's platform is built to integrate with a wide range of CMMS, ERP, and PLC systems commonly used across food manufacturing. To scope a unified data view for your specific systems,
book a demo with our team.
Stop Reconstructing the Truth From Five Disconnected Screens
Your CMMS, ERP, PLC, and spreadsheets each hold a piece of the real story — but only when they finally sit in one place does the full picture become visible. iFactory builds that unified view around the systems you already run.