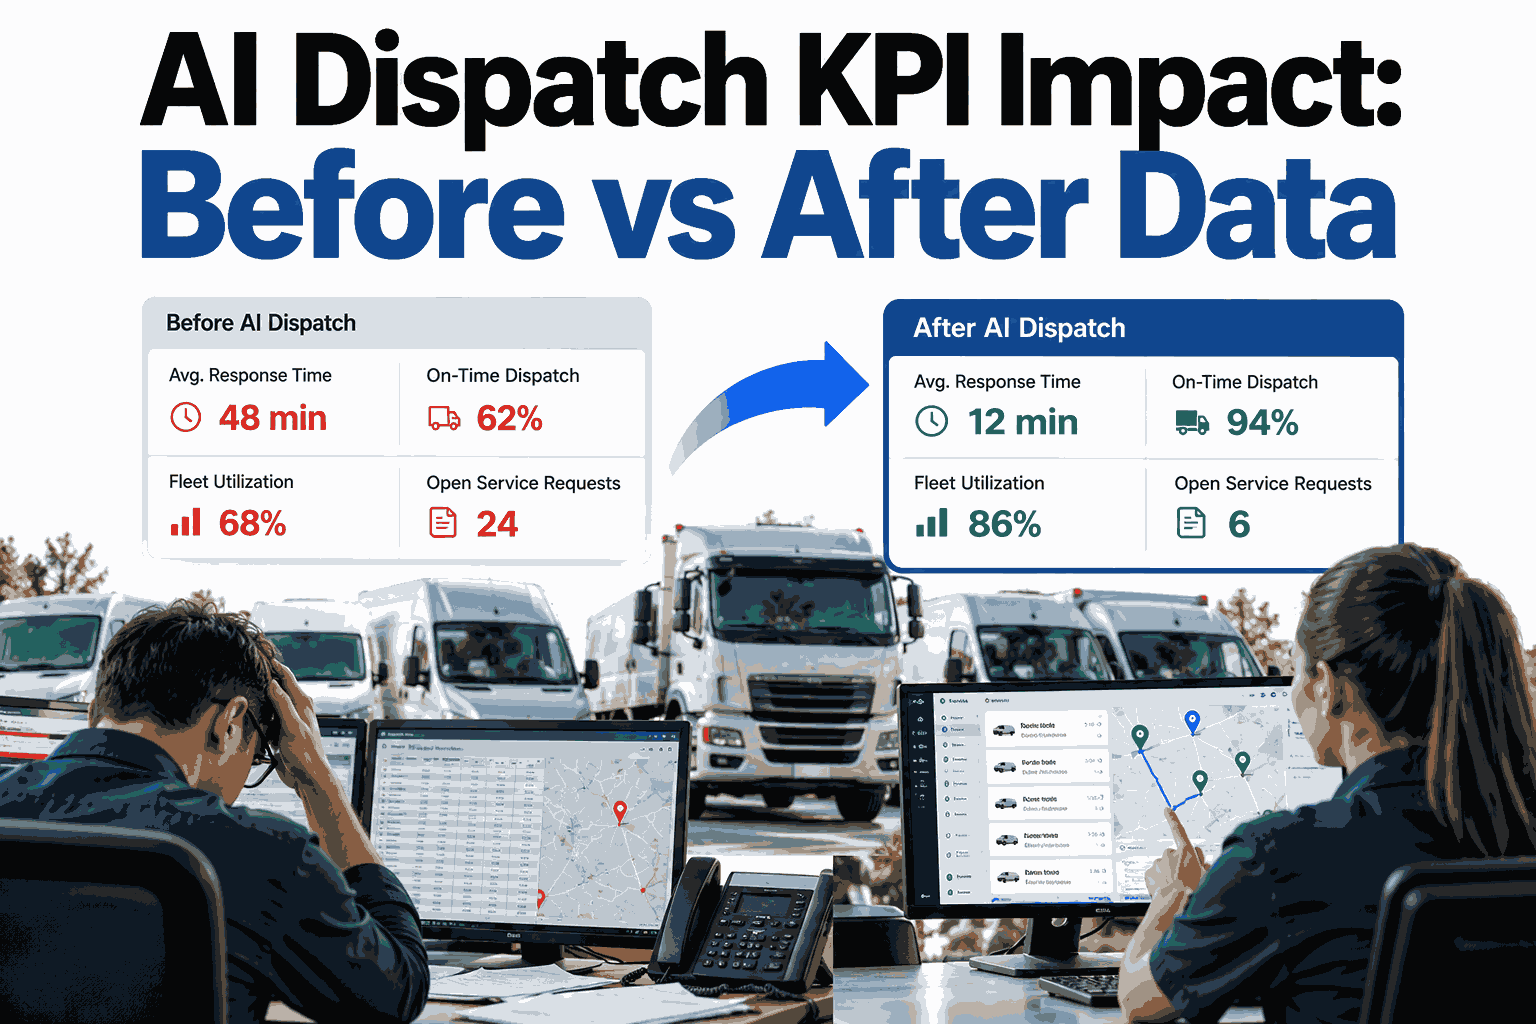
Most dispatch software demos show features. Operations leaders need something different: proof in the numbers they already track. This article walks through a before-and-after view of four service KPIs, namely first-time fix rate, dispatcher headcount, jobs per technician, and callback rate, using an illustrative HVAC composite and a method for measuring your own. Every figure is explained so you can test it against your records, and you can set up a baseline review with the iFactory AI team before changing a single dispatch rule.
AI Dispatch KPI Impact: What Changes When Matching and Routing Run Automatically
Four service KPIs, measured before and after AI dispatch. See where the gains come from, what they are worth, and how to verify them in your own business.
Start With a Baseline, Not a Promise
A before-and-after comparison is only as honest as the baseline behind it. Teams that skip this step end up crediting software for changes that came from a mild summer or a new hire.
Pick a clean 90-day window
Choose a period with normal staffing and no major system change, so the starting numbers reflect everyday operations.
Freeze the definitions
Decide what counts as a fixed-first-visit job and a callback, then keep those rules identical before and after.
Segment by job type
Split no-cool emergencies, repairs, maintenance visits, and install-related calls. Blended averages hide where the gains actually land.
Record the context
Note technician count, seasonal load, and job mix so the later comparison can be adjusted fairly.
Every figure in the rest of this article comes from an illustrative composite of a regional HVAC service business with roughly 60 technicians. Treat it as a planning model, not a guarantee. Your results depend on your starting data quality, job mix, and team.
The Four-KPI Scoreboard
Here is the full before-and-after picture in one place. Lighter bars show the starting point; solid bars show the result after AI dispatch settled in.
Notice that the four KPIs move together. Better matching lifts the fix rate, a higher fix rate removes repeat visits, and fewer repeat visits free hours that become new jobs.
Read the dispatcher bar carefully. The after-state team handles roughly 29% more daily jobs with two fewer people, because routine assignment and rescheduling no longer need a human at every step.
First-Time Fix Rate: Where the 15 Points Come From
First-time fix rate, or FTFR, is the share of jobs completed on the first visit. It is the most valuable service KPI because every miss creates a second truck roll.
At about 246 daily jobs, a 71% rate means roughly 71 jobs a day need a return trip. At 86%, with about 318 daily jobs, that falls to around 45.
Skill match
The system compares the job symptoms with technician certifications and past results, so complex repairs reach the person who can finish them.
Parts match
Likely parts for the fault are checked against what each truck carries, which cuts the supply-house detours that stretch a day.
Equipment history
Past visits to the same unit travel with the ticket, so the technician arrives knowing what was already tried.
Realistic time windows
Job duration is estimated from similar completed work, which stops rushed visits that end with a promise to return.
None of these inputs is new. The change is that matching uses all of them on every ticket, not only when a veteran dispatcher has time to think. You can walk through these matching inputs on your own tickets in a live session.
Dispatcher Headcount: A Role Shift, Not Just a Number
The headcount bar is the most discussed result and the most misunderstood one. The gain comes from changing what dispatchers spend their day on.
Most businesses use this change to redeploy people into customer communication, scheduling of maintenance agreements, or senior dispatch roles instead of cutting staff outright.
A smaller team also reduces the risk of one absent dispatcher disrupting the whole day, because the routing logic keeps working when someone is out.
Jobs per Technician: Giving the Day Back
Jobs per technician rises when paid hours shift from driving and waiting toward actual repair work. The comparison below shows how one technician-day was spent.
Repair time grows by about eleven points of the day. That is where the extra jobs come from, not from technicians working faster.
Tighter clusters
Jobs are grouped by location and time window, so trucks stop crossing the service area twice.
Fewer parts runs
Better parts matching removes many of the mid-day trips to the supply house.
Live gap filling
When a job ends early or cancels, the nearest suitable ticket is offered instead of the truck sitting idle.
Gaps and waiting stay flat in this model, which is realistic. Some idle time is the buffer that keeps emergency calls absorbable.
Callback Rate: Fewer Repeat Visits, Fewer Unhappy Customers
A callback is a return visit for a problem that should have been solved the first time. The chart shows why callbacks happened in the baseline period.
Two-thirds of baseline callbacks trace back to parts and skill mismatches, which are exactly the decisions AI matching makes at assignment time.
Callbacks fell in absolute terms even though total daily volume rose. That detail matters, because a rate can drop simply because the denominator grew.
See How These Four KPIs Would Move in Your Business
Book a 30-minute session and the iFactory AI team will map your current dispatch data to the four KPIs in this article, then show where the biggest gain is likely to come from.
KPI Definitions You Can Copy Into Your Own Report
Use the same formulas before and after. Mixing definitions is the most common way a comparison loses credibility.
| KPI | Formula | Watch-Out |
|---|---|---|
| First-time fix rate | Jobs closed on first visit divided by all jobs closed | Define what counts as a repeat visit and keep it fixed |
| Dispatcher load | Jobs dispatched per day divided by dispatchers on shift | Include exceptions handled, not only tickets assigned |
| Jobs per technician | Completed jobs divided by technician working days | Exclude training days and long installs from the average |
| Callback rate | Callback visits divided by completed jobs in the period | Set a consistent window, such as 30 days after the original job |
| Drive-time share | Travel hours divided by paid technician hours | Compare the same service area and season |
Drive-time share is a useful fifth number to track. It explains why jobs per technician moved, and it is hard to fake.
A 90-Day Plan for Your Own Before-and-After
You do not need a long project to get evidence. Three phases are enough to see a trend you can trust.
Connect and baseline
Link job, technician, and parts data. Capture the four KPIs under the frozen definitions without changing dispatch behavior.
Pilot a service zone
Run AI matching and routing in one region or one team while the rest stays manual, giving a built-in comparison group.
Compare and expand
Review the four KPIs for pilot and control, adjust rules where gains lag, and decide how to extend coverage.
A control group is the strongest protection against false credit. If both groups improve, the cause is probably seasonal. If only the pilot improves, the case is much stronger. You can ask the support team to help design a pilot zone that fits your service area.
Five Ways Before-and-After Numbers Mislead
Good measurement is as important as good software. Watch for these five traps when you review any vendor claim, including ours.
Seasonal drift
Comparing a mild spring with a heat wave tells you about weather. Compare matching periods or use a control group.
Changing definitions
A looser callback window flatters the after-state. Lock definitions before the first measurement.
Cherry-picked jobs
Excluding hard jobs raises the fix rate artificially. Report on all completed work.
Rate without volume
A falling callback rate can hide flat callback counts. Show both the rate and the absolute number.
Ignoring the ramp
Early weeks include learning time. Judge results after matching rules have tuned to your data.
Businesses that avoid these traps end up with numbers their finance team accepts, which is what turns a pilot into a rollout.
Where iFactory AI Fits in the Dispatch Workflow
iFactory AI is smart manufacturing and industrial software, and the same scheduling and routing intelligence supports field service teams that run HVAC operations. It sits between the job ticket and the technician.
Automatic scheduling and routing
Jobs are sequenced by location, window, and priority, then rebuilt automatically when plans change during the day.
Skill and parts aware matching
Each assignment considers technician capability and truck stock so the right person arrives equipped.
KPI visibility
Fix rate, callbacks, drive time, and jobs per technician stay visible, so you can check the claims in this article against your own data.
Dispatcher oversight
People review exceptions and approve changes, keeping judgment where it matters most.
iFactory AI arrives pre-configured on an NVIDIA server, racked and ready with software pre-loaded. Scope covers cabling, network, integrations, team training, and 24x7 remote monitoring.
Seeing this on your own tickets is more convincing than any slide. Schedule a live walkthrough with your sample jobs and judge the matching logic yourself.
Frequently Asked Questions
Are the numbers on this page guaranteed results?
No. They come from an illustrative composite built to show how the four KPIs relate to each other. Real results depend on your data quality, job mix, and team. The reliable way to know is to run your own baseline, and you can ask the iFactory AI team how to structure that comparison.
Does a smaller dispatch team mean layoffs?
Not necessarily. Many businesses redeploy dispatchers into customer communication, maintenance agreement scheduling, or senior dispatch roles. The headcount number shows how much routine work the software absorbs, and what you do with that capacity is a business decision.
How long before the KPIs actually move?
Expect a tuning period while matching rules learn your technicians, trucks, and service area. Most teams judge results after the pilot phase, once the rules have settled, not in the first week. A demo session with your own data shows what a realistic timeline looks like.
Which KPI should we measure first?
Start with first-time fix rate, because it drives callbacks and jobs per technician. If your fix rate is low, the other numbers usually follow it. Track drive-time share alongside it, since that explains most of the movement in daily job counts.
Do we need new hardware or can we use existing systems?
iFactory AI is delivered turnkey on a pre-configured server, with integration to your existing systems included in scope. That means your job, technician, and parts data connect without a rebuild. The support team can confirm what integration looks like for your specific software before you commit.
Measure Your Own Before-and-After With iFactory AI
Bring your last 90 days of jobs and the iFactory AI team will show how matching and routing would have changed fix rate, callbacks, and jobs per technician. Book a walkthrough and see it on your own numbers.