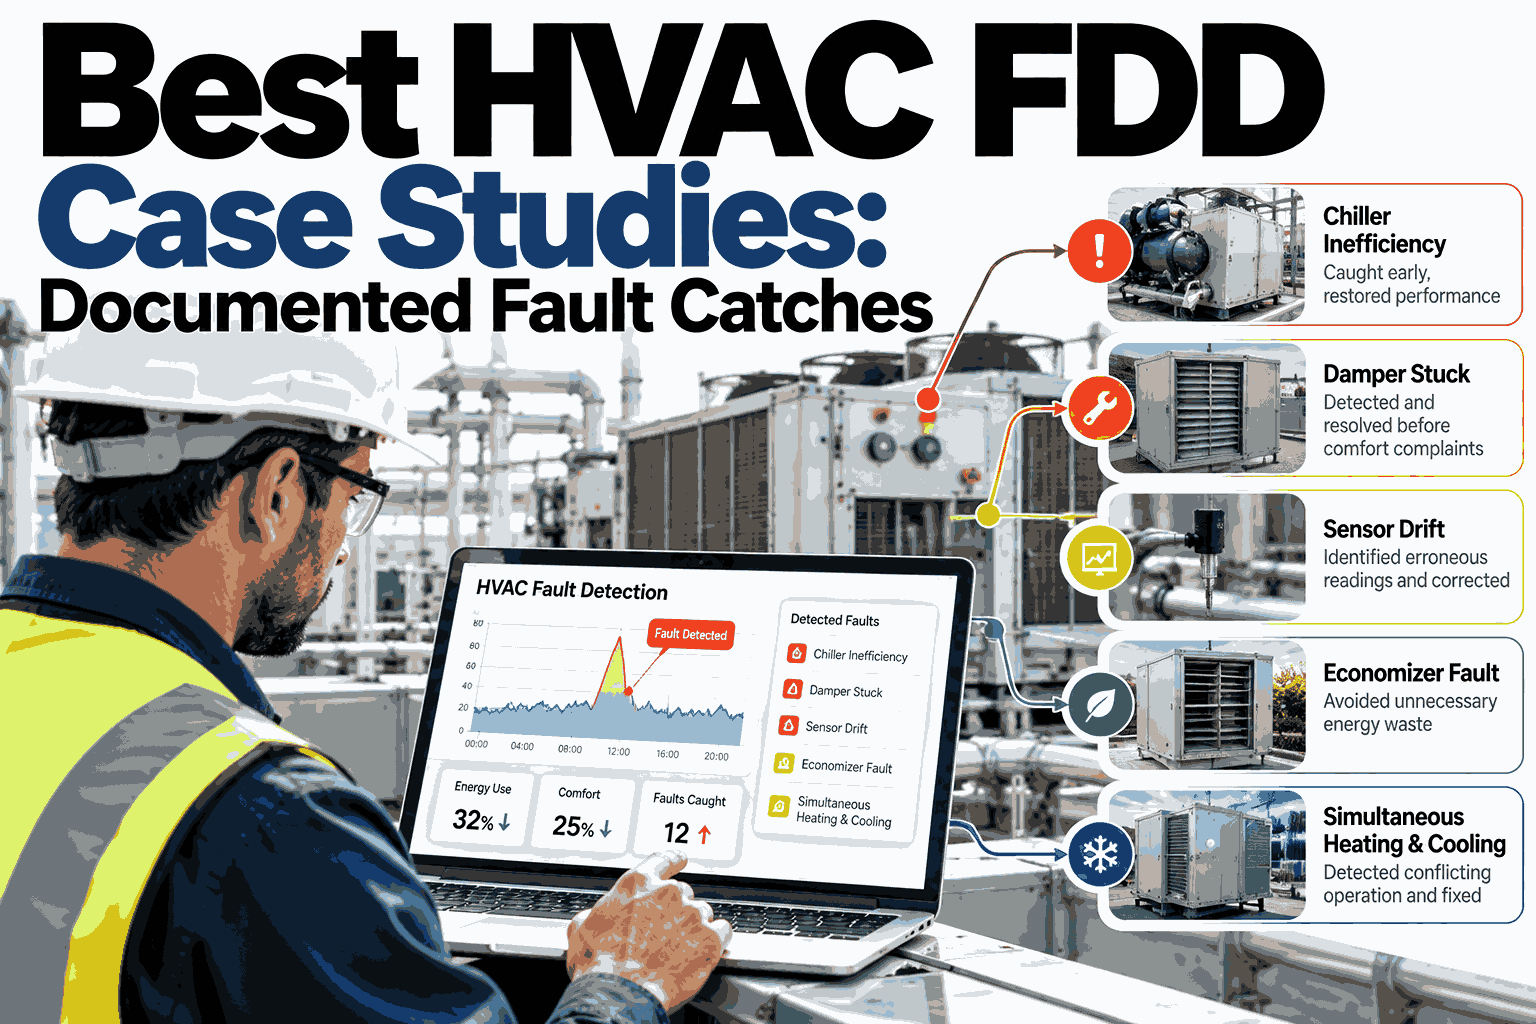
Facility teams rarely lack data. What they lack is proof that a software alert turns into a repaired fault and a smaller energy bill. Published research gives a useful anchor, since organizations using fault detection and diagnostics (FDD) have reported median savings of around 8 to 9 percent, yet every portfolio wants to know what the catches actually look like. The six scenarios below follow the fault types that field teams find again and again in real estate, healthcare and data center buildings, with the arithmetic shown. To see how catches like these are found and verified, explore fault detection results mapped to your own portfolio with the iFactory AI team.
Six HVAC Faults That Hide in Plain Sight, and What Catching Each One Is Worth
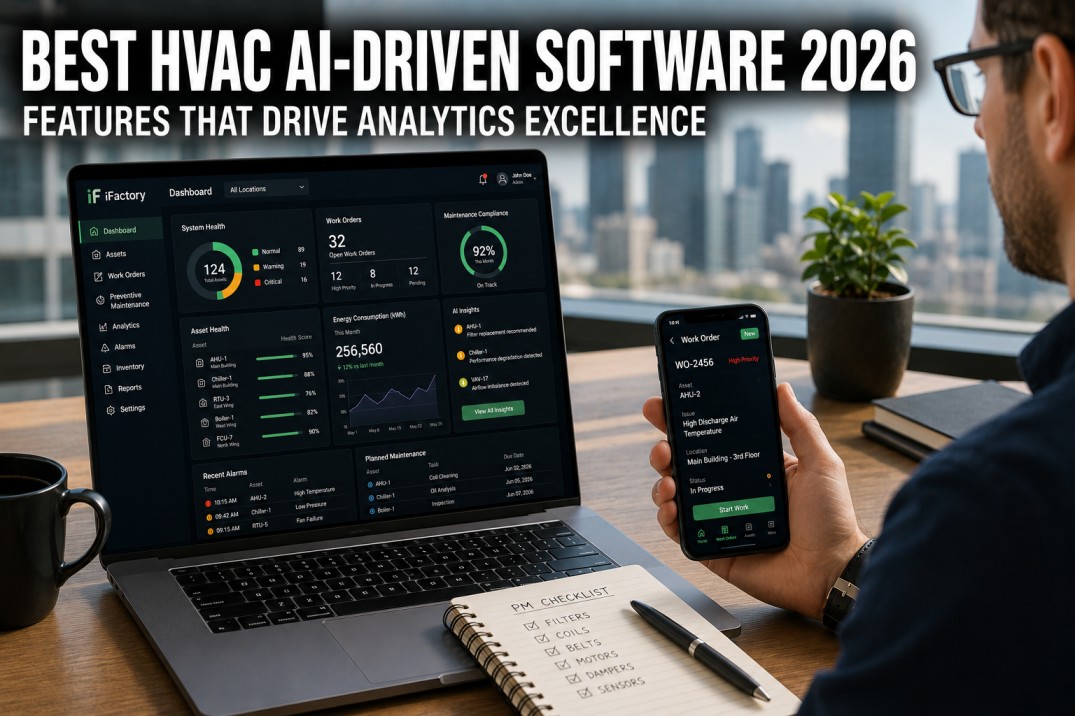
iFactory AI compares what every unit should be doing with what it is actually doing, then ranks the gaps by cost so the right fix reaches the right technician first.
What Published Research Says FDD Is Worth, and How to Read These Cases
Case studies are more convincing when they sit next to independent numbers. Four published figures frame what a typical FDD program delivers and what it costs to run.
The same Berkeley Lab paper reported median costs of about $8 per point for base software, $2.7 per point for annual software, and $8 per point for annual labor. At 1,300 points, that is roughly $3,500 for software and $10,400 for labor each year.
Every case follows that same five-step path, so you can compare very different buildings on equal terms.
REIT Portfolios: Many Similar Units and Nobody Walking Them All
A real estate portfolio has hundreds of small, similar units spread across many sites. FDD earns its keep by comparing units against their own expected behaviour and against each other.
Case 1: Retail centers with economizers stuck at minimum
Economizer actuators fail quietly. The unit still cools, so tenants never complain, yet it runs compressors on cool, dry days when outside air could do the job for free.
The $650 figure is an assumed average for free-cooling hours in a mild climate. Hot, humid regions would see less, and cool regions would see more, which is why the unit count matters less than the climate.
Case 2: An office tower air handler on an expired override
A tenant request left a manual override in place long after the event. The air handler quietly added seven extra running hours to every day, and no alarm ever fired because the unit was behaving exactly as commanded.
The 18 kWh per running hour is an assumed blend of fan and conditioning energy. Overrides rank high in many portfolios because they are cheap to fix and easy to repeat across buildings. Teams that want to scan their own sites for this pattern can see how override checks run across a portfolio.
Healthcare Sites: Strict Conditions, So Diagnoses Must Be Specific
Hospitals and clinics bring pressure relationships, humidity limits and almost no tolerance for downtime. Fixes go through facility approval, so a diagnosis has to be precise enough to approve quickly.
Case 3: A leaking reheat valve on a procedure-area air handler
A hot water reheat valve that leaks by a little never fully closes. The coil keeps adding heat, and the cooling coil works harder to remove it, so the building pays twice for the same air.
The arithmetic assumes $1.20 per therm, $0.12 per kWh, a cooling efficiency of 3.5 and continuous operation, which is common in clinical areas. A site with night setback would save less.
Case 4: Low delta-T in a central chilled water loop
Low delta-T is a classic plant-level problem that no single sensor reveals. It builds up from leaking coil valves, fouled coils and bypass flows, and it forces extra pumps and chillers to run at poor loading.
This figure is a modeled estimate for a mid-sized hospital loop rather than a simple multiplication, since pumping and chiller penalties depend on the control strategy. Facility teams often ask for help turning a loop-level symptom into a ranked repair list, and they can ask the support desk how plant-level faults are ranked.
Find Out Which of These Six Faults Are Already in Your Buildings
Share a few typical units, a plant loop or a site, and see how fault detection would rank the gaps by cost in your own climate and tariff.
Data Centers: Small Faults That Run All Year Behave Like a Fixed Charge
Data centers measure waste in kilowatts that never stop. A modest fault that runs every hour of the year adds up quickly, and redundancy can hide it for a long time.
Case 5: Neighbouring CRAH units fighting over humidity
Small differences between humidity sensors can make one unit add moisture while its neighbour removes it. Both burn energy to cancel each other out, and the room humidity looks perfectly fine on the dashboard.
The 8 kW is an assumed continuous load from steam humidification, reheat and extra cooling. Sensor drift is often the hidden cause behind this kind of fight, which is why sensor trust checks matter just as much as the fault rules themselves.
Case 6: A waterside economizer valve stuck closed
On cold days a waterside economizer lets the cooling towers do the work and the chillers rest. When its bypass valve sticks closed, the plant keeps running chillers while outdoor conditions are ideal for free cooling.
This is the largest of the six cases because the penalty is a chiller running when it did not need to. A data center team that wants to test the same logic on its own plant can review economizer changeover checks with a specialist.
Six Different Buildings, One Repeating Signal
The faults look unrelated, but each catch came from the same idea. An expected relationship between two readings broke, and the gap was large enough and persistent enough to matter.
| Case | Portfolio | Fault | Signal that gave it away | Illustrative annual impact |
|---|---|---|---|---|
| 1 | REIT retail | Economizer stuck at minimum | Mixed air ignores cool outside air | $11,700 |
| 2 | REIT office | Override never released | Fan running outside the schedule | $5,500 |
| 3 | Healthcare | Leaking reheat valve | Discharge warmer than coil leaving air | $7,900 |
| 4 | Healthcare | Low chilled water delta-T | Return water too close to supply | $14,000 |
| 5 | Data center | Humidity demand fighting | Opposite modes on neighbouring units | $8,400 |
| 6 | Data center | Economizer valve stuck closed | Chillers on during ideal free cooling | $16,200 |
Notice that none of these faults needed a new sensor. Each one was visible in points a building automation system already trends, once someone compared the right pair of values.
Four Layers Between a Raw Reading and a Repaired Fault
Good fault detection is a chain, and a weak link anywhere turns a catch into a missed opportunity. Each layer narrows the flood of data into something a technician can act on.
The first layer only works if sensors can be trusted. Drifting readings poison every layer above them, so trust scoring and drift checks belong at the base of the stack.
Teams comparing tools should look closely at layers three and four, and many check how repairs are tracked through to verified savings before choosing a platform.
How to Build Your Own Case File in the First 30 Days
A credible case study survives questions from a finance team. The checklist below keeps every catch honest, and the plan shows how a pilot can produce a first verified result within a month.
One verified catch with a clear calculation is worth more than ten estimates. Teams often plan a 30-day pilot scope with a specialist to get that first proof point.
What Facility Leaders Ask Before Trusting FDD Case Studies
See Fault Detection Catch Real Problems in Your Own Portfolio
Book a session with iFactory AI to review your units, your plant loops and your tariffs, and see how HVAC fault detection can find, rank and prove the catches that matter.