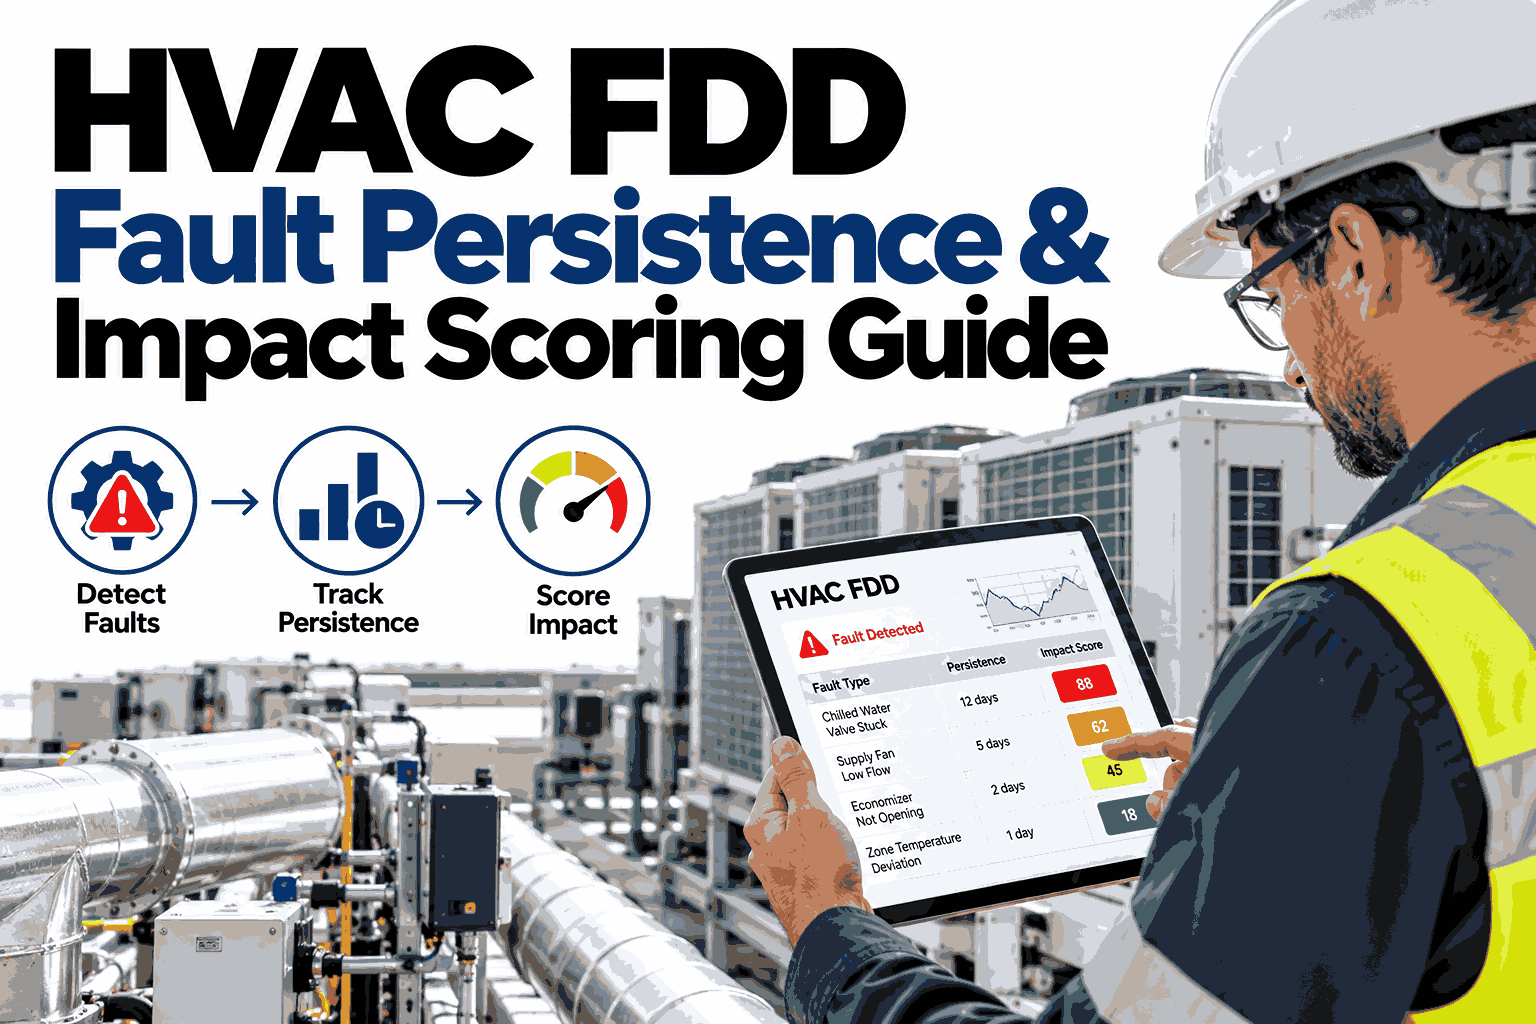
Most buildings do not suffer from a shortage of fault alerts. They suffer from a shortage of clear priorities. When a dashboard lists hundreds of open faults, technicians pick the loudest one or the easiest one, and the expensive quiet ones keep running. A fair scoring method ranks every fault by how long it lasts and how much it costs in energy, comfort and equipment life. Teams can see how iFactory AI scores faults from live building trends before they rebuild their own work queue.
HVAC FDD Fault Persistence and Impact Scoring Guide
Turn a long list of alerts into one ranked queue, so crews fix the highest-value faults first.
Why Counting Faults Is Not Enough
A large Lawrence Berkeley National Laboratory study tracked FDD reports on more than 60,000 pieces of HVAC equipment. The volume of faults it found explains why ranking matters.
When this many faults are open at once, the only workable question is which ones deserve a technician today.
Persistence: The Missing Half of the Score
Two faults can have the same size and very different costs. The strips below show 28 days, with each marked cell a day the fault was active.
The transient fault is worth a note. The persistent one is a standing cost that grows every day it is left alone.
Impact: Three Lenses on One Fault
Energy alone misses faults that hurt occupants or shorten equipment life. A useful score looks through three lenses at once.
What does it cost to run?
Estimated kWh and dollars wasted per year, based on the fault pattern and operating hours.
Who feels it?
Hours outside the setpoint band and the likelihood of complaints from affected zones.
What does it wear out?
Added cycling, runtime stress and the risk of an unplanned equipment failure.
See Your Faults Ranked by Real Impact
Book a 30-minute session and iFactory AI will show how persistence and impact combine into one priority score for your equipment.
A Ranked Work Queue in Practice
The queue below is illustrative. Each fault carries three sub-scores on a 0 to 10 scale and an overall score that decides its place in line.
A 2°F sensor offset can outrank a dramatic-looking mechanical alarm, because it runs every hour of every day and quietly drives complaints and reheat.
Turning Scores into Action Bands
A number is only useful if it triggers a clear response. Most teams map scores into three bands.
What a Good Scoring System Looks Like
Use this table to test any scoring method, including your own spreadsheet, and bring finalists to a hands-on test with your own equipment trends.
| Criterion | What Good Looks Like | Warning Sign |
|---|---|---|
| Transparency | Shows energy, comfort and reliability sub-scores | One opaque number |
| Persistence | Weights duration, not just how often alerts fire | Ranks by alert count |
| Portfolio view | Ranks faults across buildings and equipment classes | Scores only inside one site |
| Cost link | Converts impact to dollars per year | Severity labels with no cost |
| Feedback | Score drops once the fix is verified | Faults stay open after repair |
Where iFactory AI Fits
iFactory AI reads your building data, detects faults, diagnoses likely causes and ranks them so the most valuable work comes first.
Persistence tracking
Each fault carries its duration, so a standing problem rises above a passing blip.
Three-lens impact
Energy, comfort and reliability are estimated for every fault and shown side by side.
One ranked queue
Faults from many buildings are sorted into a single list that crews can work from the top.
Ask in plain language
Managers can ask why a fault ranks first and receive the drivers behind its score.
Frequently Asked Questions
What is fault persistence?
Persistence is how long a fault stays active, measured in hours or days across a period. A fault that appears briefly during a mode change is normal, while one that runs for weeks is a standing cost. Scoring should reward duration. You can watch persistence tracking in a live walkthrough.
Why not rank faults by energy alone?
Energy is only one cost. A fault that causes complaints, or that stresses a compressor toward failure, can be more urgent than its kWh suggest. A three-lens score avoids that blind spot. To see how the lenses combine, request a guided look at sub-score weighting.
How are impact scores calculated?
Each fault is compared with expected behavior, then estimated for energy, comfort hours and wear using operating data. The sub-scores are blended into one overall number. Weights can reflect your priorities, such as comfort in tenant spaces. Ask the support team about scoring options for your portfolio.
How often should scores refresh?
Daily is a common rhythm, because persistence builds over days and a fix should lower the score quickly. Faster refresh helps for critical equipment. The key is that scores change when conditions change. Schedule a review of refresh and alert settings to match your sites.
Can scores guide which jobs crews open first?
Yes. The ranked queue tells supervisors where an hour of labor returns the most energy, comfort or uptime. Many teams pair the score bands with their existing maintenance process. A short session on queue-based dispatch shows how it fits your workflow.
Fix the Faults That Matter Most First
iFactory AI tracks persistence, scores impact and ranks every fault across your buildings. Book a walkthrough to see your own priorities.