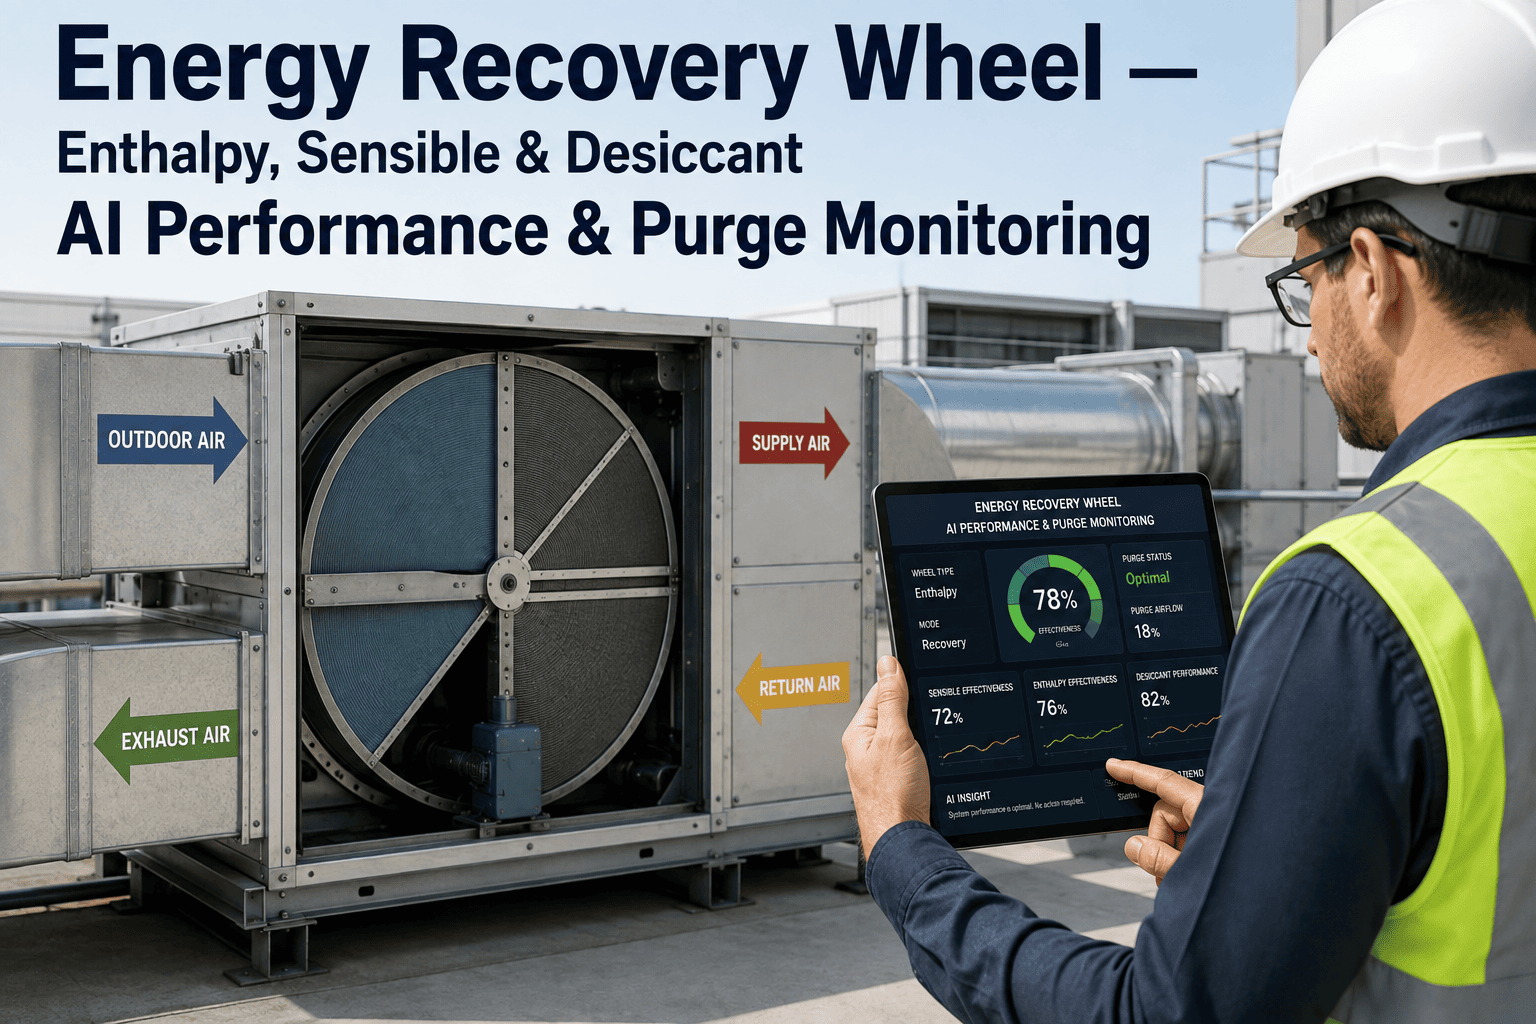
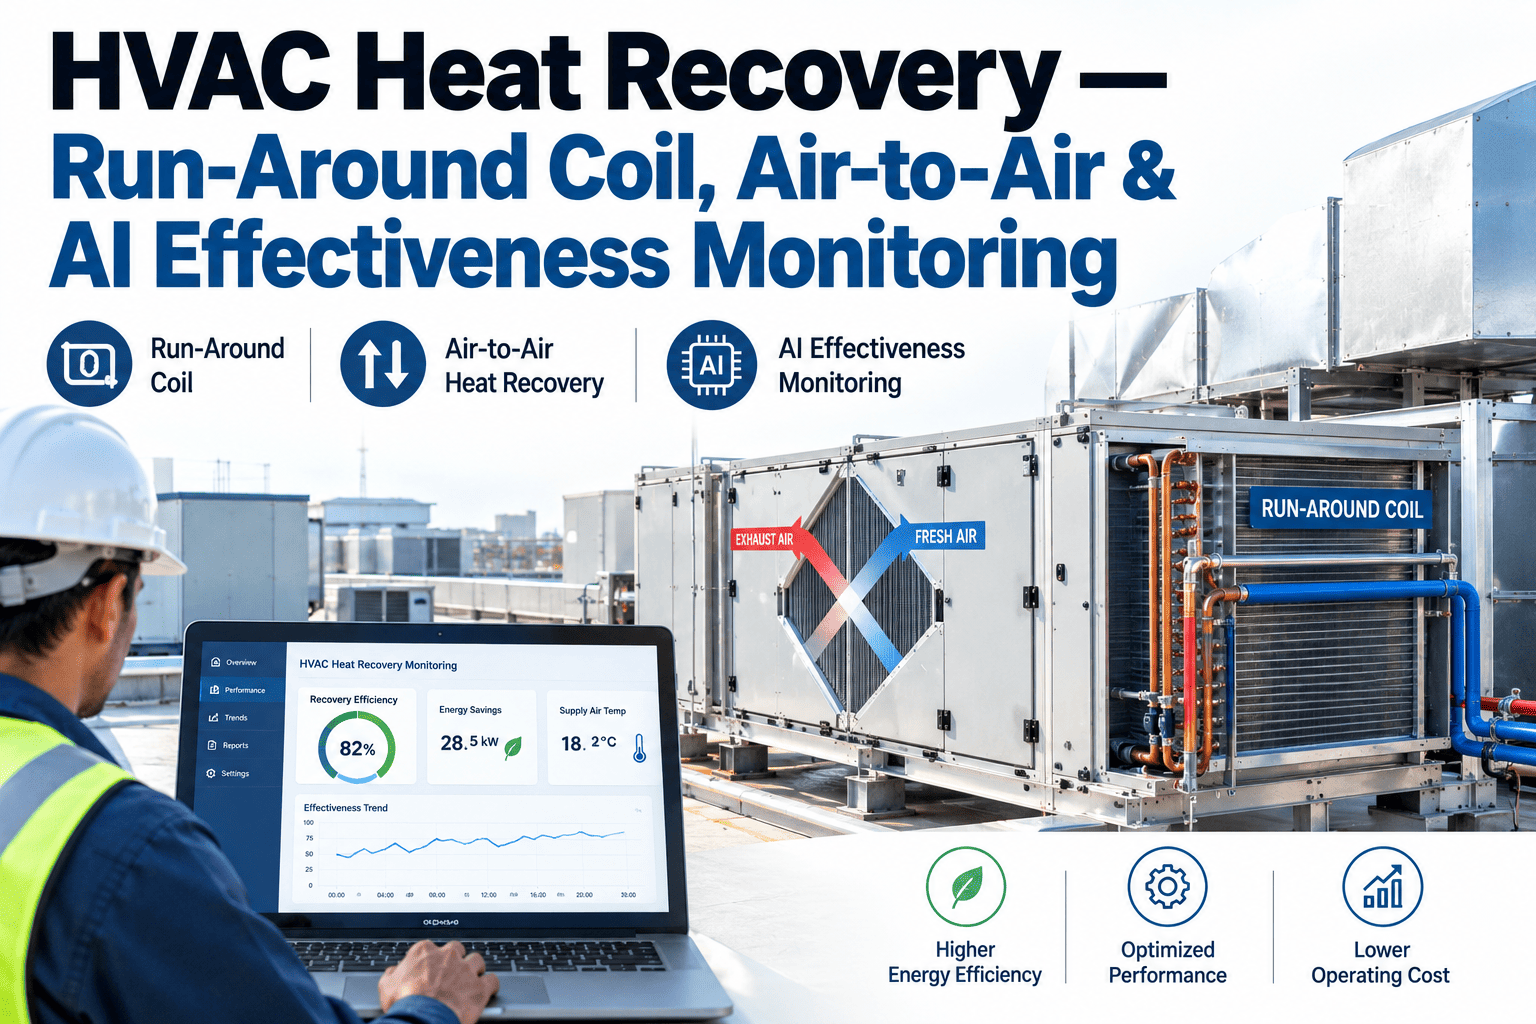
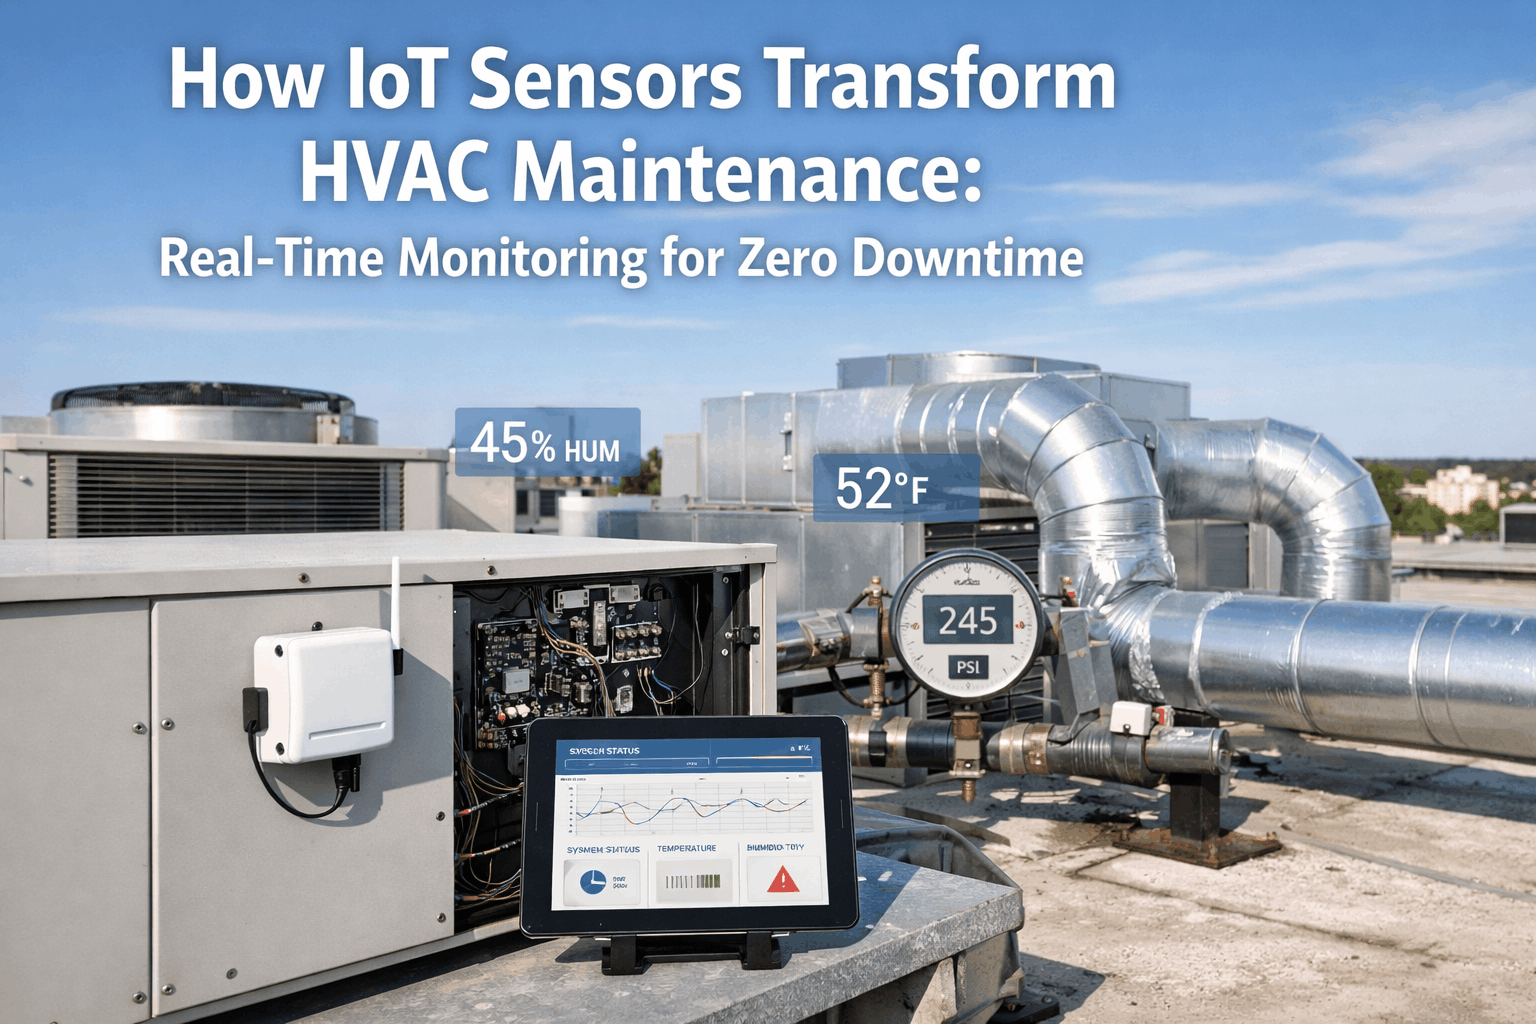
An energy recovery wheel that has quietly lost ten points of effectiveness doesn't trip an alarm or shut down — it just sits there consuming more heating and cooling energy every day while nobody notices, because the wheel is still spinning and the supply air is still, technically, within range. That silent decay exists because effectiveness itself was never something facility teams could see directly. AI performance monitoring changes that by continuously calculating enthalpy, sensible, and desiccant wheel effectiveness from existing sensor data, catching degradation and purge sector failures months before they show up on an energy bill. iFactory's building systems engineering team builds continuous effectiveness monitoring for energy recovery equipment across commercial and industrial air handling systems.
Air Handling Units · Energy Recovery AI
AI Performance Monitoring for Enthalpy, Sensible, and Desiccant Energy Recovery Wheels
Continuous effectiveness tracking, purge sector verification, and cross-contamination detection for every energy recovery wheel in the building, calculated from existing sensor data and benchmarked against the wheel's designed heat and moisture recovery rate across seasonal conditions.
Recovery Wheel Monitoring
70–80%
Typical design effectiveness
Continuous
Effectiveness calculation
3 Types
Enthalpy, sensible, desiccant
Seasonal
Performance benchmarking
Why Effectiveness Monitoring Matters
The Energy Cost of a Wheel That Looks Fine But Isn't
Energy recovery wheels are designed and specified around a rated effectiveness — typically 70 to 80 percent recovery of heat or moisture between exhaust and outdoor air streams. That number is what justified the equipment cost during design, and it's the number the energy model used to project the building's heating and cooling load reduction. The problem is that effectiveness degrades gradually through seal wear, media fouling, drive belt slippage, and bearing wear, and a wheel that has degraded to sixty percent effectiveness still spins, still moves air, and still shows up as "operating normally" on a standard BMS point list.
The financial impact compounds because energy recovery wheels typically serve the largest air handling units in a building, the ones already consuming the most heating and cooling energy. A ten-point effectiveness loss on a large make-up air unit translates directly into a proportional increase in the heating or cooling energy required to condition that outdoor air stream, month after month, until someone happens to test the wheel directly — which in most facilities only happens during a scheduled retrocommissioning study, if it happens at all.
Purge sector failures compound the problem in a different way. The purge sector exists specifically to sweep out exhaust air trapped in the wheel media before it rotates into the supply air stream, and a purge sector that has drifted out of adjustment allows exhaust air, and any contaminants in it, to cross-contaminate the supply air. In healthcare, laboratory, and food processing facilities, this isn't just an energy issue — it's an indoor air quality and cross-contamination risk that continuous monitoring is uniquely positioned to catch before it becomes an occupant complaint or a regulatory finding.
Detection Method Comparison
How Wheel Effectiveness Loss Actually Gets Found
Most buildings have no dedicated instrumentation for energy recovery wheel effectiveness — the wheel is monitored indirectly, if at all, through the same temperature and humidity sensors used for general air handling control. The table below compares how different monitoring approaches actually catch effectiveness decay in practice.
| Method |
Detection Frequency |
Effectiveness Precision |
Purge Verification |
| No dedicated monitoring |
Never, unless a complaint occurs |
None — effectiveness unknown |
None |
| Annual retrocommissioning study |
Once per year at best |
Accurate at time of test only |
Manual spot check |
| Basic BMS temperature trending |
Continuous but unprocessed |
Low — no calculated effectiveness |
Not measured |
| AI continuous effectiveness monitoring |
Continuous, calculated in real time |
High — full enthalpy/sensible calculation |
Continuous purge sector verification |
The gap between basic BMS trending and true effectiveness monitoring is larger than it appears. A BMS can show supply and exhaust air temperatures moving in the expected direction while the actual calculated effectiveness — the ratio that determines whether the wheel is delivering its design energy savings — quietly declines in the background, invisible unless someone runs the calculation deliberately and repeatedly enough to catch the trend.
See Effectiveness Monitoring Live
Watch AI Calculate Real-Time Wheel Effectiveness From Existing Sensor Data
Book a walkthrough with iFactory's building systems engineering team and see continuous energy recovery wheel monitoring running against real air handling unit data — effectiveness trending, purge sector verification, and seasonal performance benchmarking.
Wheel Types Monitored
Three Recovery Technologies, Three Different Failure Signatures
Enthalpy, sensible, and desiccant wheels each recover energy through a different mechanism, and each develops a distinct degradation signature that a monitoring platform needs to recognize individually rather than applying a single generic effectiveness model.
Type 1
Sensible Wheel
Recovers only temperature energy through the wheel's metal or polymer media, without moisture transfer. Effectiveness loss most commonly traces to seal wear allowing bypass air, or media fouling reducing surface contact area between the two air streams.
Type 2
Enthalpy Wheel
Recovers both temperature and moisture through a desiccant-coated media, making it the most common choice for climates with significant humidity load. Effectiveness monitoring must track latent and sensible recovery separately, since they can degrade independently.
Type 3
Desiccant Wheel
Purpose-built for moisture removal in dehumidification-critical applications, often paired with a separate heat recovery stage. Effectiveness decay here often traces to desiccant media degradation or contamination, which shows up as a slow decline in moisture removal capacity over months.
How Monitoring Works
From Sensor Data to Calculated Effectiveness
Continuous effectiveness monitoring doesn't require new hardware on most existing air handling units — it requires the right calculation applied continuously to sensor data the BMS is often already collecting for other control purposes.
01
Four-Point Temperature and Humidity Capture
Supply air entering and leaving the wheel, and exhaust air entering and leaving the wheel, are captured continuously. These four points are the minimum data set required to calculate true recovery effectiveness rather than estimate it from a single differential.
02
Real-Time Effectiveness Calculation
Sensible, latent, and total effectiveness are calculated continuously using the standard AHRI-referenced formulas, converting raw temperature and humidity readings into the single effectiveness percentage that facility teams actually need to track against design.
03
Seasonal and Load-Adjusted Benchmarking
Effectiveness naturally varies with outdoor air conditions and wheel rotation speed, so the AI model benchmarks current performance against expected effectiveness for the current operating condition rather than a flat annual average that would mask real degradation.
04
Purge Sector Cross-Contamination Detection
Where CO2 or other tracer signals are available in the exhaust and supply streams, the platform monitors for evidence of exhaust air carryover into supply air, flagging purge sector adjustment issues before they become an indoor air quality complaint.
05
Drive and Rotation Health Monitoring
Wheel rotation speed and drive motor current are correlated against effectiveness trends, since belt slippage or drive motor degradation is one of the most common and most easily corrected causes of effectiveness loss once it's identified.
06
Energy Impact Quantification
Effectiveness loss is translated into an estimated energy cost impact using current utility rates and outdoor air conditions, giving facility managers a dollar figure to justify maintenance action rather than an abstract percentage.
Root Cause Library
What Actually Causes Energy Recovery Wheel Effectiveness Loss
Effectiveness decay is rarely a single catastrophic failure — it's usually one or more of a small set of well-understood mechanical issues, each with a distinct signature that continuous monitoring can help distinguish.
R1
Seal Wear and Bypass Air
Perimeter and radial seals wear over years of continuous rotation, allowing unconditioned bypass air to mix directly between the supply and exhaust sides without passing through the media, reducing measured effectiveness even though the media itself is undamaged.
R2
Media Fouling and Dust Loading
Dust and airborne particulate accumulate on the media surface over time, reducing the effective surface area for heat and moisture transfer. This is one of the most common and most preventable causes, typically addressed through scheduled media cleaning.
R3
Drive Belt Slippage
A slipping or worn drive belt reduces wheel rotation speed below design, which for enthalpy and desiccant wheels reduces the moisture transfer capacity specifically, showing up as declining latent effectiveness while sensible effectiveness remains relatively stable.
R4
Purge Sector Misadjustment
The purge sector angle and timing must be precisely set relative to wheel rotation speed. Misadjustment allows exhaust air carryover into supply air, which is both an energy and an indoor air quality issue that requires mechanical readjustment to correct.
R5
Desiccant Media Degradation
On desiccant wheels specifically, the desiccant coating can degrade from chemical exposure or age, permanently reducing moisture removal capacity in a way that cleaning cannot reverse and that typically requires media or wheel replacement to fully resolve.
Field Perspective
"
Energy recovery wheels are one of the most underappreciated pieces of equipment in a commercial building, because when they're working correctly nobody thinks about them, and when they're degrading nobody notices until the energy bill or the retrocommissioning study finally catches it. I've walked into buildings where a wheel had been running at fifty percent of design effectiveness for over two years, quietly costing tens of thousands of dollars in extra heating and cooling energy, with nobody aware because the wheel was still spinning and the space temperatures were still fine. Continuous effectiveness monitoring is one of the highest-value, lowest-disruption retrofits a facility team can make, because it doesn't change how the equipment operates — it just makes visible something that was always happening in the dark.
Tobias Nkemdirim-Vasquez
Commercial HVAC Energy Performance Consultant · 16 years in air handling system commissioning and energy recovery optimization
Common Questions
Frequently Asked Questions
Do we need new sensors installed to monitor wheel effectiveness?
In most cases, no. Air handling units with energy recovery wheels typically already have supply and exhaust air temperature sensors installed for economizer and general control purposes, and these existing points often provide the minimum data set needed for effectiveness calculation. Humidity sensors for latent effectiveness calculation are less commonly present as standard equipment, so a gap analysis during onboarding identifies whether additional humidity instrumentation is needed for full enthalpy wheel monitoring.
Talk to systems engineering to review what your existing AHUs already have in place.
How much effectiveness loss actually justifies maintenance action?
Most facility teams use a threshold of ten to fifteen percent decline from the wheel's baseline or design effectiveness as the trigger for a maintenance investigation, though the right threshold depends on the wheel's size, the local climate, and current energy costs. Continuous monitoring lets a facility set that threshold explicitly and receive an alert when it's crossed, rather than relying on someone noticing a gradual trend during an annual review. The platform also quantifies the estimated energy cost of the decline, which helps facility teams prioritize which units to address first when multiple wheels show declining performance.
How does the system distinguish normal seasonal variation from actual degradation?
Effectiveness naturally shifts with outdoor air temperature, humidity, and wheel rotation speed, so the monitoring platform benchmarks current effectiveness against a model of expected performance for the current operating condition rather than comparing against a single flat number. A wheel operating at seventy percent effectiveness on a mild spring day and sixty-eight percent on a humid summer day may both be performing exactly as designed, while a wheel that shows a declining trend across matched conditions over successive months is flagged as genuine degradation.
Book a demo to see the seasonal benchmarking model in action.
Can purge sector monitoring actually detect cross-contamination without a dedicated tracer gas system?
Where a dedicated tracer gas system isn't installed, the platform uses available signals such as CO2 differential between supply and exhaust streams as an indirect indicator of purge sector performance, flagging patterns consistent with exhaust air carryover for further investigation. This indirect approach is not a replacement for a certified purge leakage test in critical applications such as healthcare isolation rooms, but it does provide continuous screening that can catch a developing misadjustment long before the next scheduled test is due.
What's the typical payback period for deploying effectiveness monitoring across a building's air handling units?
Payback varies with building size, energy costs, and how much effectiveness decay was already present and undetected at the time of deployment, but most facilities identify at least one significantly underperforming wheel within the first few months that alone justifies the monitoring investment. Beyond the immediate energy savings from catching existing decay, the ongoing value comes from preventing the same silent degradation from recurring undetected in future years, which is a benefit that compounds over the life of the equipment rather than a one-time gain.
Recovery Wheels Ready for Continuous Monitoring
Turn Every Energy Recovery Wheel Into a Continuously Verified Asset
iFactory's AI performance monitoring platform calculates real effectiveness, verifies purge sector integrity, and quantifies the energy impact of degradation across every enthalpy, sensible, and desiccant wheel in the building — built on sensor data most facilities already have in place.