An investor asks for your portfolio's Scope 1 and Scope 2 emissions broken down by building, and the answer takes three weeks to assemble because it means pulling gas bills from a dozen local utility portals, cross-referencing electricity invoices against occupancy schedules, and hand-calculating conversion factors in a spreadsheet that only one person on the team knows how to maintain. By the time the number reaches the disclosure document, it's already out of date, and nobody on the operations side has any real-time way to see which buildings are driving the trend before the next reporting cycle forces the question again. AI-driven carbon emission tracking pulls gas and electricity consumption directly from your building management systems and utility feeds, converts it to emissions automatically, and gives you a live, building-by-building decarbonization picture instead of a quarterly scramble. Book an ESG reporting demo with iFactory to see how automated Scope 1 and Scope 2 tracking turns disclosure season from a fire drill into a report you can generate on demand.
Portfolio Carbon & ESG Reporting
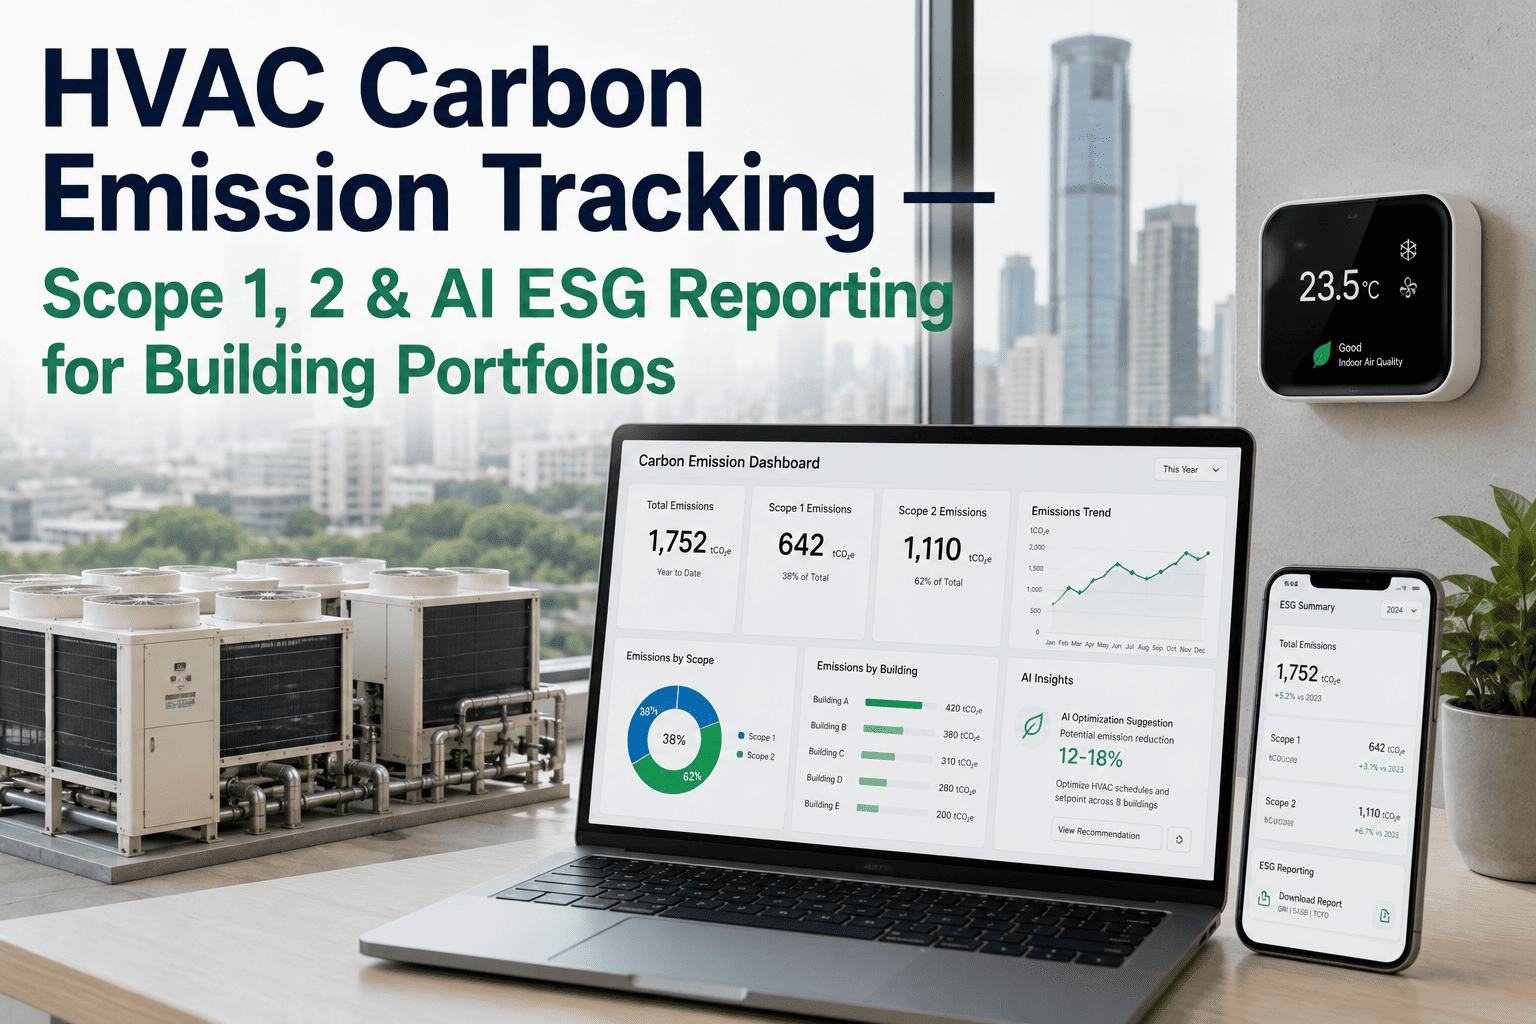
HVAC Carbon Emission Tracking: Live Scope 1 & Scope 2 Data for a Portfolio You Can Actually Report On
Automated gas heating and electricity cooling emissions tracking across every building in your portfolio, structured for investor disclosure, regulatory filing, and internal decarbonization planning without the manual spreadsheet cycle.
40%
Of a typical commercial building's operational emissions come from HVAC gas and electricity use
3+ wks
Common turnaround time for a manually assembled multi-building emissions report
Real-time
Reporting cadence possible once utility data feeds directly into an emissions model
Understanding Your Portfolio's Footprint
Scope 1 Gas Heating and Scope 2 Electricity Cooling, Broken Down Building by Building
Most commercial building portfolios have two dominant HVAC-related emissions sources, and confusing them or reporting them as a single blended figure is one of the most common mistakes in early-stage ESG disclosures. Getting the split right, and being able to show the trend for each separately, is what makes a decarbonization plan credible to an investor or regulator reviewing the filing.
Scope 1
Direct Gas Combustion
Natural gas burned on-site for boilers, furnaces, and gas-fired rooftop units counts as a direct emission source under your operational control, tracked from metered gas consumption converted using standard emissions factors.
Primary source: boiler and furnace gas consumption
Scope 2
Purchased Electricity for Cooling
Chillers, DX cooling systems, and the fan and pump electrical load supporting HVAC operation draw purchased electricity, whose emissions depend on the carbon intensity of your local grid, tracked from metered electricity use.
Primary source: chiller, DX, and auxiliary electrical load
See Your Portfolio Footprint Assembled Automatically
iFactory Connects to Your BMS and Utility Data — No Manual Spreadsheet Required
Gas and electricity consumption already flowing through your building management systems and utility accounts becomes a structured, auditable emissions report within the first data collection cycle.
Manual vs. Automated Reporting
What Changes When Emissions Data Stops Being a Quarterly Project
| Reporting Task | Manual Process | Automated Tracking |
|---|
| Data Collection | Utility portal logins per building, per month | Continuous feed from BMS and utility accounts |
| Conversion to Emissions | Manual spreadsheet formulas, factor updates by hand | Automated using current published emissions factors |
| Building-Level Detail | Often aggregated to save time | Preserved building by building continuously |
| Time to Produce a Report | Two to four weeks per cycle | Available on demand |
| Audit Trail | Scattered across spreadsheets and inboxes | Consolidated and traceable to source data |
Decarbonization Planning
From Baseline to a Documented Reduction Trajectory
A carbon reduction target is only credible if it's backed by a documented baseline and a way to track progress against it that doesn't depend on rebuilding the same manual report every quarter. A live emissions feed makes the entire trajectory visible rather than a single point-in-time snapshot.
1
Establish Baseline
A full year of gas and electricity data across the portfolio sets the reference point every future reduction is measured against.
2
Identify High-Emission Buildings
Building-by-building comparison surfaces which properties are driving portfolio emissions disproportionately relative to their square footage.
3
Prioritize Interventions
Equipment retrofits, control optimization, or fuel-switching projects get sequenced against buildings where they'll move the portfolio number most.
4
Track Against Trajectory
Progress toward the stated reduction target is visible continuously rather than reconstructed at each disclosure deadline.
Implementation Path
Getting Your Portfolio Onto Automated Emissions Tracking
Weeks 1-2
Portfolio Inventory
Catalog every building, its gas and electricity accounts, and existing BMS data availability across the portfolio.
Weeks 3-4
Data Connection
Link utility accounts and BMS trend points into a unified consumption feed, validated against recent utility bills.
Weeks 5-6
Emissions Modeling
Apply current emissions factors by region and fuel type to produce Scope 1 and Scope 2 figures per building.
Week 7+
Live Reporting
Disclosure-ready reports become available on demand, with full building-level detail preserved for audit purposes.
Every operations director I've worked with underestimates how much time their team loses to emissions reporting until they see it laid out. It's rarely one big task, it's dozens of small ones scattered across a quarter, a utility portal login here, a spreadsheet reconciliation there, and by the time the number is finalized the team has already moved on to the next fire. The value of automating this isn't just accuracy, though accuracy improves too. It's getting that scattered time back and being able to answer an investor's question about a specific building in an afternoon instead of a month.
Priyanka Devereaux-Nair
ESG & Sustainability Advisor · 14 years advising commercial real estate portfolios on emissions disclosure
Operations Director Questions
HVAC Carbon Emission Tracking — Frequently Asked
Does this cover Scope 3 emissions as well, or only Scope 1 and Scope 2?
The core tracking is built around Scope 1 gas combustion and Scope 2 purchased electricity, since these are the emissions categories most directly tied to HVAC operation and most reliably measured from metered consumption data. Scope 3 emissions, which include tenant activity, supply chain, and embodied carbon in materials, involve a much broader data collection challenge outside HVAC operations specifically.
Contact our support team to discuss how Scope 1 and 2 tracking can integrate with a broader Scope 3 initiative you may already have underway.
How does the system handle buildings on different utility providers with different billing cycles?
Each building's utility accounts are connected independently, and the emissions model normalizes consumption data to a consistent reporting period regardless of when each individual utility bills, so a portfolio spanning multiple providers and billing cycles still produces a single, aligned monthly or quarterly view rather than a patchwork of mismatched reporting windows.
What emissions factors are used, and are they kept current with regulatory changes?
Emissions conversion factors are drawn from current published sources appropriate to each building's fuel type and grid region, and are updated as those published factors change, which matters because electricity grid carbon intensity in particular shifts over time as regional generation mixes evolve. Using outdated factors is one of the more common quiet errors in manually maintained emissions spreadsheets, since nobody remembers to update a number buried in a formula from two years ago.
Can this data be exported in the format our ESG disclosure framework requires?
Yes, building-level and portfolio-level emissions data is structured to be exportable into common disclosure formats used for investor reporting and regulatory filing, and the underlying source data remains traceable for audit purposes rather than existing only as a final aggregated number.
Book a demo to see the specific export formats relevant to your disclosure requirements.
How quickly can we establish a credible baseline if we're starting from scratch?
A meaningful baseline typically requires at least twelve months of consumption data to account for seasonal heating and cooling variation across a full year, though the tracking infrastructure itself can be connected and validated well before that full year is complete. Many portfolios already have historical utility billing data available that can be imported to establish a retroactive baseline rather than waiting a full year to start measuring forward.
Stop Rebuilding the Same Report Every Quarter
Get a Live, Building-by-Building Emissions Picture Across Your Portfolio
iFactory connects to your BMS and utility accounts, converts consumption into Scope 1 and Scope 2 emissions automatically, and gives you a disclosure-ready report on demand instead of a quarterly scramble.