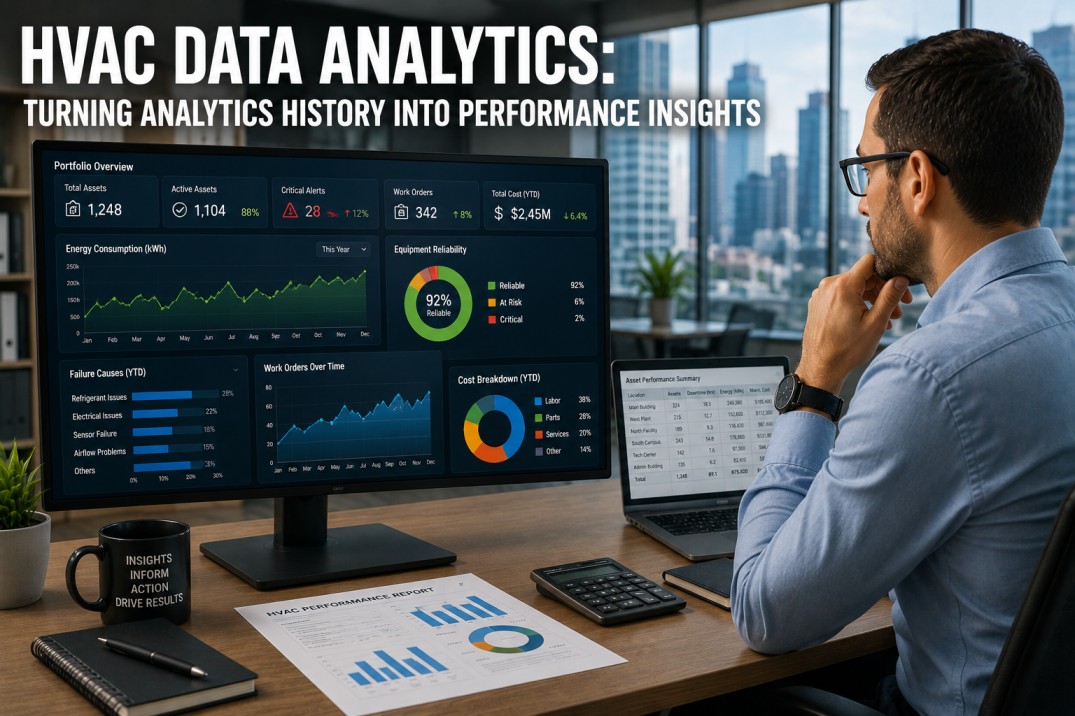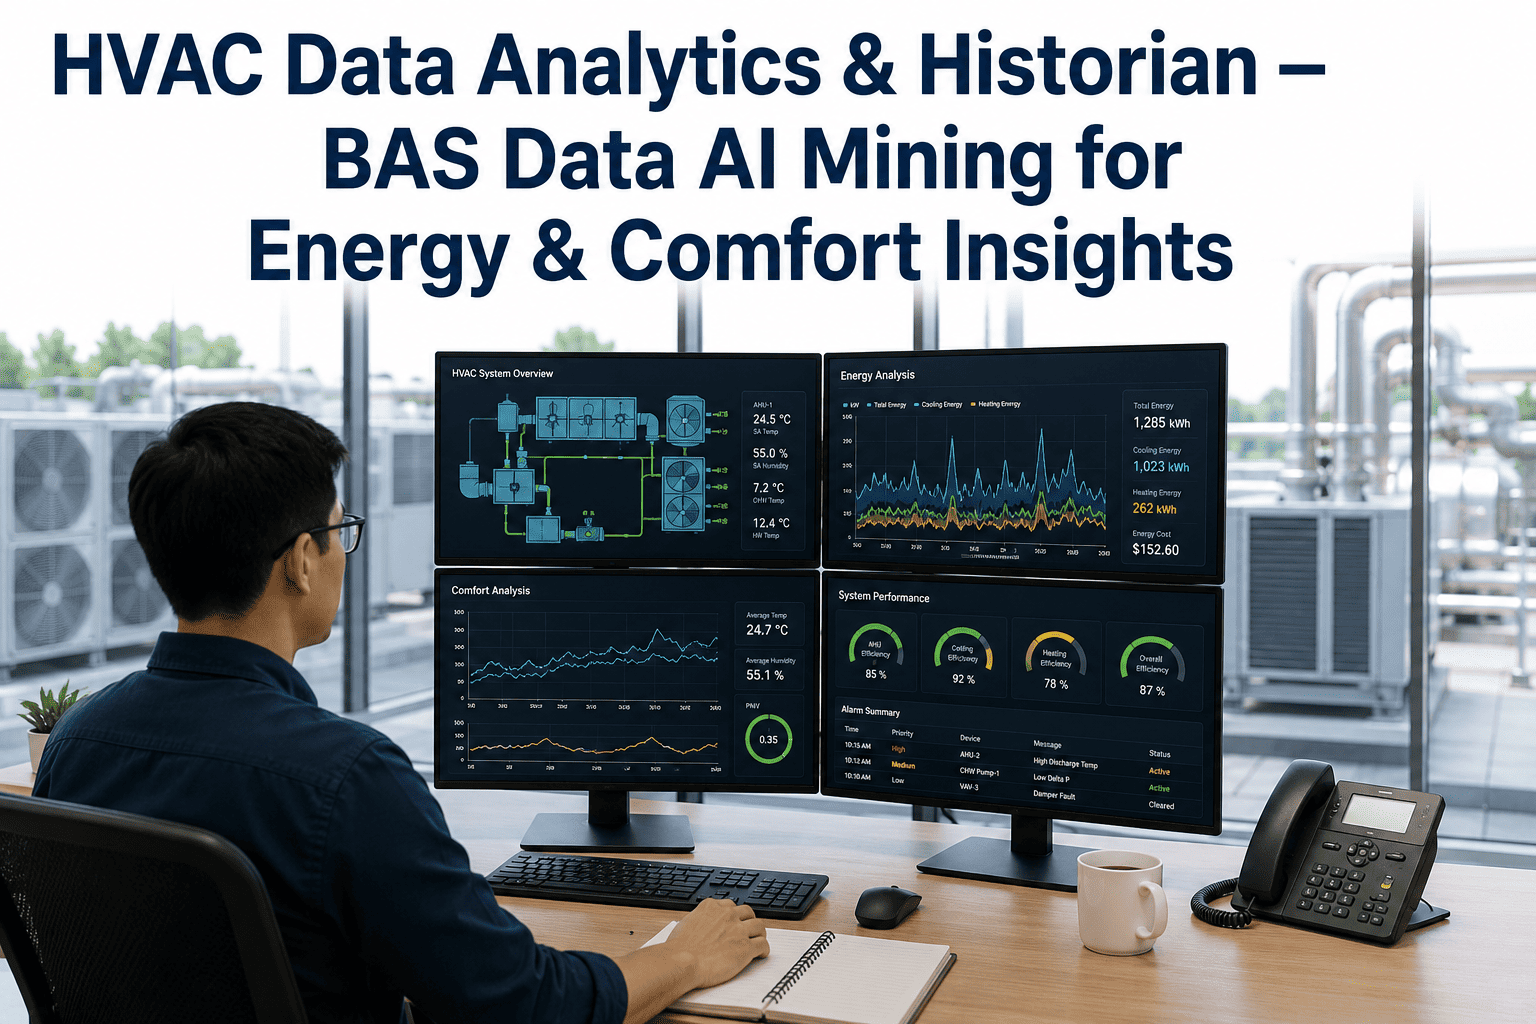
Every commercial building with a BAS has been quietly writing a diary for years — trend logs of every temperature, pressure, and valve position, recorded every few minutes since the day the system was commissioned. Almost none of it gets read. Process engineers pull historian data when something has already gone wrong, use it to confirm what they already suspected, and then let it pile up again until the next incident. That buried archive usually holds the answer to problems the team has been fighting for months: the AHU that short-cycles every afternoon, the zone that never quite holds setpoint, the chiller plant that runs less efficiently every summer. AI-driven mining of that historian data turns years of ignored trend logs into a ranked list of fixable problems — Book a Demo to see what is sitting in yours.
Your Historian Already Has the Answers
iFactory mines years of BAS trend data with AI to surface energy waste, comfort failures, and equipment degradation your team has never had time to find manually.
Years of Historian Data, Never Actually Read
Process engineers are not ignoring their historian data on purpose — there simply is not enough time to manually chart, compare, and interpret millions of data points across hundreds of building points. Three kinds of insight consistently sit buried until an AI mining pass surfaces them.
The Slow Drift Nobody Notices Day to Day
A damper actuator losing calibration over eighteen months produces a change too gradual to catch on any single day's trend, but unmistakable across two years of historian data.
The Recurring Pattern Mistaken for a One-Off
A zone that overheats every Tuesday afternoon looks like an isolated complaint until historian mining shows it has happened the same way for 40 consecutive weeks.
The Interaction Between Two Unrelated Systems
A chiller plant inefficiency that only appears when a specific air handler is staged a certain way is nearly impossible to spot without correlating both systems' full trend history.
How AI Mining Finds What Manual Review Misses
Pattern Recognition Across Full History
Machine learning models scan the entire historian archive at once, not just the last 30 days, catching seasonal and slow-drift patterns a human review would never have time to chart.
Cross-Point Correlation
The AI checks relationships between hundreds of points simultaneously, flagging combinations — like a valve position and a supply air temperature — that move together in ways that indicate a fault.
Energy Waste Quantification
Every flagged pattern is translated into an estimated energy and cost impact, so process engineers can prioritize fixes by financial return rather than gut feel.
Comfort Impact Scoring
Zones with recurring setpoint deviations are scored by frequency and severity, giving facilities teams an objective way to prioritize comfort complaints instead of reacting to whoever calls first.
Continuous Re-Mining as New Data Arrives
The historian is never "done" being mined — new trend data is analyzed on an ongoing basis, so newly emerging faults get caught within days rather than after years of drift.
Insight Types Surfaced by Historian Mining
Not every insight looks the same, and each type calls for a different response from the operations team. This breakdown shows what typically comes out of a first mining pass on a building with several years of trend history.
| Insight Type | Typical Source | Detection Method | Priority |
|---|---|---|---|
| Simultaneous Heating/Cooling | Valve Position Trends | Cross-Point Correlation | High |
| Sensor Drift | Slow Trend Deviation | Long-Window Pattern Scan | Medium |
| Short-Cycling Equipment | Runtime Frequency Logs | Cycle Frequency Analysis | High |
| Chronic Comfort Deviation | Zone Temperature History | Recurring Pattern Detection | Medium |
| Schedule/Occupancy Mismatch | Setpoint vs. Occupancy Data | Correlation Scoring | Medium |
We had a chiller running inefficient staging for over two years and nobody caught it, because on any given week it looked normal. The AI mining pass found it in the first batch by comparing this year's trend against three years back. That single insight paid for the platform in one summer.
From Raw Points to Prioritized Insight
Historian mining is not a one-time report — it is a continuous pipeline that keeps working after the first pass is done.
Find Out What Your Historian Has Been Trying to Tell You
Most buildings are sitting on years of unread trend data. See what a first AI mining pass finds in yours.
Comfort and Energy: Two Sides of the Same Data
Process engineers often think of energy optimization and comfort troubleshooting as separate projects with separate priorities, but historian mining tends to reveal they are usually the same problem viewed from two angles. A zone that is simultaneously heating and cooling wastes energy and produces the temperature swings that generate complaints. A chiller plant staged inefficiently both drives up utility costs and struggles to meet load during peak demand, showing up as warm afternoons on the top floor. Because AI mining scores every finding on both dimensions at once, fixing the highest-priority issue on the list typically improves energy performance and comfort together, rather than forcing a trade-off between the two. This is part of why mining-driven prioritization tends to get faster buy-in from both facilities and finance — the same fix shows up as a win on two different reports.
Week 1: Historian Connection
Read-only connection established to your historian database, with no disruption to existing BAS operation.
Week 2: Baseline Mining Pass
AI models scan all available trend history and produce the first ranked insight report for your review.
Week 3: Priority Validation
Your process engineering team reviews top findings and confirms priority order against known operational constraints.
Week 4: Continuous Mining Live
Ongoing mining begins, with new insights surfacing automatically as fresh trend data accumulates.
Frequently Asked Questions
Do we need a specific historian software for this to work?
iFactory connects to most common building historian and trend log systems through standard database and protocol connections. If your data currently lives in a proprietary BAS-native historian rather than a dedicated database, our team assesses connectivity during onboarding and typically finds a workable path without requiring you to replace your existing historian platform.
How far back does the AI need to look to find useful patterns?
More history generally produces stronger findings, since slow-drift and seasonal patterns only become visible across multiple years of data. That said, the first mining pass still produces useful results from as little as six to twelve months of trend data, and the model's accuracy improves as more historical and ongoing data becomes available.
Will this replace our process engineers or just give them more work?
It is designed to remove the impossible task of manually charting millions of data points, not to add another report to review. Instead of scanning raw trends, your process engineers get a short, ranked list of validated findings with estimated impact, so their time goes into deciding what to fix rather than hunting for what might be wrong.
How does the platform estimate the energy cost of each finding?
Each flagged pattern is quantified using the duration, magnitude, and frequency of the deviation combined with your building's utility rate data, producing a defensible estimate of associated cost rather than a rough guess. These estimates are refined over time as actual post-fix performance data comes back into the historian.
Can we get help interpreting a finding before we act on it?
Yes. Every finding in the report includes the underlying trend data and correlation that produced it, and our Support team is available to walk through specific findings with your engineering team before any operational change is made.
Stop Letting Years of Trend Data Go to Waste
iFactory's AI mining turns your historian archive into a ranked, actionable list of energy and comfort fixes — no manual charting required.