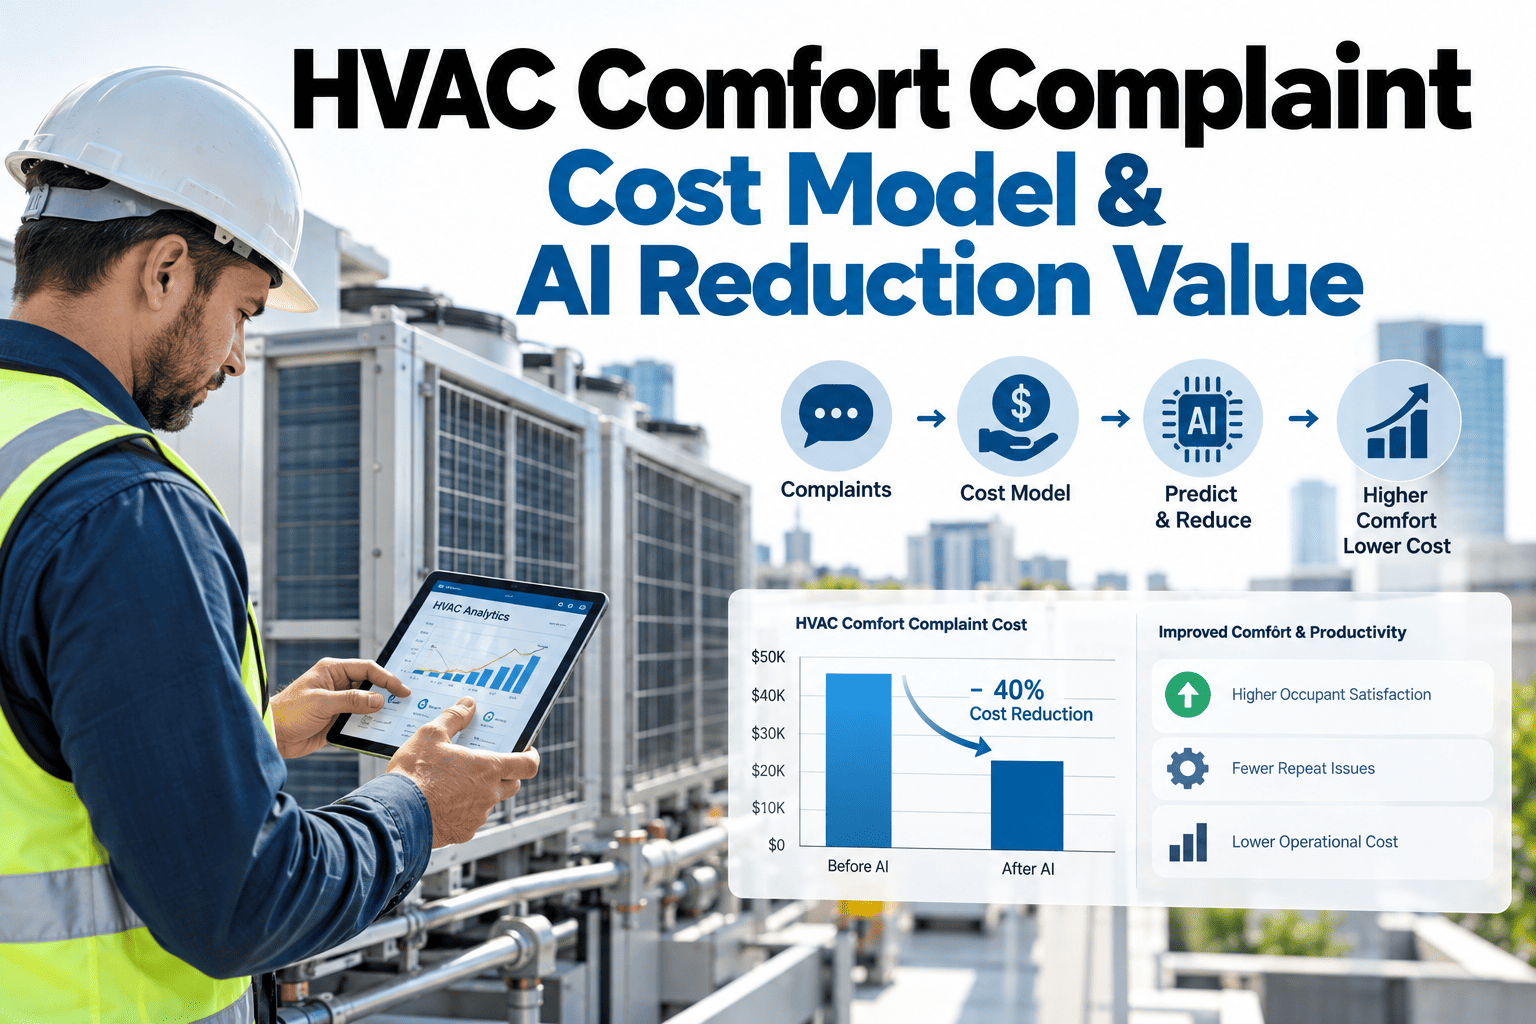
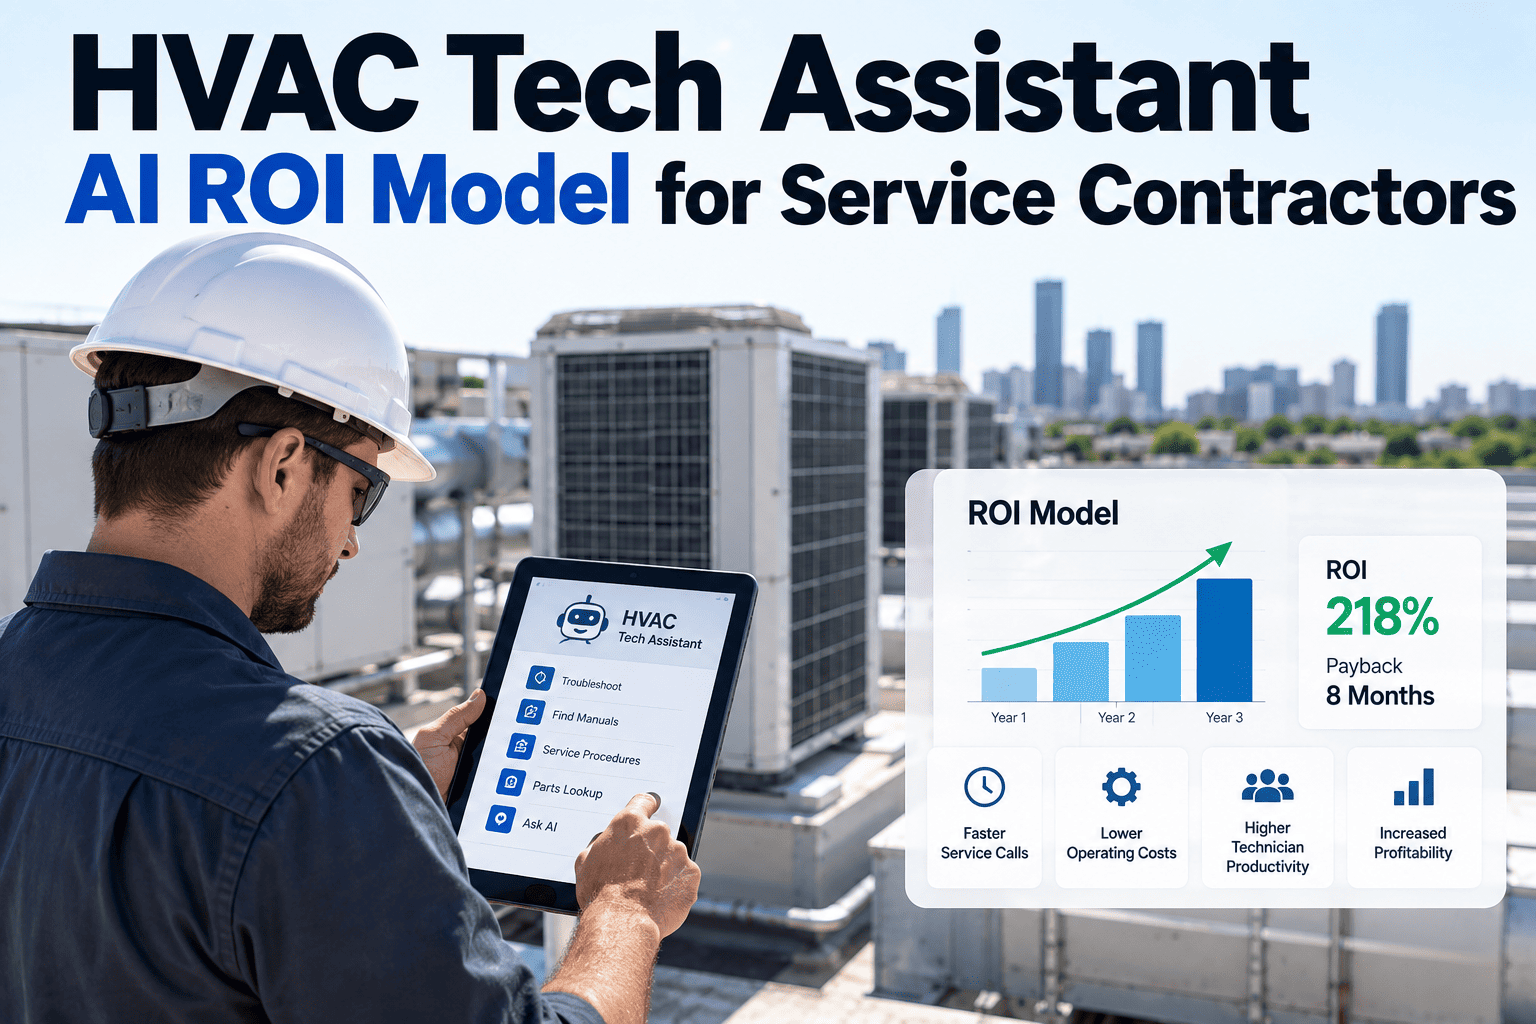
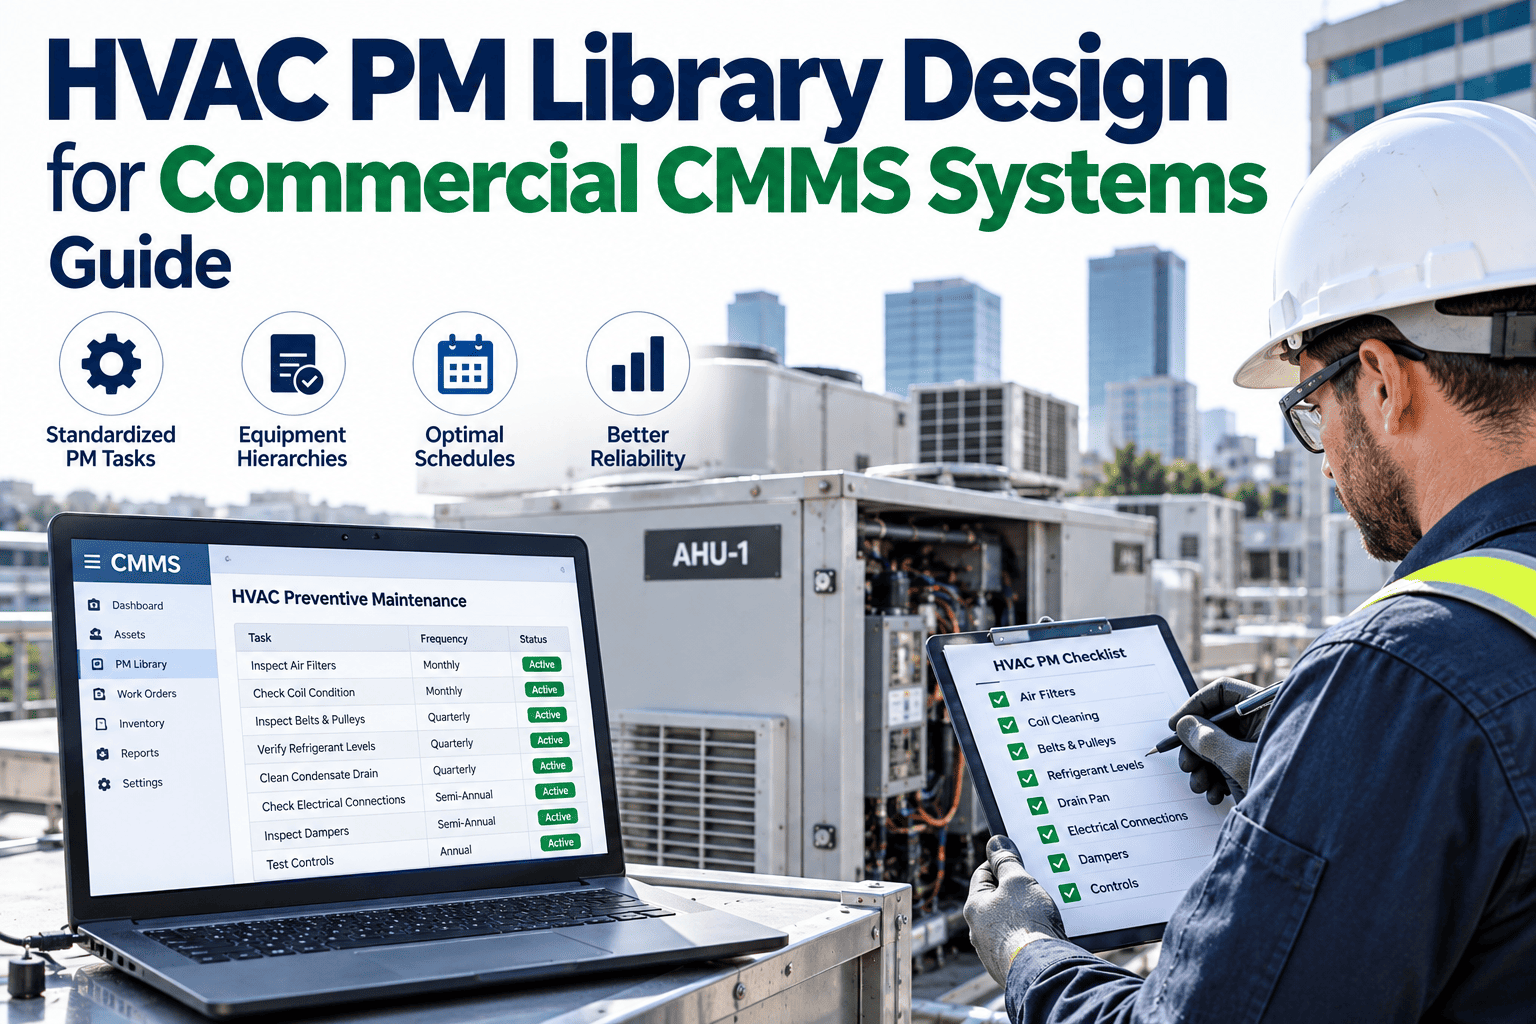
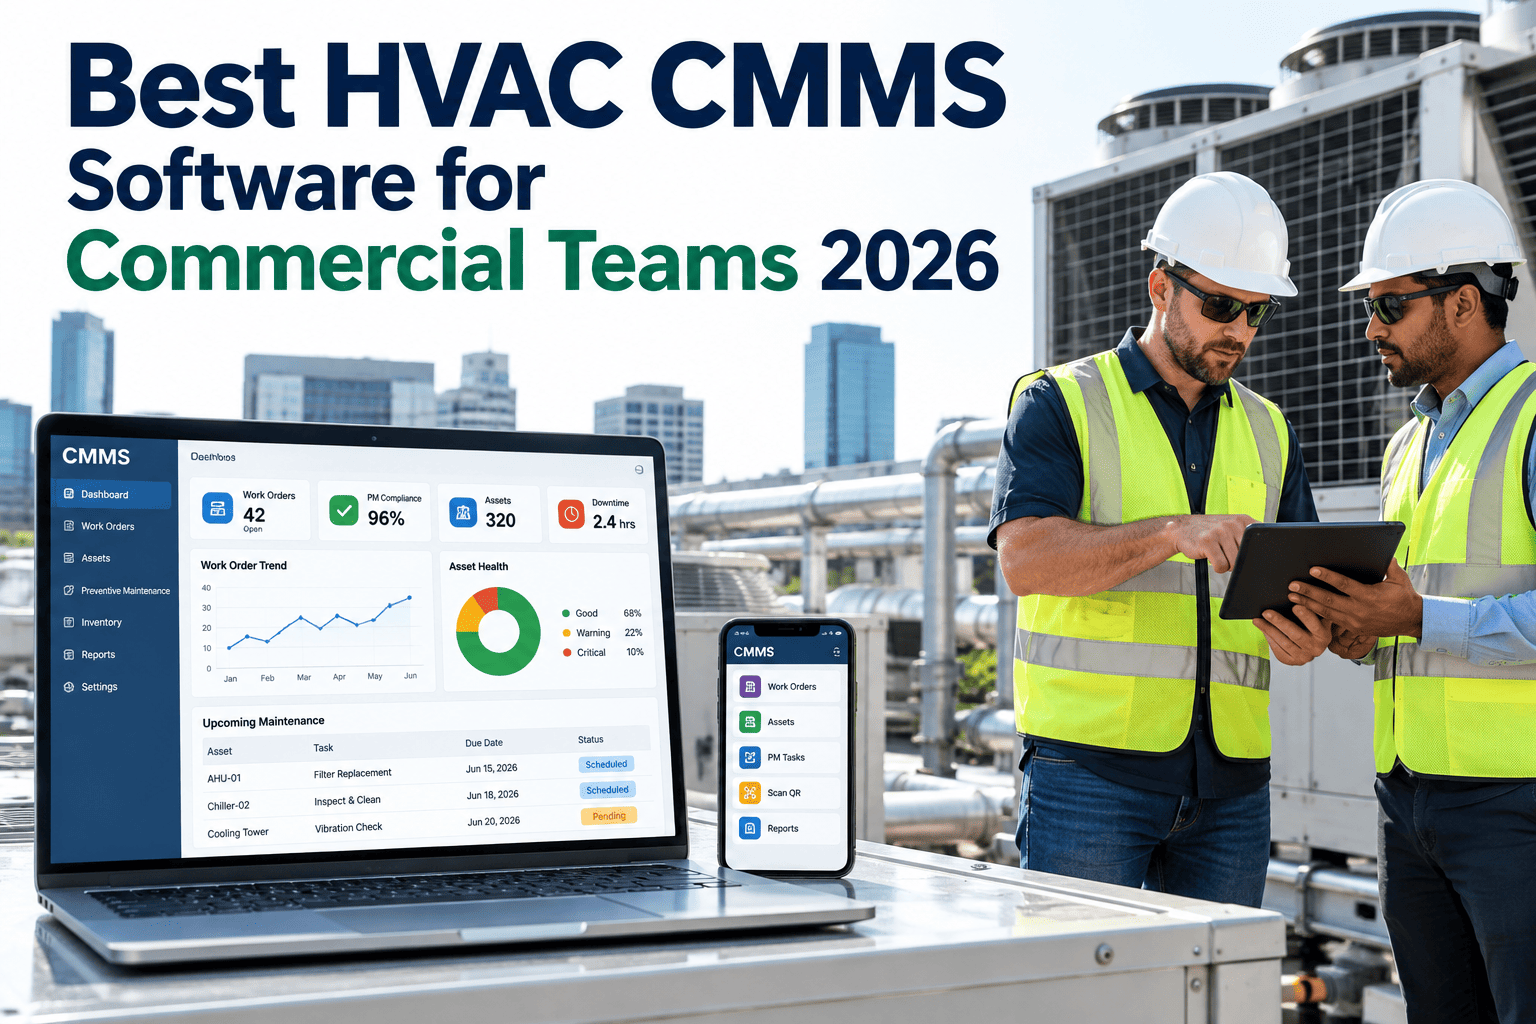
A rooftop unit failure on a typical Tuesday afternoon looks like a single line item on a maintenance invoice, but the actual total cost stacks up across several categories most commercial owners never see itemized in one place — the repair bill itself, the rush parts markup, the emergency contractor premium, the tenant complaints and possible rent concessions, and the quieter reputational cost of a building that develops a reputation for comfort failures. Owners who want to see that full stack rather than just the repair invoice can Book a Demo to see how iFactory models the true cost of HVAC emergency downtime.
Why the Repair Invoice Is Only the Visible Fraction of the Cost
When a commercial building owner reviews HVAC spending, the number that gets tracked and reported is almost always the repair invoice — the line item a contractor submits after fixing a failed compressor, a seized fan motor, or a leaking coil. That number is real, but it represents only the most visible fraction of what an emergency failure actually costs the building. Rush parts sourced outside normal procurement channels carry a markup that rarely shows up as a clearly separate line item anywhere. Emergency contractor labor billed at overtime or weekend rates costs substantially more than the same repair scheduled during normal business hours. And the costs that never appear on any HVAC invoice at all — tenant complaints, potential lease concessions, and the slow erosion of a building's reputation for reliability — often exceed the visible repair cost by a wide margin once they are actually tallied.
The Five Cost Layers of an Emergency HVAC Failure
Building a complete picture of emergency downtime cost requires breaking the event into five distinct layers, each with its own cost driver and its own degree of visibility to building ownership. Direct repair cost is the most visible and the easiest to track. Rush parts markup and emergency contractor premium are usually visible but rarely separated out from the base repair cost in a way that lets an owner see how much the emergency timing itself added to the bill. Tenant loss and reputation damage are the least visible layers, often never formally tracked at all, despite frequently representing the largest share of the total cost once a failure affects occupied space during business hours.
Direct Repair Cost
The base cost of parts and labor required to fix the failed component, comparable to what the same repair would cost if performed as scheduled, non-emergency work.
Rush Parts Markup
The premium paid for expedited shipping and sourcing parts outside normal procurement channels, often from a secondary supplier at a materially higher unit cost.
Emergency Contractor Premium
Overtime, weekend, or after-hours labor rates charged for emergency dispatch, typically well above the standard rate the same contractor would charge for scheduled work.
Tenant Loss
Lease concessions, rent credits, or early termination risk associated with tenant dissatisfaction following a comfort failure, particularly one that recurs or extends for multiple hours.
Reputation Damage
The harder-to-quantify but very real cost of a building developing a reputation for unreliable comfort, affecting future leasing negotiations and tenant renewal decisions.
Rush Parts and Contractor Premiums: The Markup Nobody Separates Out
When a critical HVAC component fails during occupied hours, the procurement process changes entirely from how a planned replacement would normally happen. Instead of sourcing a part through standard channels at a negotiated rate with a lead time measured in days, an emergency failure forces sourcing from whatever supplier has the part in stock right now, often at a significant premium, with expedited shipping charges stacked on top, and the contractor dispatched to perform the emergency repair typically charges an overtime or emergency call-out rate that can run well above their standard scheduled rate, and because building owners rarely request an itemized breakdown separating base labor from the emergency premium, this markup gets absorbed into a single invoice total that obscures exactly how much the emergency timing itself cost.
| Cost Component | Planned Maintenance Repair | Emergency Repair |
|---|---|---|
| Parts sourcing | Standard procurement, negotiated rate | Rush sourcing, premium markup |
| Labor rate | Standard business-hours rate | Overtime or emergency call-out rate |
| Shipping and logistics | Standard lead time, low cost | Expedited shipping, added premium |
| Scheduling flexibility | Timed around occupancy and operations | Immediate, regardless of staffing availability |
Tenant Loss: The Layer That Shows Up in the Lease, Not the Invoice
A comfort failure during occupied hours rarely stays contained to a maintenance issue — it becomes a tenant relations issue almost immediately, and the financial consequences of that shift often land in a completely different part of the owner's ledger than the HVAC repair invoice itself. Commercial leases frequently include comfort or habitability clauses that can trigger rent credits or concessions when temperature conditions fall outside an agreed range for an extended period, and repeated failures can weaken an owner's negotiating position at lease renewal, sometimes forcing concessions on rate or term simply to retain a tenant who has grown wary of the building's HVAC reliability.
The severity of tenant loss scales considerably with how the failure is handled, not just whether it happens in the first place. A single isolated incident resolved quickly with clear communication rarely does lasting damage to a tenant relationship, but a pattern of recurring failures, slow response times, or failures that extend across multiple hours or days creates a cumulative impression that becomes difficult to reverse, regardless of how promptly any individual incident is eventually resolved. This is why tracking failure frequency and response time alongside repair cost gives a far more complete picture of tenant risk than tracking repair spending alone.
Reputation Damage: The Cost That Compounds Silently Across a Portfolio
Reputation damage is the hardest layer of emergency downtime cost to quantify precisely, but it is also the layer with the longest tail, since a building's reputation for HVAC reliability influences leasing decisions well beyond any single tenant directly affected by a specific failure. Prospective tenants increasingly do informal diligence and background checking on a building's operational history before signing a lease, whether through direct conversations with current occupants or through commercial real estate networks where word travels about buildings known for comfort problems, and a building carrying that reputation faces longer vacancy periods and weaker negotiating leverage on lease terms even when its current HVAC condition has actually improved.
How Predictive Maintenance Changes the Cost Stack
Every layer of the emergency downtime cost stack shrinks or disappears entirely when a failure is caught and addressed before it becomes an emergency. Predictive maintenance — monitoring equipment condition continuously and flagging degradation before it causes a failure — converts what would have been an emergency, after-hours repair into a scheduled, planned intervention performed during normal business hours using standard parts procurement and standard labor rates. The direct repair cost often stays similar, but the rush parts markup and contractor premium disappear entirely, and because the intervention happens before comfort is actually affected, the tenant loss and reputation damage layers never materialize in the first place.
This shift from reactive to predictive maintenance does not just reduce cost on a per-incident basis — it changes the overall risk profile of the building's HVAC operation across an entire year. A building running primarily on reactive, emergency-driven maintenance experiences its cost and tenant risk concentrated in unpredictable spikes tied to whenever equipment happens to fail, while a building running predictive maintenance experiences a much smoother, more budgetable cost profile with tenant-facing incidents becoming rare rather than a recurring operational reality that tenant relations teams have simply learned to manage around.
Building Your Own Downtime Cost Model
Owners who want to move from a general sense that emergency repairs cost more to an actual quantified model need to track a specific set of data points across their own portfolio's HVAC incident history. This does not require sophisticated new software from day one — it starts with disciplined data capture on every emergency incident, building toward a dataset robust enough to reveal genuine patterns rather than relying on memory or anecdote about which buildings or equipment types drive the most emergency cost.
Capture Every Cost Layer on Each Incident
Record direct repair cost, parts markup, and labor premium separately for every emergency HVAC incident rather than accepting a single bundled invoice total.
Log Tenant Impact Alongside Repair Data
Track tenant complaints, response time, and any concessions or credits issued in connection with each incident, linking tenant relations data to the same event record as the repair cost.
Compare Emergency and Planned Repair Costs
Where possible, compare the cost of emergency repairs against quotes for the same repair performed on a planned basis, quantifying the specific premium tied to emergency timing.
Aggregate Across the Portfolio
Roll incident-level data up to the portfolio level to identify which buildings, equipment types, or seasons drive the highest emergency cost concentration.
Seasonal Concentration: Why Emergency Cost Rarely Distributes Evenly
Emergency HVAC failures rarely spread evenly across a calendar year — they concentrate heavily around the periods when equipment is working hardest, typically the peak of summer cooling demand and the depth of winter heating demand, when components already operating near their design limits are most likely to fail outright rather than continuing to limp along in a degraded state. This seasonal concentration matters for cost planning because it means a building's emergency HVAC budget cannot be reasonably modeled as a flat monthly average — the true risk window is compressed into a much narrower period, and contractor availability during that same window is often at its tightest, which further inflates the emergency premium precisely when a building is most likely to need it.
Owners who track incident timing alongside cost consistently find that a disproportionate share of their annual emergency HVAC spending clusters into just a few weeks of extreme weather, and this pattern has direct implications for how predictive maintenance should be prioritized across a building portfolio each year. Condition monitoring and pre-season inspection focused specifically on equipment that will be stressed hardest during the coming peak season catches a meaningful share of failures before they happen, converting what would have been a peak-season emergency, with its compounded cost and contractor scarcity, into an off-season planned repair performed under far more favorable conditions and at a materially lower total cost.
Portfolio-Level Patterns: What Aggregated Data Reveals That Single Incidents Hide
A single emergency HVAC incident, viewed in isolation, tells an owner very little beyond what happened on that specific day at that specific building. The real strategic value of downtime cost tracking emerges only once enough incidents have accumulated across a portfolio to reveal genuine patterns — which buildings experience disproportionately high emergency cost relative to their size and equipment age, which equipment types or manufacturers show a pattern of premature failure, and which contractors or service providers charge emergency premiums well above what peers in the same market typically charge for comparable work.
These portfolio-level patterns often surface findings that would be invisible from any single building's perspective, such as a specific equipment vintage that reliably starts generating a disproportionate share of emergency calls once it passes a certain age threshold, giving asset management teams a data-driven trigger for proactive replacement planning rather than waiting for each individual unit to fail on its own unpredictable timeline, which is precisely the kind of pattern a single-building view can never reveal on its own. Owners managing multiple properties who invest in this kind of aggregated tracking consistently find opportunities for both cost reduction and capital planning improvement that a building-by-building view alone would never surface, often uncovering a small handful of chronically underperforming assets responsible for a wildly disproportionate share of total portfolio emergency spending.
Frequently Asked Questions: HVAC Emergency Downtime Cost
How much more does an emergency HVAC repair typically cost compared to the same repair scheduled in advance?
Total cost for an emergency repair commonly runs two to four times higher than the same repair performed on a planned basis, once rush parts markup and emergency contractor premium are factored in alongside the base repair cost, and that multiple can climb further when tenant concessions or repeat-incident reputation effects are included in the calculation. The exact multiple varies by equipment type, region, and how far outside normal business hours the failure occurs, with after-hours and weekend failures typically carrying the steepest premiums of all. Owners can Book a Demo to model the specific cost multiple for their own building portfolio and equipment mix, using actual historical incident data rather than industry averages that may not reflect their specific climate zone or equipment vintage.
Is tenant loss worth tracking formally, or is it too subjective to quantify meaningfully?
Tenant loss can be tracked with reasonable objectivity by logging concrete events — formal complaints filed, rent concessions or credits issued, lease renewal terms that shifted following a comfort incident, and tenant turnover following a documented pattern of HVAC issues — rather than attempting to estimate a vague reputational cost figure. Even a conservative accounting of these concrete events typically reveals a meaningful cost that most owners have never formally aggregated or reviewed, since each individual incident tends to get handled and forgotten rather than tracked as part of a larger pattern.
How quickly can predictive maintenance realistically reduce emergency downtime cost for an existing building?
Most buildings see a measurable reduction in emergency incidents within the first two to three months of predictive maintenance deployment on critical equipment, as condition monitoring begins catching degradation that would previously have gone unnoticed until failure. The full cost reduction typically becomes clear over a full seasonal cycle, since HVAC failure patterns often concentrate around peak cooling and heating demand periods, and a complete before-and-after comparison needs to span at least one of each to be fully representative.
Does this cost model apply differently to owner-occupied buildings versus multi-tenant commercial properties?
The direct repair, rush parts, and contractor premium layers apply consistently regardless of occupancy structure, but the tenant loss and reputation damage layers manifest differently — an owner-occupied building experiences comfort failures as an internal operational disruption rather than a tenant relations event, while a multi-tenant property faces the lease concession and retention risks described throughout this cost model directly. Contact iFactory Support for guidance on adapting the cost model to your specific building occupancy structure, lease terms, and tenant mix.
What equipment types typically drive the highest emergency downtime cost in commercial buildings?
Rooftop units and chillers typically drive the highest per-incident emergency cost given their scale and the specialized parts and labor required to repair them, while smaller, more numerous components like fan motors and control boards drive cost through sheer frequency of failure even though each individual incident carries a lower price tag. Building a complete picture requires tracking both total cost and incident frequency by equipment type, since the highest-cost equipment category and the highest-frequency equipment category are often not the same across a given portfolio.