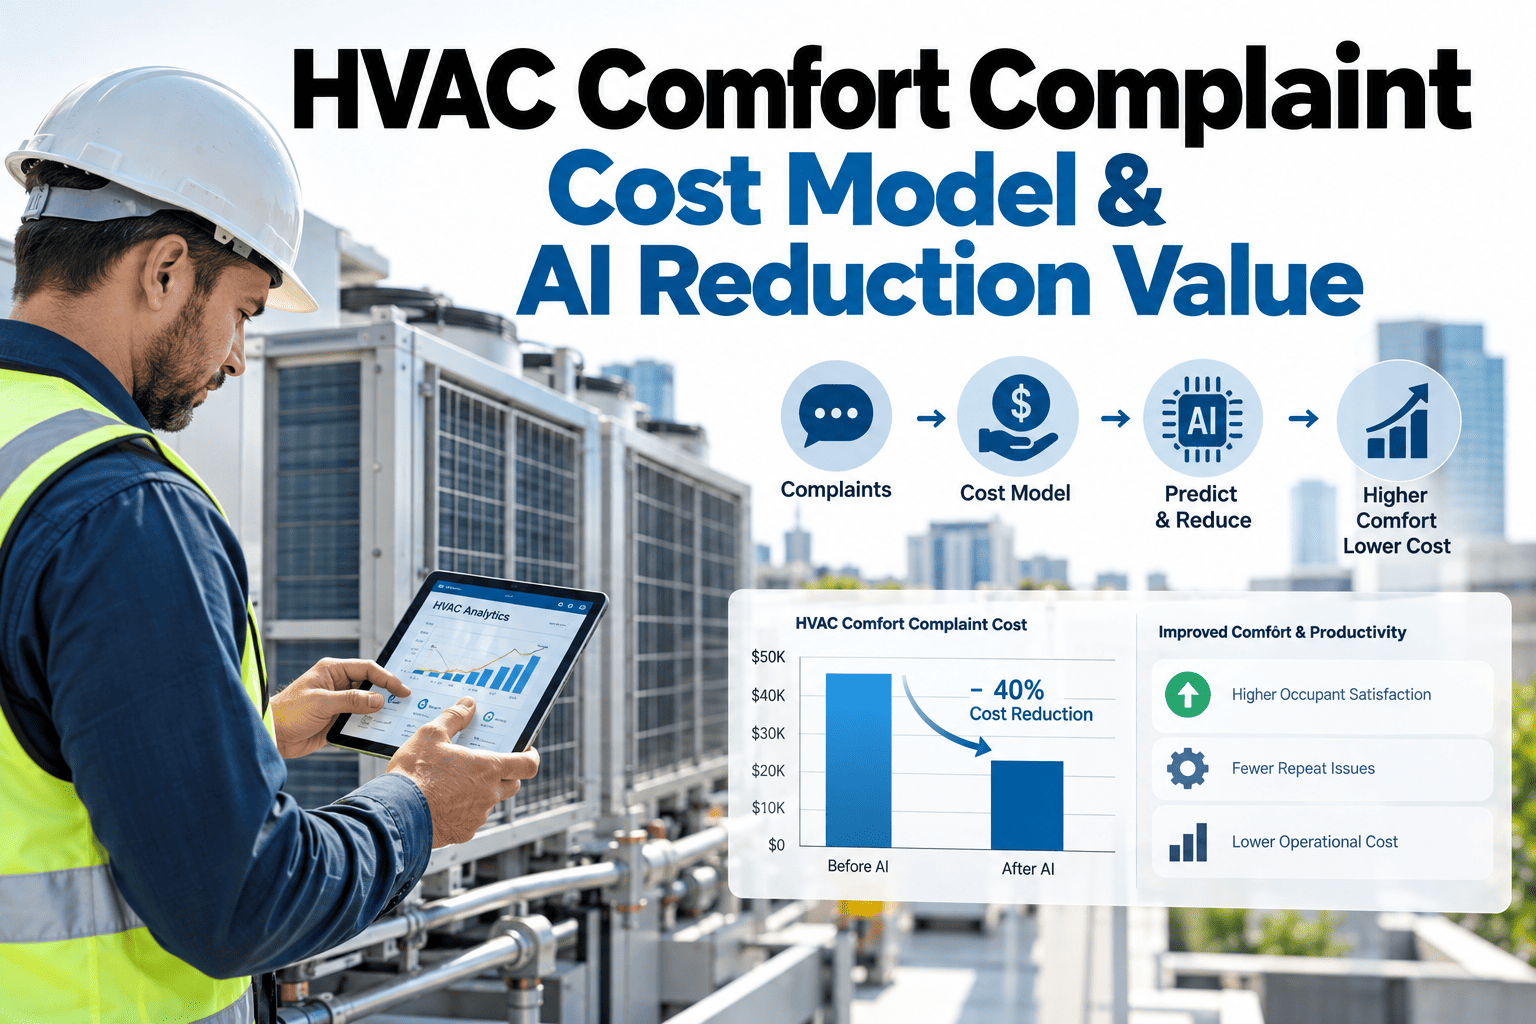
A single tenant comfort complaint about a specific room running too hot or too cold seems like a minor operational nuisance, easily resolved with a quick phone call to the property manager and a technician dispatch to check the thermostat. But multiply that one single complaint across a portfolio of buildings over a full year, and the true cost — call handling labor, on-site response dispatch, tenant retention risk, and reputational drag — adds up to a number that most owners have never actually calculated. Owners ready to see that number can Book a Demo to see how iFactory models comfort complaint cost and the value AI-driven reduction delivers.
Why Comfort Complaints Are Treated as Noise Instead of a KPI
Most commercial building operations treat comfort complaints as background noise — an inevitable, low-priority operational annoyance that gets logged, addressed, and forgotten rather than tracked as a meaningful performance indicator in its own right. This treatment makes a certain intuitive sense in practice, since any single complaint rarely represents a major cost event entirely on its own. But that same logic is exactly why the aggregate cost of comfort complaints across an entire portfolio and a full year almost never gets calculated, leaving building owners with no real sense of how much labor time, tenant goodwill, and operational bandwidth this seemingly minor category of issue actually consumes when properly totaled.
The Four Layers of Comfort Complaint Cost
Breaking comfort complaint cost into its component layers reveals a total that is consistently higher than what most property teams would estimate from memory alone, largely because each individual layer feels small in isolation and the layers are almost never added together into a single figure. Call handling, on-site response, tenant retention impact, and reputational value each carry their own cost driver, and understanding each layer separately is what makes it possible to see where AI-driven reduction delivers the most concentrated value.
Call Handling
Property management or front desk staff time spent receiving the complaint, logging it, and routing it to maintenance, a small but recurring labor cost that accumulates across dozens of monthly incidents.
On-Site Response
Technician travel time, diagnostic time, and any adjustment or repair performed on site, typically the largest single cost component of a comfort complaint response.
Retention Impact
The cumulative effect of repeated complaints on tenant satisfaction and lease renewal likelihood, a cost that only becomes visible when complaint frequency is tracked over time by tenant.
Reputational Value
The broader effect of a building's comfort reliability reputation on future leasing negotiations, harder to quantify precisely but consistently reported as a genuine leasing factor.
Call Handling and On-Site Response: The Visible, Countable Cost
Call handling and on-site response are the two layers of comfort complaint cost that are easiest to measure directly, since both involve staff time that can be tracked with reasonable precision once an organization decides to actually track it. Front desk or property management staff receiving and logging a complaint typically spend a modest but genuinely non-trivial amount of time per incident, and that time compounds meaningfully once multiplied across dozens of separate monthly complaints spread across a portfolio. On-site response carries a considerably higher cost per incident, since it involves a technician's travel time to the affected space, diagnostic time to identify the actual cause of the discomfort, and often a physical adjustment or minor repair before the complaint can be closed out.
| Response Stage | Typical Time Investment | Primary Cost Driver |
|---|---|---|
| Complaint intake and logging | 5–10 minutes per incident | Front desk or property management labor |
| Technician dispatch and travel | 15–30 minutes per incident | Maintenance staff time and travel between zones |
| On-site diagnosis and adjustment | 10–20 minutes per incident | Technician labor and any minor parts used |
| Follow-up confirmation with tenant | 5–10 minutes per incident | Property management labor to close the loop |
Retention Impact: The Layer That Compounds With Frequency
A single comfort complaint, resolved promptly and courteously, rarely damages a tenant relationship in any lasting way — tenants generally accept that HVAC systems occasionally need adjustment, and a quick, professional response actually reinforces confidence in property management rather than eroding it. The retention risk emerges specifically from frequency and pattern rather than from any isolated incident, since a tenant who files their fifth comfort complaint within a single quarter has a fundamentally different relationship with the building than a tenant filing their first, regardless of how quickly each individual complaint gets resolved by the property management team.
This is precisely why tracking comfort complaints by individual tenant and unit, rather than only as an aggregate portfolio number, matters so much for understanding true retention risk. A portfolio-wide complaint count that looks entirely manageable in aggregate can mask a small number of specific tenants experiencing a genuinely poor comfort experience repeatedly, and those specific tenants are the ones at meaningfully elevated risk of non-renewal regardless of how well the portfolio performs on average across every other lease in the building. Identifying and prioritizing intervention for these high-frequency tenants delivers disproportionate retention value compared to spreading the same effort evenly across every complaint regardless of its pattern.
Reputational Value: Comfort as a Leasing Differentiator
Building reputation for comfort reliability increasingly factors into commercial leasing decisions as tenants, particularly larger corporate tenants with sophisticated real estate teams, incorporate operational track record into their site selection and renewal evaluation process rather than evaluating a building purely on rent, location, and amenities. A building known among brokers and tenant representatives for a pattern of comfort issues carries a quiet but real disadvantage in competitive leasing situations, even when the specific prospective tenant has not personally experienced any comfort problem in that building themselves, simply because reputational signals travel faster and further than any individual tenant's direct experience.
How AI-Driven Optimization Reduces Complaint Frequency
AI-driven HVAC optimization reduces comfort complaints primarily by catching and correcting the small deviations that eventually become tenant-noticeable discomfort, well before a person in the space actually feels uncomfortable enough to file a complaint. Traditional HVAC control operates on relatively simple setpoint logic that reacts to temperature deviation after it has already occurred, while AI-driven systems can anticipate load changes based on occupancy patterns, weather forecasts, and historical zone behavior, adjusting proactively in a way that keeps conditions within comfortable range more consistently rather than allowing the swings that generate complaints in the first place and eventually escalate into a formal tenant call.
This proactive correction particularly reduces complaints tied to transition periods — the first hour of occupancy in the morning, shifts between heating and cooling seasons, and rapid outdoor weather changes — which are disproportionately represented in comfort complaint logs precisely because traditional control systems struggle most with these dynamic conditions. AI optimization systems that have learned a building's specific thermal behavior over time can pre-condition zones ahead of these transitions rather than reacting only once occupants are already present and already uncomfortable, addressing the root cause of a meaningful share of total complaint volume.
Calculating the ROI of Complaint Reduction
Translating a reduction in comfort complaint frequency into a genuine financial return requires combining all four cost layers into a single before-and-after comparison, rather than looking only at the labor savings from fewer service calls, which understates the true value considerably. A building that reduces its monthly complaint volume by a meaningful percentage saves directly on call handling and on-site response labor, but the larger financial value typically comes from the retention and reputational layers, since fewer high-frequency complaint patterns directly reduces the population of tenants at elevated non-renewal risk.
Establish a Complaint Baseline
Track monthly complaint volume, response time, and per-tenant frequency across the portfolio before AI deployment to establish an accurate starting point for comparison.
Quantify Labor Cost Per Complaint
Calculate the fully loaded labor cost of call handling and on-site response per incident, using actual staff time and wage data rather than rough estimates.
Track High-Frequency Tenant Patterns
Identify which tenants generate repeated complaints before and after deployment, since retention risk concentrates in this specific population rather than distributing evenly across the portfolio.
Compare Post-Deployment Results
Measure complaint volume, labor cost, and high-frequency tenant patterns after AI deployment against the established baseline to quantify the genuine reduction achieved.
Building a Complaint Logging Process That Actually Captures the Data
A comfort complaint cost model is only as good as the underlying logging discipline that captures each incident, and many property teams discover when they first attempt this kind of analysis that their existing complaint records are far less complete than assumed, with a significant share of complaints handled informally through a quick hallway conversation or a text message to a technician that never makes it into any formal log at all. Building a logging process that genuinely captures the majority of incidents typically requires making the logging step easier and faster than the informal alternative, since front desk staff and technicians will default to whatever path requires the least friction during a busy day, regardless of what the official policy on record-keeping happens to say.
The most successful logging processes capture a small, consistent set of fields for every complaint — the tenant, the unit or zone, the nature of the complaint, the time received, and the time resolved — without requiring extensive narrative documentation that discourages consistent use. Property teams that start with this minimal but consistent structure, rather than attempting to capture exhaustive detail on every incident from day one, build a far more complete and useful dataset over time than teams that design an elaborate logging system nobody actually uses consistently under real operational pressure, since a simple system used reliably beats a comprehensive system used sporadically.
Comfort Complaints as an Early Warning System for Equipment Issues
Beyond their direct cost, comfort complaints carry genuine diagnostic value that many property teams overlook entirely, since a cluster of complaints concentrated in a specific zone or tied to a specific piece of equipment often represents the earliest tenant-facing signal of a mechanical issue that has not yet triggered any formal equipment alarm or maintenance alert. A rooftop unit developing a refrigerant leak, a damper actuator beginning to stick, or a sensor drifting out of calibration frequently manifests first as a pattern of tenant discomfort complaints in the affected zone, well before the underlying mechanical problem becomes severe enough to register on standard equipment monitoring or trigger any automated alert on its own.
Treating comfort complaint data as an input to maintenance prioritization, rather than purely as a tenant relations issue to be resolved and closed, lets property and maintenance teams catch developing equipment problems earlier than they otherwise would, using tenant feedback as a genuinely useful early warning signal rather than dismissing it as unrelated operational noise. Building this connection between complaint tracking and maintenance workflow requires deliberate effort to route complaint patterns to maintenance planning, but plants and portfolios that make this connection consistently report catching equipment issues earlier than portfolios where complaint data and maintenance data remain in entirely separate systems with no cross-referencing between the two, forcing each department to rediscover the same underlying problem independently through its own separate channel and its own separate escalation path.
Frequently Asked Questions: HVAC Comfort Complaint Cost
How much can AI-driven HVAC optimization typically reduce comfort complaint volume?
Reduction in complaint volume varies by building and by how significant the prior control gaps were, but many buildings see a meaningful decline within the first few months of deployment as proactive correction reduces the transition-period discomfort that drives a disproportionate share of total complaints. The full extent of reduction typically becomes clearer over a full seasonal cycle, since complaint patterns tied to heating-cooling transitions only occur a few times per year and each transition period offers only one real opportunity to observe the AI system's actual performance under those specific conditions. Owners can Book a Demo to see typical reduction ranges based on a building's specific complaint history and equipment profile, using their own historical data rather than a generic industry-wide estimate.
Is tracking comfort complaints by individual tenant worth the additional administrative effort?
Yes — aggregate portfolio-level complaint tracking alone masks the specific high-frequency tenant pattern that actually drives retention risk, and identifying which tenants are experiencing repeated issues lets property management prioritize intervention where it matters most rather than spreading limited attention evenly across every complaint regardless of its underlying pattern. The additional administrative effort to tag complaints by tenant is minimal once a structured logging process is in place, and the resulting visibility into retention risk consistently proves worth that modest effort.
How does an owner estimate the reputational cost of comfort complaints with any real confidence?
Reputational cost is best approached through concrete, trackable proxies rather than an attempt at direct quantification alone — leasing broker feedback specifically mentioning comfort or operational reliability, lease renewal rates correlated against a tenant's documented complaint history, and vacancy duration compared against portfolio buildings with stronger comfort track records all provide grounded, defensible evidence rather than a purely speculative estimate of reputational impact.
Does comfort complaint reduction from AI optimization apply evenly across all zones in a building?
No — zones with historically difficult thermal behavior, such as perimeter zones with significant solar exposure or spaces near building entrances subject to frequent door openings, typically see the largest complaint reduction from AI optimization since these zones benefit most from the proactive, anticipatory control that traditional setpoint-based systems struggle to provide. Contact iFactory Support for guidance on identifying which zones in a specific building are likely to see the greatest comfort improvement from AI-driven optimization.
Should comfort complaint cost tracking continue after an AI system is deployed, or is the baseline comparison sufficient?
Ongoing tracking after deployment remains valuable well beyond the initial before-and-after comparison, since it provides an early warning signal if complaint volume begins climbing again due to sensor drift, control logic changes, or building occupancy shifts that alter the thermal conditions the AI system was originally optimized against, letting property teams catch and address performance degradation early before it fully re-emerges as a visible, tenant-facing problem all over again.
Setting a Realistic Target for Complaint Reduction
Owners evaluating an AI optimization investment against comfort complaint reduction sometimes set an unrealistic expectation of eliminating complaints entirely, which sets up the initiative for a perceived failure even when it delivers genuine, meaningful improvement. A more useful framing sets a specific percentage reduction target based on the building's documented baseline and the specific zones or transition periods known to drive the highest historical complaint volume, since a building with a well-understood baseline can set a target grounded in its own actual data rather than an arbitrary industry benchmark that may not reflect its particular thermal challenges.
Tracking progress against this target on a rolling basis, rather than waiting for a full year to pass before evaluating results, lets property teams catch early signals that the optimization is or is not performing as expected and make adjustments to control logic or sensor calibration well before an entire season's worth of potential complaint reduction has been missed. This rolling evaluation approach also gives owners concrete, incremental evidence to point to when justifying the investment to stakeholders who want to see progress demonstrated before the full annual comparison is available, rather than being asked to wait an entire year on faith before any results can be shown.