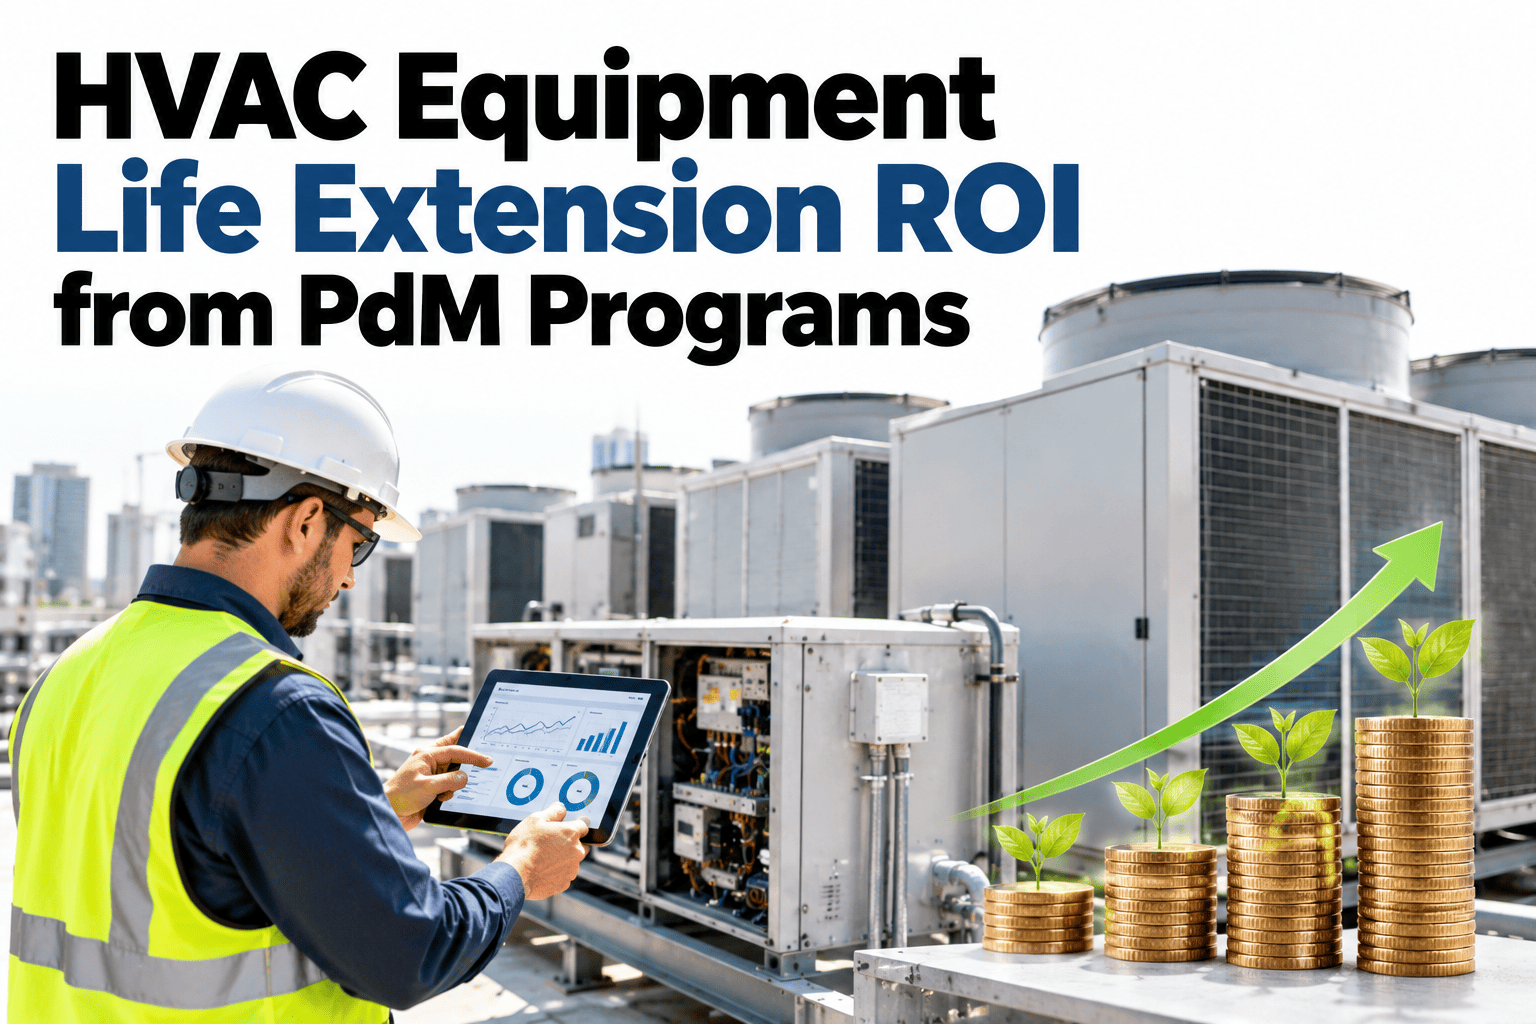
Replacing a chiller, boiler or air handler is one of the largest capital decisions a facility owner makes, so every extra year an asset runs safely has real value. Predictive maintenance extends equipment life by catching degradation early and fixing the cause before it becomes damage. The return comes from deferred replacement, lower repair cost and steadier depreciation. To test the numbers on your own assets, you can model a deferral case with our team.
HVAC ROI and savings modeling
Put a Dollar Value on Every Extra Year Your HVAC Assets Keep Running
iFactory AI uses condition data to estimate remaining life, defer replacement spend and show owners what predictive maintenance is worth.
Illustrative replacement timing for one chiller
Year 15
Replace without PdM
What is at stakeReplacement Is Expensive in More Ways Than the Invoice
The purchase price is only part of it. Replacing major plant touches budgets, tenants and schedules.
Capital
Large one-time spend
Downtime
Outage risk during swap
Disruption
Tenant and site impact
Deferral
Value of waiting safely
Deferring replacement is only smart when the asset is truly healthy. That is why condition evidence matters more than age alone.
Condition-based lifeHow Remaining Life Is Estimated From Real Condition
Age tables are a start. Condition data tells you how the asset is actually aging.
Collect data
Vibration, temperature, pressure, power and run history.
Build a health score
Compare readings with normal behaviour and past failures.
Estimate remaining life
Project how long the asset can run at acceptable risk.
Decide
Defer, repair, overhaul or replace with evidence.
Remaining life is a range, not a promise. Good models show uncertainty and update as new data arrives.
Build a Replacement Deferral Case for Your Portfolio
Bring your asset list and replacement budgets and see what condition-based life could be worth to you.
A worked exampleDeferring a 900,000 Replacement by Three Years
This simple example uses round numbers and a simplified cost-of-capital view. Your finance team can refine it.
72,000
Net value after program cost
Deferral value = 900,000 x 6% x 3 = 162,000. Program cost = 30,000 x 3 = 90,000. Net = 72,000.
This ignores energy savings and avoided repairs, which usually add to the case.
SensitivityHow the Value Changes With Each Extra Year
Longer deferral raises value, but only if the asset stays reliable.
| Years deferred | Deferral value | Program cost | Net value |
|---|
| 1 | 54,000 | 30,000 | 24,000 |
| 2 | 108,000 | 60,000 | 48,000 |
| 3 | 162,000 | 90,000 | 72,000 |
| 4 | 216,000 | 120,000 | 96,000 |
Use your own cost, rate and program figures to replace these examples. To build a version with your numbers, ask our team for the input list.
Depreciation impactWhat Changes on the Books When Life Is Extended
Run to failure or fixed age
Replacement dates follow age tables
Surprise failures disrupt budgets
Reserves are set by guesswork
Capital plans change suddenly
Condition-based life
Dates follow measured condition
Planned work replaces emergencies
Reserves reflect real risk
Capital plans stay steadier
Accounting treatment of useful life depends on your policies and standards. Confirm any change with your finance team.
Getting startedThree Phases to a Credible Life Extension Program
Phase 1
Baseline the age, cost and condition of your top assets.
Phase 2
Instrument the highest-value equipment and set health scores.
Phase 3
Review deferral decisions yearly and update the model.
Asset list with age and replacement cost
Maintenance and failure history
Cost of capital agreed with finance
Critical assets ranked by risk
Program cost estimate
Annual review owner named
What predictive maintenance catchesSix Failure Paths That Shorten Equipment Life
Equipment rarely fails without warning. Most failures grow from small, detectable problems that go unaddressed.
Bearing and vibration wear
Rising vibration shows wear long before a motor or fan seizes.
Refrigerant loss
Slow leaks cut capacity and push compressors to work harder.
Heat exchanger fouling
Dirty coils and tubes raise energy use and stress equipment.
Electrical degradation
Loose connections and unbalanced current heat and damage parts.
Control and valve faults
Hunting valves and drifting sensors wear actuators and waste energy.
Water quality issues
Scale and corrosion shorten the life of pipes, tubes and pumps.
Each path has measurable signs. Catching them early turns a major repair into a small planned job.
Who cares about the resultLife Extension Matters Differently to Each Stakeholder
A good business case speaks to everyone who signs off or lives with the outcome.
Finance lead
I want a clear deferral value and a view of reserve needs.
Facility manager
I want fewer emergencies and a calmer repair budget.
Tenants
We want comfort that does not drop when equipment ages.
Sustainability lead
Keeping efficient equipment longer avoids embodied carbon from replacement.
Present the case in each audience's own terms, using the same underlying numbers.
Program timelineWhat the First Eighteen Months of a Life Extension Program Look Like
Results build gradually. Setting expectations early prevents disappointment and builds trust.
1
Months 1 to 3
Collect asset data, rank by value and risk and agree the baseline.
2
Months 4 to 6
Install monitoring on top assets and set health scores.
3
Months 7 to 12
Act on early warnings and record avoided repairs and failures.
4
Months 13 to 18
Update remaining-life estimates and revise deferral decisions.
5
Ongoing
Review the model yearly and extend to more assets.
The first savings usually come from avoided repairs. The larger deferral value appears as estimates become more confident.
Honest limitsFive Things Life Extension Models Cannot Promise
Good analysis is clear about what it does not know. That honesty builds credibility with finance and boards.
1
Exact failure dates
Models give ranges and probabilities, not guarantees.
2
Savings without action
Early warnings only pay off when someone acts on them.
3
Unlimited deferral
Efficiency, safety and parts availability eventually favour replacement.
4
Equal results for every asset
Some assets age slowly while others have hidden design problems.
5
Savings without a baseline
Without before data, benefits are hard to prove.
Board reportingFour Steps to Report Life Extension Value Credibly
A clear reporting rhythm keeps funding secure and decisions timely.
1
State the baseline
Show age, cost and condition before the program.
2
Show the evidence
Share avoided repairs, early catches and health trends.
3
Update the forecast
Revise remaining life and deferral value.
4
Recommend actions
Propose repair, overhaul, deferral or replacement.
Report once a year, with a short update each quarter. To prepare a board-ready summary, ask our team for a reporting template.
One model, three data sourcesBring Cost, Condition and Capital Data Into One View
Life extension cases fail when finance, maintenance and operations each hold a different version of the truth.
Maintenance recordsCondition monitoringEnergy metering
Asset life model
Capital planBudget forecastBoard report
When the same model feeds every report, discussions shift from arguing about numbers to deciding what to do.
Where the value comes fromDeferred Replacement Is Only One of Four Value Streams
Owners often focus on replacement deferral, but other streams add to the case. This split is an illustrative example.
45 percent: Deferred capital
Value of delaying a large replacement.
25 percent: Avoided repairs
Smaller failures caught and fixed early.
20 percent: Energy savings
Equipment kept clean, tuned and efficient.
10 percent: Avoided downtime
Fewer unplanned outages and tenant impact.
Report each stream separately. Mixing them hides which part of the program is working.
Growing confidenceRemaining-Life Estimates Get Better With Time
Early estimates carry wide uncertainty. As data builds up, the range narrows and decisions become easier.
Wide
Month 3: baseline only
Narrowing
Month 9: trends visible
Clearer
Month 18: failures matched
Strong
Year 3: model refined
Treat early estimates as a starting point and be open about the range. Credibility grows when forecasts improve visibly.
Where to focus firstRank Assets by Value and Risk to Pick the Pilot
A pilot on the right assets proves the case quickly. This grid helps you choose.
Asset profile
High condition risk
Low condition risk
High replacement value
Start here
Highest payoff from early warning
Monitor lightly
Healthy but costly assets need light checks
Lower replacement value
Fix simply
Low-cost assets may be best repaired as needed
Skip for now
Little value in detailed monitoring
A pilot of three to five high-value assets is usually enough to show whether the approach works.
Three scenariosModel a Low, Base and High Case Before Committing
Presenting a range builds trust with finance and avoids overpromising.
Low case
One year of deferral on key assets with modest savings.
Base case
Three years of deferral supported by condition data.
High case
Five years of deferral on well-maintained, low-risk assets.
Test each case against your cost of capital and risk tolerance. To build all three, ask our team for a scenario template.
Expert reviewWhat an Asset Manager Would Check First
Expert review
Life extension value is real, but it is easy to overstate. Credible cases show ranges, include program cost and are reviewed every year.
VerdictStrong for high-value plant with good condition data and active upkeep.
Watch forDeferral claims that ignore failure risk, tenant impact or safety.
Do nextPick three high-value assets and model a low, base and high case.
Frequently asked questionsWhat Owners Ask About HVAC Life Extension ROI
Can predictive maintenance really add years of life?
It can when it catches wear early and the underlying causes are fixed. Results vary by asset type and starting condition.
Review a life extension case.
What assets give the best return?
High-value, critical equipment such as chillers, large air handlers and boilers usually show the strongest case. Smaller units may not justify monitoring.
Ask which assets to start with.
How do we avoid overstating savings?
Use ranges, include program cost and compare with a documented baseline. Review assumptions every year.
See a conservative model.
Does extending life hurt efficiency?
Older equipment can lose efficiency, so energy cost belongs in the decision. Condition data helps you compare repair, overhaul and replacement.
Ask about efficiency tracking.
What data do we need to begin?
Asset age, cost, maintenance history and basic run data are enough for a first model. Sensors improve accuracy later.
Plan your first model.
Evidence for every capital decision
Know When to Replace and When to Wait
Book a session with iFactory AI to review your assets, build a deferral model and see what predictive maintenance could return across your portfolio.