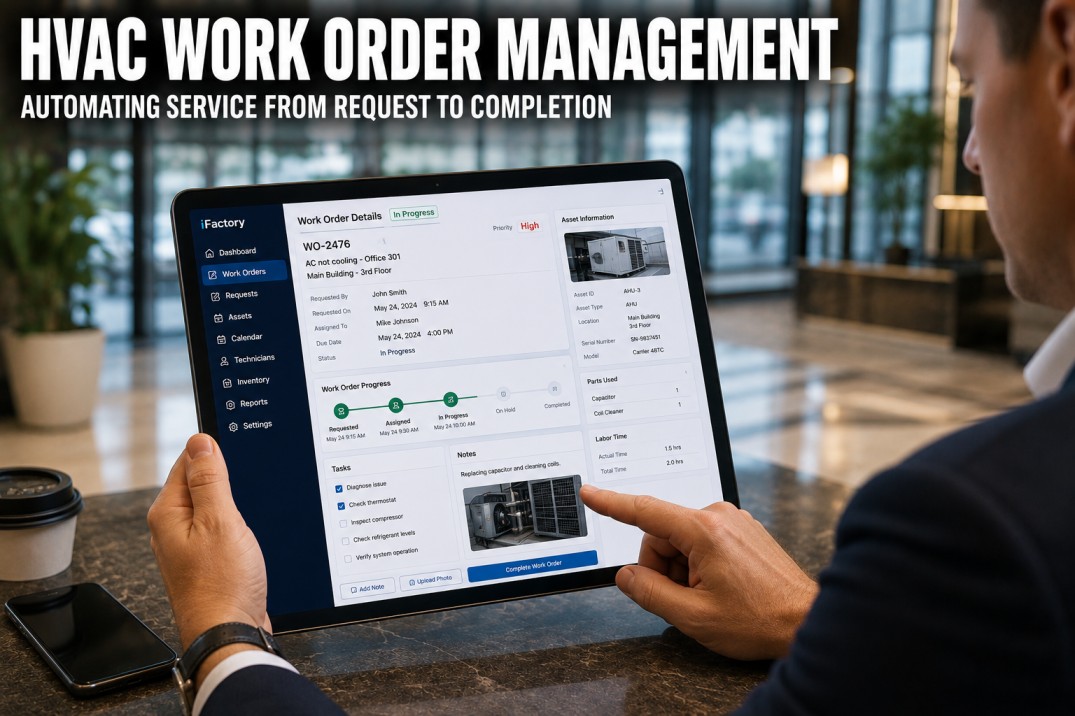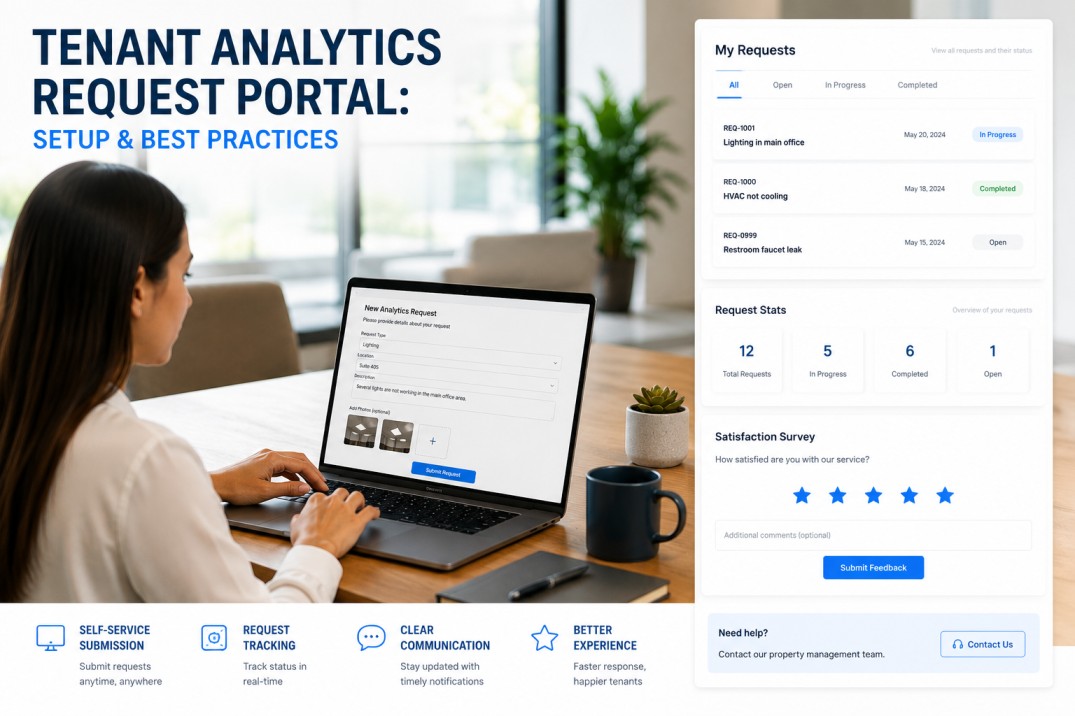
Tenant analytics request portals are transforming how commercial property managers deliver data-driven insights to building occupants, replacing ad-hoc email requests and spreadsheet-based reporting with structured self-service platforms where tenants can request occupancy studies, energy consumption reports, visitor trend analyses, space utilization dashboards, and custom analytics packages through an intuitive interface that captures requirements, sets expectations for delivery timelines, tracks progress, and measures satisfaction at completion — a capability that has become increasingly important as 78% of commercial tenants now expect access to building performance data as part of their lease agreement and 64% of property managers report spending more than five hours per week responding to individual tenant analytics requests through informal channels. A well-designed tenant analytics request portal addresses five core requirements: self-service request submission with guided interfaces that help tenants specify the exact analytics they need including time periods, data granularity, delivery format preferences, and any specific questions or hypotheses they want the data to address, automated request tracking and status visibility that lets tenants see where their request stands in the review, processing, and delivery pipeline without needing to contact property management for updates, structured communication workflows that include automated confirmation of receipt, status change notifications, estimated completion timelines, and direct messaging with the analytics team for clarification questions, standardized analytics delivery formats with branded reports, interactive dashboards, raw data exports, or API feeds depending on tenant technical capability and use case requirements, and post-delivery satisfaction surveys that capture feedback on data quality, timeliness, relevance, and overall experience to drive continuous improvement in the analytics service offering. This article explores five analytics request categories commonly submitted by commercial tenants, maps the complete request lifecycle from submission through delivery and feedback, provides a priority and service level agreement reference matrix for different request types, profiles four analytics delivery formats with their use cases and technical requirements, and presents benchmark metrics for portal adoption, tenant satisfaction, and operational efficiency.
Build a Tenant Analytics Request Portal for Your Property
iFactory's platform includes self-service analytics request submission, automated tracking and status visibility, structured communication workflows, standardized report delivery, and satisfaction survey automation. Book a demo to see how a tenant analytics portal improves data transparency and reduces property management workload.
Analytics Request Categories — Five Common Tenant Data Needs
Tenants submit analytics requests across a range of building performance and occupancy data categories, each with specific parameters including time period, data granularity, comparison benchmarks, and delivery format preferences. The request category cards below profile five common analytics request types with their typical parameters, use cases, and estimated processing complexity.
Analytics Request Lifecycle — Submission Through Delivery & Feedback
Each analytics request follows a structured six-stage lifecycle from initial submission through final delivery and satisfaction measurement, with automated status updates and communication touchpoints at each transition to keep tenants informed without requiring manual follow-up from property management staff.
Streamline Analytics Requests From Submission to Satisfaction
iFactory's tenant analytics portal provides guided request submission, automated lifecycle tracking, structured review and processing workflows, multi-format delivery, and integrated satisfaction surveys. Book a demo to see how a structured analytics request portal reduces property management overhead and improves tenant data transparency.
Priority & Service Level Agreement Reference — Request Tiers
Analytics requests are categorized into priority tiers based on complexity, data availability, and required processing effort, with clearly defined service level agreements for initial response, processing time, and delivery timelines communicated to tenants at the time of submission to set accurate expectations.
| Request Tier | Description | Response SLA | Processing SLA | Review Cycle |
|---|---|---|---|---|
| Tier 1 — Standard | Pre-built reports with configurable date range and filters. Occupancy summaries, visitor counts, basic energy trends. | 4 business hours | 2 business days | Self-serve — immediate |
| Tier 2 — Custom | Tailored reports with specific parameters, multi-source data correlation, or custom date ranges beyond standard options. | 8 business hours | 5 business days | 1 revision included |
| Tier 3 — Complex | Cross-system data integration, predictive modeling, trend analysis with statistical treatment, or benchmarking analysis. | 1 business day | 10 business days | 2 revisions included |
| Tier 4 — Strategic | Long-term studies, custom dashboard development, predictive algorithm creation, or recurring analytics subscriptions. | 2 business days | Custom timeline | Agreed in scope |
Analytics Delivery Formats — Options for Every Tenant Technical Level
Tenants have varying technical capabilities and use cases for analytics data, requiring multiple delivery format options that balance depth of insight with ease of consumption. The format cards below profile four primary delivery methods with their recommended use cases, technical requirements, and relative implementation effort for the property management team.
Portal Adoption & Performance Metrics — Benchmark Data
Properties that deploy structured tenant analytics request portals with self-service submission, automated tracking, and satisfaction measurement report measurable improvements in tenant satisfaction, property management efficiency, and analytics request throughput. The benchmark metrics below compare portal-enabled properties against those using ad-hoc email-based analytics request processes.
Frequently Asked Questions About Tenant Analytics Request Portals for Commercial Properties
What is a tenant analytics request portal and why do commercial properties need one?
A tenant analytics request portal is a self-service web or mobile platform where commercial building tenants can submit requests for building performance data, occupancy reports, energy consumption analysis, visitor trend data, space utilization studies, and custom analytics packages without needing to contact property management through email or phone. The portal provides guided request forms that help tenants specify their exact data requirements including the type of analysis needed, the time period and data granularity desired, the preferred delivery format, and any specific questions they want the data to answer. Once submitted, the portal tracks the request through the entire lifecycle from review and processing to delivery and satisfaction survey, providing tenants with real-time visibility into the status of their request without requiring follow-up inquiries. Commercial properties need analytics request portals because modern tenants increasingly expect access to building performance data as part of their lease experience, using occupancy data for space planning, energy data for sustainability reporting compliance, and visitor data for security and operational planning. Properties without structured analytics portals report spending an average of 5 to 8 hours per week responding to individual tenant data requests through fragmented email threads that lack standardization, tracking, or accountability. Implementing a portal reduces this administrative burden by 30 to 50 percent while improving tenant satisfaction through faster response times, consistent delivery quality, and transparent status visibility for every request submitted.
What types of analytics data can tenants request through the portal?
Tenants can request analytics data across five primary categories through a well-designed portal. Occupancy and utilization analytics include floor-by-floor headcount trends, peak occupancy hours and days, desk and workstation utilization rates, badge swipe frequency by time of day, and year-over-year occupancy change analysis, typically sourced from access control system data. Energy and sustainability analytics include electricity and HVAC consumption by zone or floor, energy cost allocation for bill-back verification, temperature and humidity trend data, carbon footprint reports for corporate sustainability reporting, and energy performance benchmarking against similar properties or industry standards. Visitor and access analytics include visitor volume trends by day and time of week, check-in method breakdown across kiosk, mobile QR code, and pre-registered visitor categories, average visit duration, visitor-to-employee ratios, and after-hours or weekend access pattern analysis for security planning. Space and amenity usage analytics include conference room utilization rates with peak booking times, amenity booking frequency for fitness centers, lounges, and rooftops, no-show rates for reserved spaces, and identification of consistently underutilized resources for potential repurposing. Custom and ad-hoc analytics cover specialized requests that combine multiple data sources, require correlation analysis between building systems such as energy consumption versus occupancy levels, involve benchmarking against tenant-provided data sets, or require predictive modeling and bespoke dashboard development for tenant-specific operational needs that do not fit into standard reporting categories.
How should analytics request portals handle priority and service level agreements?
Analytics request portals should implement a tiered priority system with clearly defined service level agreements that are communicated to tenants at the time of submission so expectations are set before processing begins. Tier 1 Standard requests include pre-built reports with configurable date range and filter options such as monthly occupancy summaries, weekly visitor counts, and basic energy trend reports. These requests should receive an initial response within 4 business hours and be delivered within 2 business days, with self-service options allowing immediate report generation without any human intervention for the fastest possible turnaround. Tier 2 Custom requests involve tailored reports with specific parameters, multi-source data correlation, or custom date ranges beyond standard portal options, requiring an 8-hour response SLA and 5-day processing SLA with one revision included in the standard service. Tier 3 Complex requests cover cross-system data integration, predictive modeling, trend analysis with statistical treatment, or benchmarking analysis requiring specialized analytics expertise, with 1-business-day response and 10-business-day processing SLAs and two revisions included. Tier 4 Strategic requests are long-term studies, custom dashboard developments, predictive algorithm creation, or recurring analytics subscriptions that require a scoping consultation to define delivery timeline and cost structure. The portal should display the assigned tier prominently on each request, show the remaining SLA time with visual indicators, and automatically escalate overdue requests to the analytics team supervisor with notification to the tenant acknowledging the delay.
What delivery formats should a tenant analytics portal support?
A tenant analytics request portal should support at least four delivery formats to accommodate the range of technical capabilities and use cases across tenant organizations. Interactive dashboards delivered through the portal provide the most engaging experience, enabling tenants to explore data through filters, drill-downs, and visualization controls with data refreshed on a configurable schedule ranging from hourly to monthly depending on the data source update frequency. PDF reports are the most universally accessible format, delivering branded, professionally formatted documents with charts, summary tables, and narrative interpretation that work for executive presentations, board meetings, and tenants who prefer documented insights they can file and reference later. CSV and structured data exports serve technically proficient tenants who want to perform their own analysis using Excel, Tableau, Power BI, or other analytics tools, and should include a data dictionary with column definitions, aggregation methodology notes, data source descriptions, and any caveats about data collection gaps or anomalies. API feeds support tenant organizations with internal data platforms or custom-built analytics systems, providing programmatic access to data through REST endpoints with JSON payloads, authentication credentials, rate limits, and comprehensive API documentation. The portal should allow tenants to specify their preferred format at the time of request submission, to change format preferences for recurring report subscriptions, and to receive data in multiple formats simultaneously for the same request when tenants need both a presentation-ready PDF and the underlying raw data for their own analysis.
How do property managers measure the success of a tenant analytics request portal?
Property managers should measure tenant analytics portal success across five key performance indicators tracked monthly and reviewed quarterly. Tenant satisfaction score measured through post-delivery surveys using a standardized 1-to-5 rating scale for data quality, timeliness, communication, and overall experience, with a target of 4.2 or higher average score considered excellent. On-time delivery rate calculated as the percentage of requests delivered within the SLA time frame for their assigned tier, with a benchmark target of 90 percent or higher for mature portal operations. Portal adoption rate measured as the percentage of tenants who have submitted at least one request through the portal versus the total tenant population eligible to use the portal, with 80 percent adoption within 12 months of launch representing strong performance. Average processing time tracked by request tier to identify bottlenecks and efficiency improvement opportunities, with month-over-month and quarter-over-quarter trend analysis to validate that process improvements translate to faster delivery. Request volume and category distribution tracking which analytics categories receive the most requests, which tenant types or industries submit the most requests, and whether request volume is growing over time as tenants become more data-aware and identify new use cases for building analytics. Properties should also track the administrative time savings by comparing the hours spent on analytics requests before and after portal implementation, using the time saved to either redirect property management resources to higher-value activities or to invest in expanding the analytics service offering based on popular request categories and identified data gaps.
Deploy a Tenant Analytics Request Portal for Your Commercial Property
iFactory's platform provides guided request submission, automated lifecycle tracking with SLA management, multi-format analytics delivery (dashboards, PDF reports, data exports, API feeds), structured communication workflows, and post-delivery satisfaction surveys. Book a demo to see how a tenant analytics portal improves data transparency, reduces property management workload, and drives tenant satisfaction.