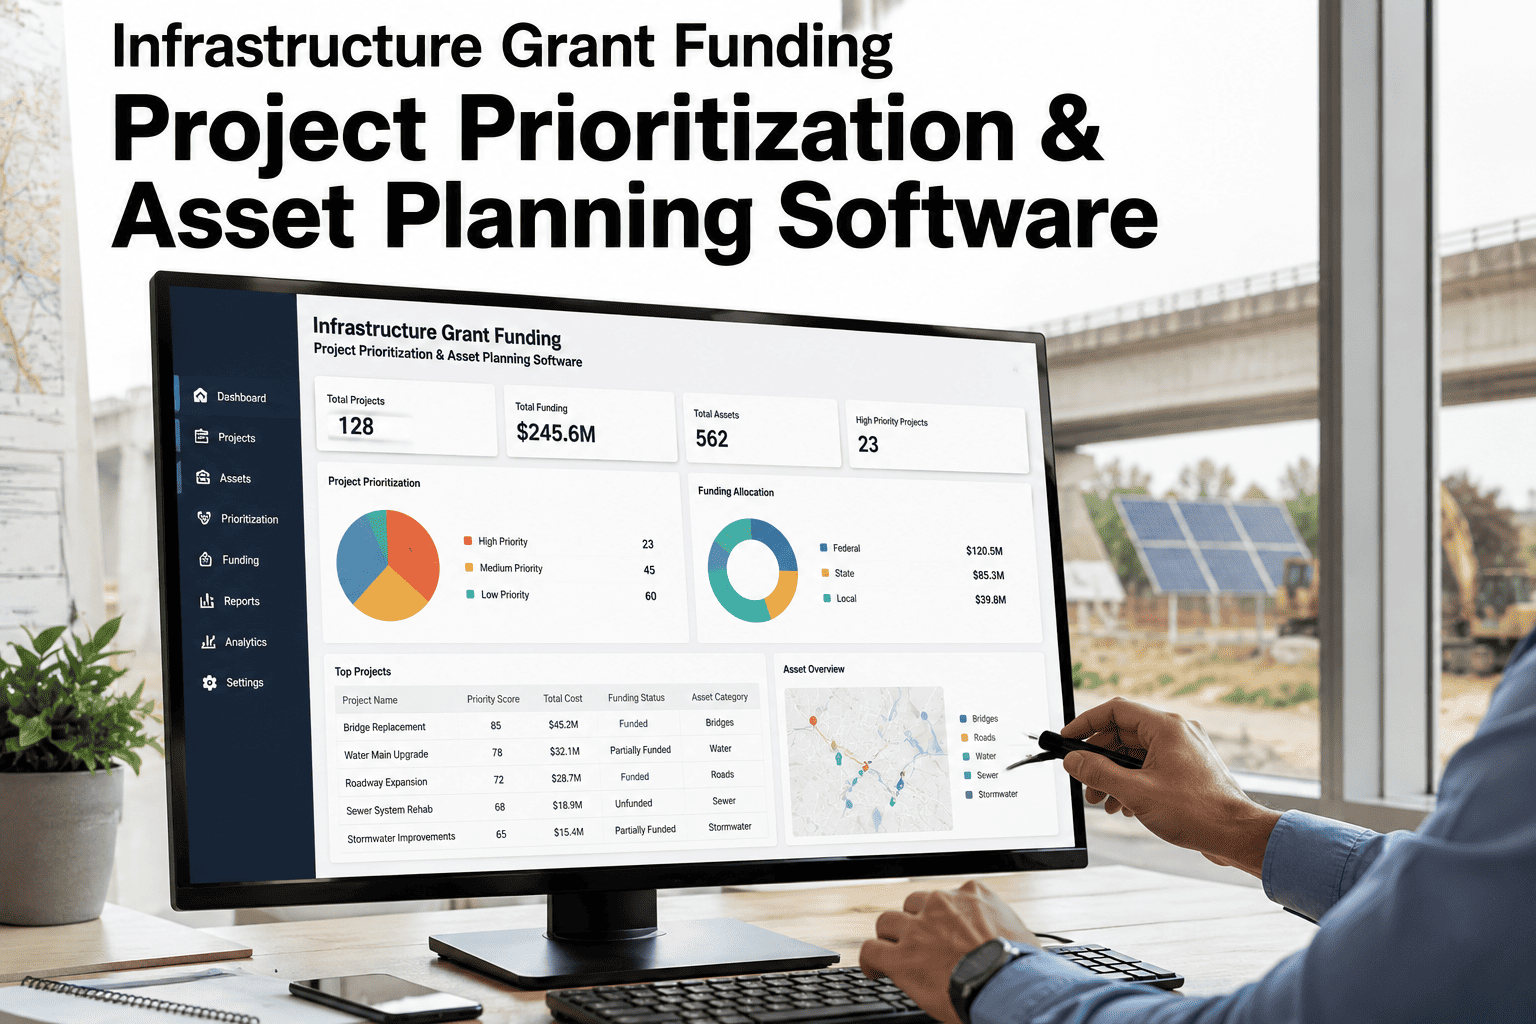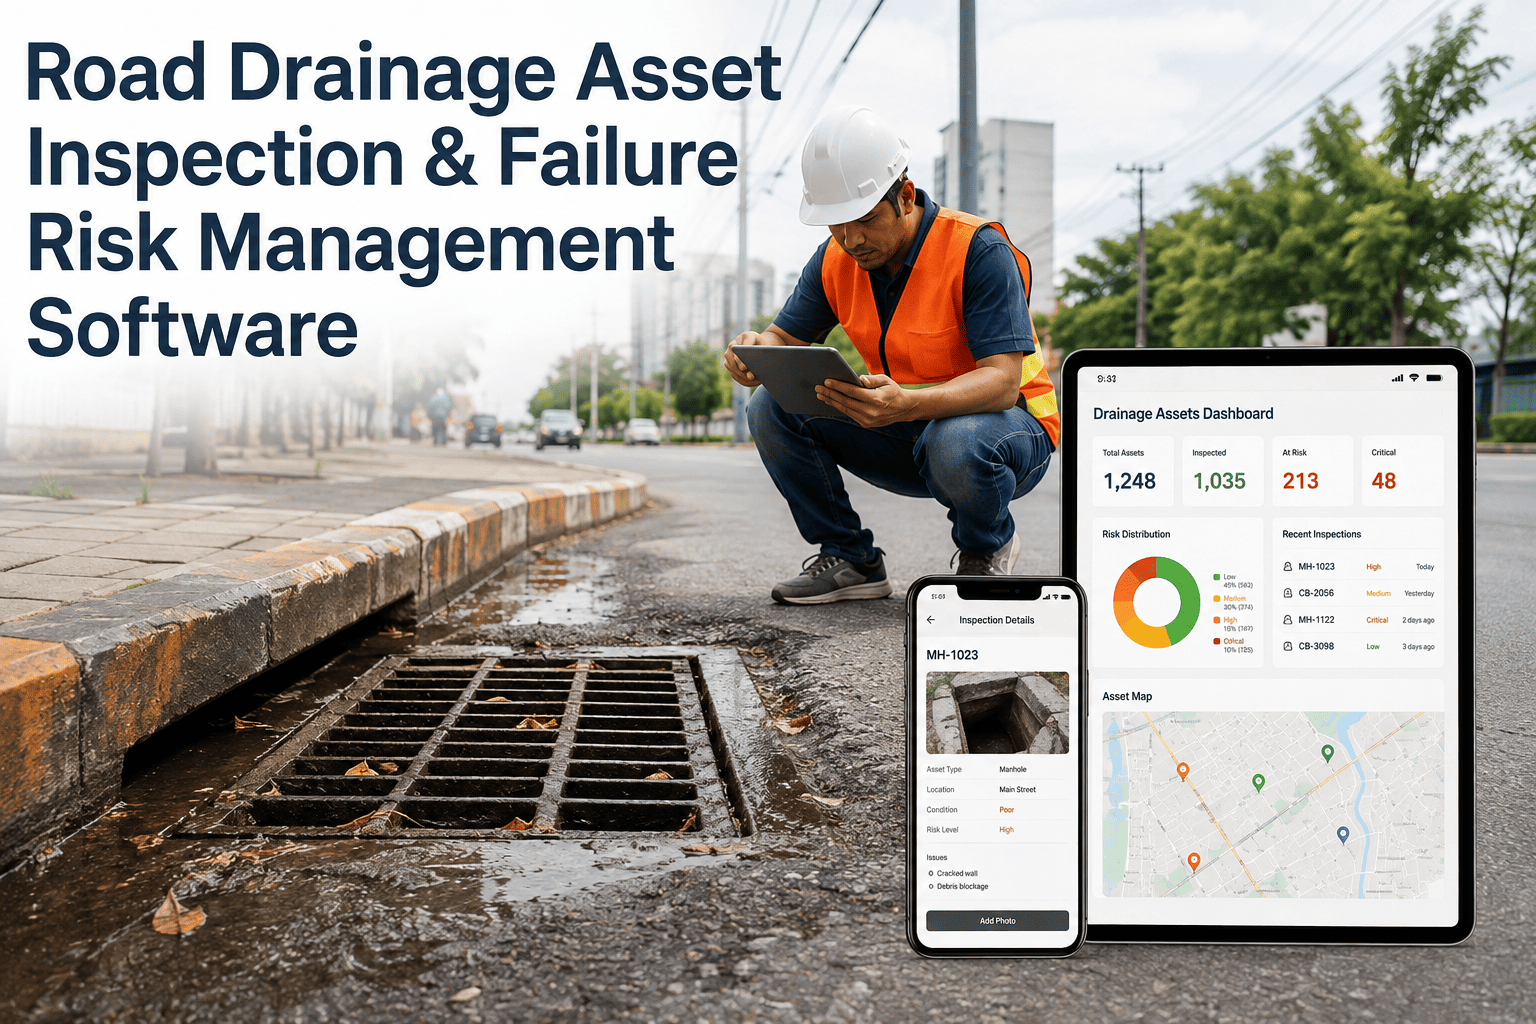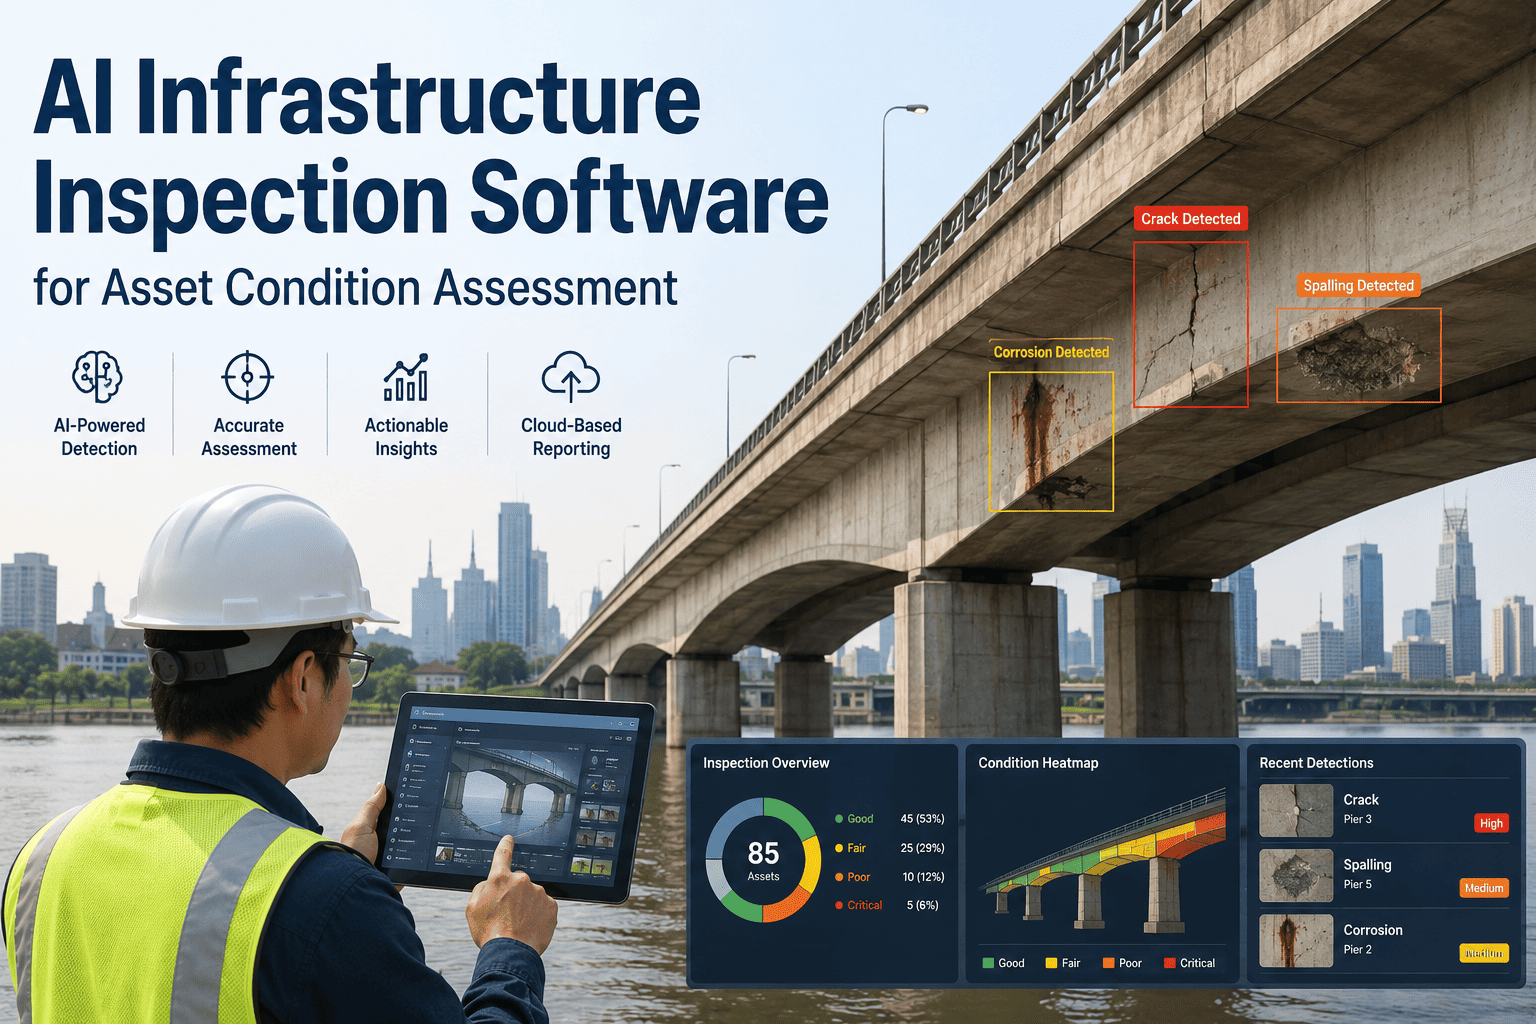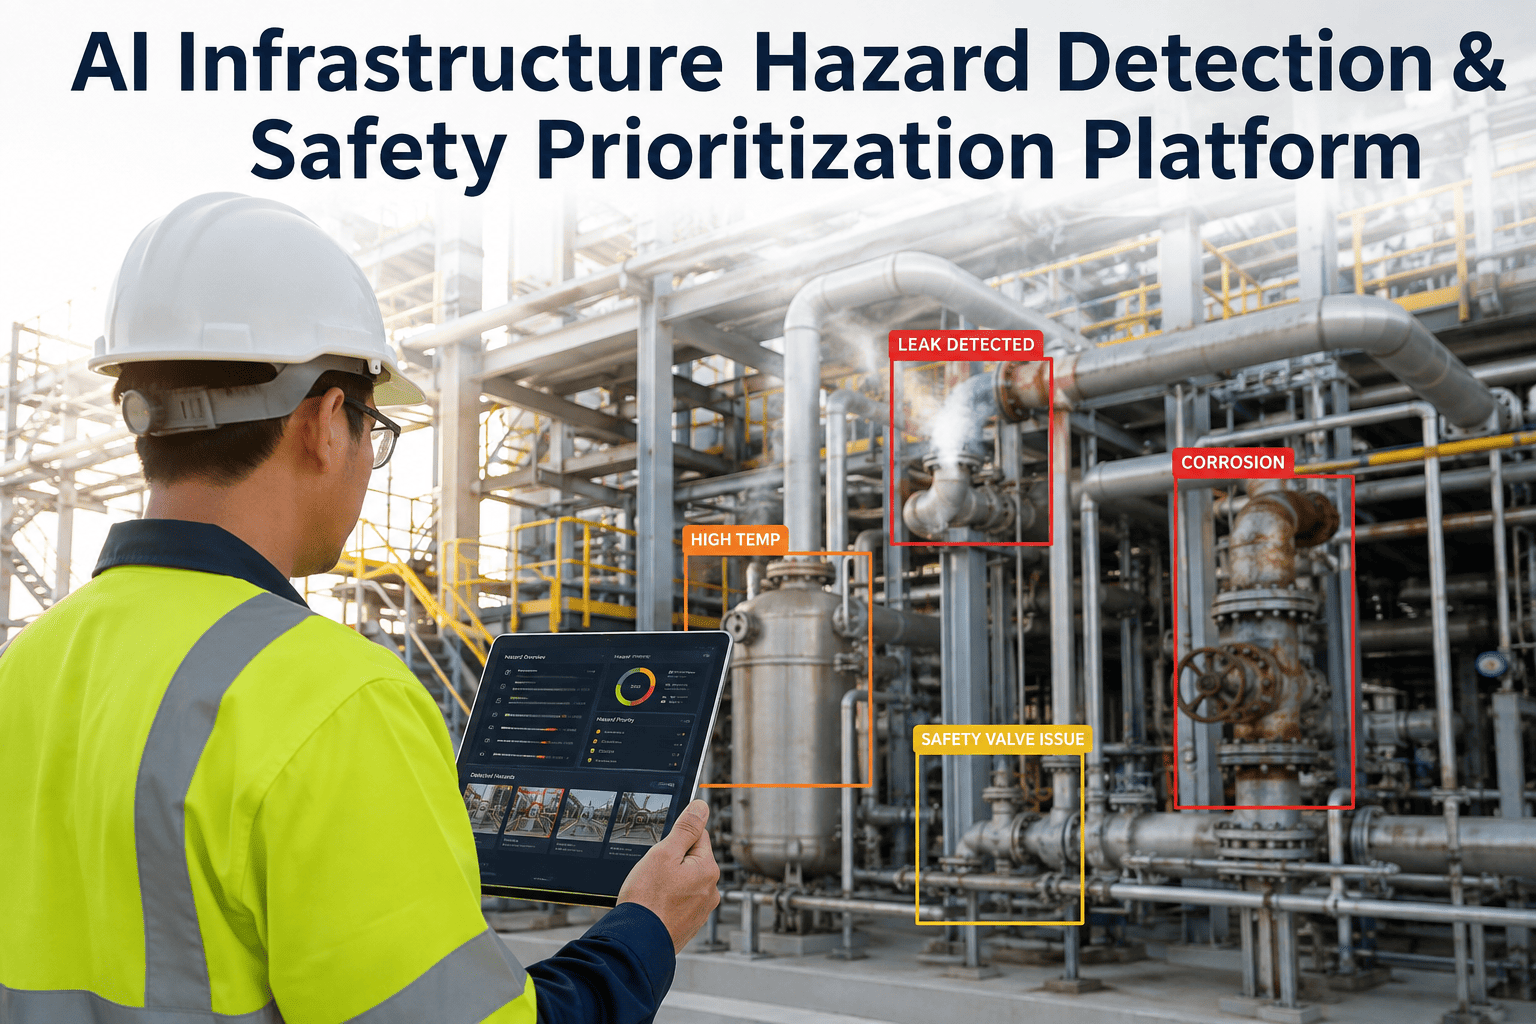
Every infrastructure agency inspects roads, bridges, utility corridors, and public facilities on a schedule — but a spreadsheet full of inspection notes does not tell a crew which crack, corrosion spot, or exposed conduit needs a truck dispatched today versus next quarter. Hazards get logged in the order they were found, not the order they threaten public safety, and by the time a severe finding surfaces in a backlog review, the window to act cheaply has already closed. iFactory AI reads raw inspection data — photos, sensor readings, field notes, and historical records — and scores every hazard against severity, exposure, consequence, and response urgency, then ranks the full list so crews always work the highest-risk item first. See how the scoring model works and book a demo with your own asset data.
Stop guessing which infrastructure hazard is the most dangerous one on your list.
iFactory AI turns inspection photos, sensor feeds, and maintenance history into a single ranked hazard queue — scored by severity, exposure, consequence, and response urgency — so field crews always act on what actually threatens people first.
Aging infrastructure is producing hazards faster than agencies can review them
Public works departments are managing more lane-miles, more bridge decks, and more utility corridor than ever with flat or shrinking inspection staff. Municipal benchmarking shows that reactive repairs typically run three to five times more expensive than work planned ahead of failure, yet most hazard logs are still triaged manually, in the order findings were entered rather than the order they threaten safety. A hairline crack on a low-traffic sidewalk and an exposed rebar strand on a school-route overpass can sit next to each other on the same spreadsheet with no signal distinguishing them until someone gets hurt.
The pattern shows up in every asset class an agency manages. A water utility running quarterly leak surveys, a roads division logging pavement condition scores, and a facilities team tracking building inspection reports are all producing the same kind of raw signal — a defect, a location, and a rough severity note — without a consistent way to compare urgency across those three very different domains. When staffing is limited, the result is that the loudest complaint or the most recently filed report tends to get attention first, regardless of whether it represents the highest actual risk sitting in the backlog.
Four factors decide where a hazard lands on the priority queue
A single severity rating is not enough to prioritize infrastructure work — a severe defect on an unused access road and a moderate defect on a pedestrian bridge over an active rail line do not carry the same real-world risk. iFactory AI's scoring engine weighs four independent factors for every hazard record, then combines them into one priority number crews can act on without needing to interpret four separate charts.
Severity
How structurally or functionally serious the defect is on its own — crack depth, corrosion progression, load capacity loss, or sensor deviation from safe operating range, drawn directly from inspection imagery and historical defect classifications.
Exposure
How many people, vehicles, or downstream assets pass through or depend on that location — daily traffic counts, pedestrian volume, school zones, and connected utility loads all raise the exposure weight for the same physical defect.
Consequence
What happens if the hazard is not addressed in time — service outage, structural collapse risk, environmental release, or cascading failure into connected infrastructure, weighted against the cost and complexity of the eventual repair.
Response urgency
How quickly the defect is progressing based on comparison against prior inspection cycles — a crack widening month over month is scored differently than a stable finding of the same current severity, even before failure is imminent.
Every scored hazard lands in one of four response tiers
Combining the four scoring factors produces a single priority tier for every open hazard, so a crew supervisor can see at a glance which findings need a truck dispatched today and which can be folded into next quarter's planned maintenance cycle without anyone manually re-reading the inspection notes.
See your own inspection backlog scored and ranked
Bring a sample of your current hazard log or inspection reports to a live session and watch iFactory AI turn it into a ranked priority queue in real time, using the same four-factor model shown above.
Built for the hazard patterns specific to each infrastructure type
A pothole and a corroded gas main are both hazards, but they require entirely different detection signals, severity scales, and escalation paths. iFactory AI applies asset-specific hazard models rather than one generic risk score across every asset type, since a defect that is minor on a low-volume road segment can be far more consequential on a structure or a pressurized network carrying an active service load.
Roads & pavement
Pothole depth, crack propagation, shoulder erosion, and drainage failure points scored against traffic volume and route criticality, including school and emergency response corridors.
Bridges & structures
Deck spalling, rebar exposure, expansion joint failure, and load-bearing member corrosion tracked against span-specific load ratings and detour cost if closed.
Utility networks
Pipeline corrosion, valve failure signatures, and pressure anomalies in water, gas, and sewer networks scored against service population and environmental release risk.
Public facilities
Structural, electrical, and fire-safety findings in municipal buildings, schools, and treatment plants scored against occupancy load and egress complexity.
What changes when hazard triage stops being manual
Most agencies already collect inspection data — the gap is turning that raw data into a consistent, defensible priority order fast enough to act on it. The comparison below reflects the operational difference reported by agencies that moved from spreadsheet-based triage to an automated hazard scoring queue.
| Triage dimension | Manual spreadsheet review | iFactory AI hazard prioritization |
|---|---|---|
| Time to flag a critical finding | Days to weeks, dependent on reviewer workload | Minutes after inspection data is ingested |
| Consistency across reviewers | Varies by individual judgment and experience level | Same four-factor model applied to every record |
| Trend detection across cycles | Requires manually pulling prior reports for comparison | Automatic comparison against historical inspection data |
| Work order routing | Manual handoff from reviewer to dispatch | Direct routing into CMMS and work order systems |
| Audit trail for decisions | Informal notes, difficult to reconstruct later | Documented score and rationale attached to every hazard |
From inspection data to a routed work order in five steps
iFactory AI is designed to sit on top of the inspection process agencies already run, not replace it. The platform ingests what field teams already collect and returns a ranked, routable output.
Ingest inspection data
Photos, sensor readings, GIS-tagged field notes, and prior work order history are pulled in from existing inspection tools, CMMS platforms, and mobile field apps.
Detect and classify hazards
Computer vision and anomaly detection models identify defects in imagery and sensor streams, classifying each finding by hazard type and asset class automatically.
Score against four factors
Each hazard is scored for severity, exposure, consequence, and response urgency using asset-specific models and current context such as traffic and occupancy.
Rank the priority queue
All open hazards are combined into a single ranked list, refreshed as new inspection data arrives, so the top of the queue always reflects current conditions.
Route to the right crew
Critical and elevated findings are routed directly into work order and CMMS systems with the supporting evidence attached, ready for dispatch without re-entry.
A composite view of what changes on the ground
Consider a mid-sized public works agency managing 400 lane-miles of road, 60 bridge structures, and a municipal water network, running quarterly visual inspections logged into a shared spreadsheet reviewed by two engineers. A guardrail defect and a spalling bridge deck section were both logged the same week; the guardrail item was actioned first simply because it appeared earlier in the report. Six weeks later, the bridge deck finding had progressed to exposed rebar before it was reviewed. After deploying an automated hazard scoring queue, both findings would have been scored the same day they were logged — the bridge deck finding would have surfaced into the Elevated tier immediately based on its exposure and consequence weighting, while the guardrail item would have been correctly placed in the Plan tier, and crew time would have followed the ranked queue instead of report order. The six-week gap between the first inspection and the eventual escalation is exactly the window a real-time scoring model is built to close, since the underlying data needed to make that call was already sitting in the inspection report from day one.
Where hazard prioritization efforts break down
Agencies that attempt to build a risk-ranking process internally, whether through a scoring spreadsheet or a simple color-coded rating scale, tend to run into the same handful of gaps. None of these mistakes are due to a lack of effort — they are a natural result of trying to maintain a consistent, multi-factor scoring model by hand across hundreds or thousands of open findings.
Scoring severity alone
Ranking hazards only by how bad the defect looks, without factoring in how many people or downstream assets are exposed to it.
No trend comparison
Treating every inspection as a fresh snapshot instead of comparing against prior cycles to catch defects that are actively worsening.
Disconnected work orders
Leaving a gap between the hazard finding and the dispatch system, so ranked priorities still require manual re-entry before crews see them.
One scale for every asset
Applying the same severity scale to roads, bridges, and utilities when each asset class has different failure modes and consequence profiles.
Is your inspection data ready for automated hazard scoring?
Most agencies already have enough of the underlying data to get a working hazard queue running within weeks rather than starting a multi-year data collection project first. The checklist below reflects the minimum conditions iFactory AI's onboarding team looks for before a pilot, and none of them require replacing existing field tools or inspection software.
What agencies ask before deploying hazard prioritization AI
Turn your hazard backlog into a ranked, routable queue
Bring your current inspection data to a live walkthrough and see every open hazard scored by severity, exposure, consequence, and response urgency before the session ends.