AI Vision QC: Mining Pelletizing Plant Execs Handbook
By Grace on June 12, 2026
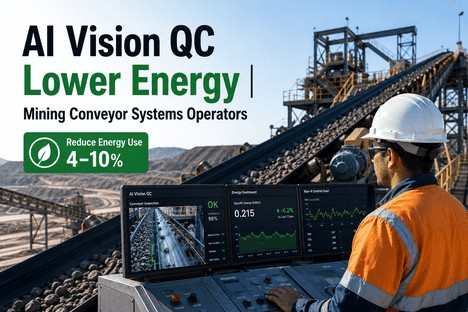
Every pelletizing plant executive already knows that energy is the second-largest cost line after concentrate. What most don't yet know is that the biggest lever for cutting it is not sitting inside the energy management system — it is sitting inside the quality control stack. AI Vision Quality inspection changes what is visible, what is measurable, and what is correctable in real time across the balling circuit and induration furnace. This is the practical guide for plant executives who want to understand what AI Vision QC actually does in a pelletizing operation — and why the plants running it are documenting 4–10% reductions in specific energy consumption that their peers cannot explain.
AI Vision Quality · Mining Pelletizing · Energy Optimization · 2026
AI Vision QC is not a quality upgrade. It is an energy strategy. And the plant executives who understand the difference are pulling ahead.
iFactory's AI Vision Quality platform gives pelletizing plant executives deep-learning inspection, multivariate ML pattern detection, and self-tuning SPC limits — calibrated continuously to every ore blend, pellet grade, and process regime.
Reduction in specific energy consumption documented in pelletizing operations using AI Vision QC with real-time induration zone optimisation
92%
Defect prediction accuracy when deep learning analyses hundreds of process and vision variables simultaneously — forecasting yield issues up to 24 hours ahead
50–70%
Reduction in false alarms when AI-driven adaptive limits replace static charts — restoring operator alert credibility and driving response rates to near 100%
15%
Overall yield improvement documented when AI Vision QC predicts quality failures 24 hours ahead — enabling corrective action before product is lost
What AI Vision Quality Actually Sees That Human Inspection Misses
In a pelletizing operation running at 4–6 Mtpa, the balling circuit produces thousands of tonnes of green pellets every shift. The size distribution, surface morphology, and shape uniformity of those pellets are the primary predictors of induration performance — and therefore of furnace energy consumption. When pellets arrive at the induration furnace with a size distribution skewed toward oversize or with surface cracks that increase the internal moisture gradient, firing temperatures are held high to compensate. The furnace does not know why quality is variable. It only knows it needs more energy to guarantee the crush strength target is met.
AI Vision Quality inspection deploys deep-learning camera systems at the balling circuit discharge, the roller screen feed, and the induration furnace inlet to capture and classify pellet characteristics at line speed — continuously, without sampling intervals, and without the fatigue, inconsistency, and subjective interpretation that manual inspection introduces. A deep learning model trained on tens of thousands of pellet images classifies size distribution, detects surface defects and cracks, identifies shape irregularities, and flags anomalous batches in real time — giving process control the inputs it needs to act before energy-wasteful batches enter the furnace.
What AI Vision QC Detects — vs. What Human Inspection and Static SPC Miss
Surface Crack Detection at Line Speed
Deep learning models trained on high-resolution pellet imagery detect hairline surface cracks that are invisible to manual spot-checking and that do not manifest as statistical outliers in moisture or size measurements. These cracks signal internal moisture gradients that will increase drying energy load and elevate crush strength failure probability in the induration furnace. Catching them at the balling discharge creates the intervention window before energy is wasted.
Real-Time Size Distribution — Not Sampled
Manual screen cut analysis or periodic laser diffraction sampling captures size distribution at intervals of 30 minutes to several hours. AI Vision inspection measures the full size distribution of every pellet continuously across the production stream. When the distribution begins drifting toward the oversize band that triggers recycle, the signal reaches the operator while the disc speed and moisture adjustments can still correct it — not after a tonne of recycle has already accumulated and the energy invested in it is sunk.
Shape Irregularity and Clustering Events
Pellet clustering — groups of two or more pellets fused together at the green ball stage — represents a size and shape anomaly that standard process sensors cannot detect and that manual inspection misses at production volumes. AI Vision identifies clustering events in real time, quantifies their frequency, and correlates their occurrence with upstream conditions including binder batch characteristics and disc moisture. Clusters entering the furnace cause uneven heat distribution and localised over-firing, with direct energy implications at scale.
The Energy-Quality Link: Why the Furnace Burns More Than It Has To
The induration furnace accounts for 70–80% of total process energy in a straight-grate pelletizing configuration, and 50–65% in a grate-kiln system. Every degree of firing temperature above the minimum adequate to achieve the crush strength specification is a direct energy cost with no quality benefit. The reason most plants run above this minimum is not a process engineering decision — it is a quality information deficit. When the quality system cannot confirm that the incoming green ball quality characteristics are consistent enough to achieve crush strength at the minimum setpoint, plant operators compensate by holding the setpoint high. The furnace absorbs the uncertainty cost.
The Energy Drain: Three Stages Where Quality Uncertainty Becomes Fuel Cost
1
Balling Circuit — Moisture Drift Above the Optimal Window
The balling disc operates within a moisture window of approximately ±0.3% around the target where green ball strength and size distribution are simultaneously within specification. Static control charts detect drift only after it has persisted across multiple sampling intervals. AI Vision QC detects the surface morphology signature that precedes a moisture excursion — pellet surface sheen, micro-crack density, and shape elongation changes that appear visually before they appear in sensor data — and issues an alert while the moisture adjustment is still achievable without a quality penalty.
Every 1% excess moisture above optimal increases furnace drying energy load by approximately 3–5% per tonne produced.
2
Induration Furnace — Temperature Zone Running Above Minimum Adequate
AI Vision QC's continuous pellet quality feed gives the furnace control system the confidence to operate at minimum adequate firing temperature rather than a conservative buffer. When the AI vision system confirms incoming green ball quality is within the range that achieves crush strength at the lower setpoint, the plant has documented technical justification to reduce the temperature target — and to maintain it there through blend and recipe transitions, where static systems would require a precautionary temperature increase during the uncertainty window.
Firing temperature 20°C above the minimum required represents approximately 1.5–2.5% excess annual fuel consumption on the furnace.
3
Binder Dosage — Over-Dosing as a Hedge Against Green Strength Uncertainty
When the quality system cannot reliably confirm that minimum-spec binder dosage is delivering adequate green strength — because it lacks continuous visual confirmation of pellet surface integrity — plant operators run dosage above minimum as a hedge. AI Vision QC provides the real-time surface quality signal that makes minimum effective dosage the operationally safe default, rather than a risk that requires a conservative buffer above it. The result is reduced drying energy per tonne, lower material cost, and improved pellet iron grade by reducing flux dilution.
Excess bentonite at 0.5% above minimum effective dosage adds approximately 0.3–0.5 GJ/t to drying energy requirements.
How Deep Learning Vision Works in a Pelletizing Environment
The camera systems deployed in AI Vision Quality inspection for pelletizing are purpose-configured for the environment: high-speed line-scan or area-scan cameras with LED illumination systems that are rated for dust, heat, and vibration. The cameras do not produce simple pass-fail outputs. They feed continuous image streams to deep learning inference models that classify and measure pellet characteristics across multiple dimensions simultaneously — size, shape, surface texture, crack density, colour uniformity as a proxy for moisture distribution — and return structured quality data to the SPC platform within milliseconds.
The deep learning models underpinning this inspection are not generic computer vision frameworks adapted to mining. They are trained specifically on iron ore green pellet imagery under the lighting and environmental conditions of the deployment site, with ground-truth labels provided by quality test outcomes — so the model learns to associate surface visual characteristics with the crush strength, size distribution, and moisture results that production testing subsequently confirms. This training loop is what gives the 24-hour-ahead defect prediction its accuracy: the model is not extrapolating from general principles but from the specific visual-to-outcome correlations that exist in this plant's production history.
Multivariate ML: Pattern Detection Across Variables No Single Chart Can See
A pelletizing plant generates hundreds of simultaneously-tracked process variables. AI Vision QC adds visual quality variables — pellet surface crack density, shape distribution scores, clustering frequency, colour deviation index — to this stream and monitors the cross-variable pattern continuously. The combination of visual signals and process sensor data predicts quality failures and energy excursions with an accuracy no univariate chart can match. When the multivariate pattern begins trending toward a historically problematic configuration — even when no single variable has crossed its individual limit — the platform generates an alert with the lead time needed to act.
Visual + sensor fusion
24-hour defect forecasting
Cross-variable pattern alerts
Energy excursion prediction
Self-Tuning SPC Limits: Calibrated to Every Process Regime Change
Static SPC limits calculated from a historical capability study become miscalibrated the moment the process transitions to a new ore blend, binder batch, or pellet grade. That transition period — which in a multi-blend, multi-grade plant is nearly continuous — is the window where the static system generates false alarms or misses genuine deviations. AI Vision QC's self-tuning limits update continuously from the live data stream, automatically switching to the correct specification profile when a recipe change is registered, and recalibrating baseline statistics as blend characteristics evolve. Every alert reflects a genuine deviation from current operating conditions, not from a study performed months ago.
Auto recipe switching
Ore blend recalibration
Continuous Cpk/Pp/Ppk
Zero manual recalculation
The Plant Executive Dashboard — What AI Vision QC Shows at the Operations Level
View A
Live Pellet Quality Feed
Real-time visual quality scoring for every pellet batch — size distribution histogram, surface crack index, shape regularity score, and clustering frequency — updated continuously from the camera system at the balling discharge and furnace inlet. When visual quality degrades, the energy impact is quantified immediately and displayed as projected fuel cost per hour, giving operations the business case for correction rather than just the quality signal.
View B
Specific Energy per Tonne — Live
Real-time specific energy consumption per tonne broken down by zone — balling, drying, induration, cooling — correlated with the visual quality variable state for each zone. The plant executive sees not just the energy figure but the quality cause driving it. When induration energy rises above the efficient band, the dashboard surfaces the visual quality driver: whether surface crack density has increased, whether size distribution has widened, or whether a blend transition is creating the uncertainty that is being compensated by temperature.
View C
Predictive Alert Feed
Multivariate ML predictions ranked by severity and projected lead time to confirmed quality event. For crush strength failures, lead time is typically 4–8 hours — providing a batch isolation or firing profile adjustment window before out-of-spec product is committed. Each alert includes the top contributing variables, giving quality engineers a precise investigation starting point rather than a general warning flag. The false alarm rate is 50–70% lower than static SPC systems, which means every alert is taken seriously.
View D
COPQ Dashboard — Live
The cost of poor quality dashboard translates quality events — oversize recycle tonnage, crush strength rejects, binder over-dosage hours, energy excursion events — into their operational cost equivalents, updated in real time. When quality-driven energy waste is expressed in dollars per shift rather than GJ per tonne, the business case for tighter AI Vision QC becomes continuously visible at the executive level. The savings from reducing conservative over-inputs are directly measurable against the COPQ baseline without requiring a separate financial analysis.
We had been running the induration furnace above minimum adequate temperature for over two years — not because the process required it, but because our quality system could not give us the visual confirmation that incoming green ball quality was consistent enough to reduce the setpoint safely. After deploying AI Vision QC and running the system in shadow mode for six weeks, we had the documented confidence to reduce the firing setpoint. We have maintained it for 14 months. Fuel consumption on the grate-kiln system is down 6.4% year-on-year. The quality system gave us the energy saving. The energy system had nothing to do with it.
— Plant General Manager, Iron Ore Pelletizing Operation, Grate-Kiln Configuration, 4.5 Mtpa
Deep Learning Vision · Multivariate ML · Self-Tuning SPC · Live COPQ
Every degree of excess firing temperature is a quality information deficit. AI Vision QC closes it at the source.
iFactory gives plant executives the AI Vision Quality platform that keeps moisture, surface integrity, and induration temperature in the energy-efficient quality window — continuously, without manual recalibration, for every ore blend and every pellet grade.
The ROI Case: What 4–10% Specific Energy Reduction Means at Scale
Energy accounts for 15–25% of total production cost per tonne in fuel-intensive grate-kiln pelletizing configurations. For a 5 Mtpa plant running an induration energy intensity of 0.25 GJ per tonne of pellet, a 7% reduction in specific energy consumption represents approximately 87,500 GJ of annual savings. At natural gas prices of USD 8/GJ, that is USD 700,000 in annual fuel savings from one parameter — one that requires no capital expenditure, no process modification, and no new equipment beyond the AI Vision QC deployment itself. It requires only the quality confidence to operate at minimum adequate temperature rather than at a conservative buffer.
Three COPQ Reduction Pathways — How AI Vision QC Converts Quality Improvement Into Financial Return
Pathway A
Induration Temperature Reduction
When AI Vision QC provides the green strength confidence to reduce firing temperature to minimum adequate setpoint, direct fuel savings of 3–6% are achievable. The savings scale directly with plant capacity and prevailing fuel price, and are permanent — not a one-time optimisation event. Every tonne produced at the lower setpoint captures the saving indefinitely.
Pathway B
Binder Dosage at Minimum Effective Level
Eliminating precautionary over-dosing of bentonite reduces drying energy load per tonne, decreases material cost, and improves pellet iron grade by reducing flux dilution. For operations running 0.5% above minimum effective dosage, the combined energy and material saving is typically USD 0.80–1.20 per tonne — a figure that scales directly with annual production volume.
Pathway C
Oversize Recycle Reduction
Oversize pellets returned to the balling circuit represent previously-inducted energy that must be re-expended. AI Vision QC's early detection of size distribution drift before oversize production peaks typically reduces recycle rate by 30–50% — recovering balling circuit capacity and eliminating the energy already invested in rejected material.
Deployment: From Data Connection to Live AI Vision Operation
Plant executives evaluating AI Vision Quality inspect three questions before committing: how long does deployment take, what internal resources are required, and how is the predictive model validated before it is trusted for operational decisions. Deployment for a pelletizing plant with an existing process historian and LIMS infrastructure typically takes 6 to 10 weeks from first data connection to live AI Vision QC operation.
The historian connection and initial model build consume the first three to four weeks. Shadow mode — where the AI Vision system runs in parallel with the existing quality programme, generating alerts and predictions without driving operational decisions — runs for two to four weeks. Shadow mode is not a delay: it is the validation step that gives the quality team documented evidence of predictive accuracy before relying on it for production holds and corrective actions. It is also the data the plant executive needs to justify the investment to a capital committee. Internal resource requirements during deployment are primarily from the quality and process engineering functions — typically 3 to 5 days of engineering time for data mapping and variable tagging. The plant's operational team does not change workflows during deployment.
Deployment Timeline — From First Connection to Live AI Vision Operation
1–2
Weeks
Historian + Camera Connection
Process variables tagged, LIMS stream connected, camera system calibrated, initial baseline dataset compiled.
3–4
Weeks
Model Build + Limit Configuration
AI Vision model trained on site imagery. SPC limits configured per grade, blend, and zone. Western Electric rules activated.
5–7
Weeks
Shadow Mode Validation
Predictions run in parallel with existing quality programme. Accuracy validated against test results. Executive sign-off on performance.
The 4–10% specific energy reduction that AI Vision Quality delivers in pelletizing is the documented consequence of a single change: giving the induration furnace the real-time quality confidence it needs to operate at minimum adequate input levels rather than at conservative over-inputs that static quality systems require. Every degree of excess firing temperature, every fraction-percent of excess moisture, every additional kilogram of precautionary binder is not a process inefficiency — it is a quality information deficit. AI Vision QC eliminates that deficit at its source.
For plant executives, the strategic case is direct. A quality system that cannot distinguish between a genuine process deviation and a regime transition forces conservative over-inputs as a hedge. A quality system that sees pellet surface characteristics in real time, self-tunes its limits to every ore blend and recipe change, and predicts crush strength failures 24 hours ahead removes that hedge requirement permanently. The capital requirements are low. The deployment timeline is measured in weeks. The financial return is measurable at the shift level and scales with every tonne produced.
iFactory's AI Vision Quality platform is purpose-built for plant executives in mining pelletizing operations who are ready to close the gap between quality programme capability and energy performance targets. Book a Demo to see the platform configured for your pellet grade portfolio and ore blend profile, or talk to an expert about a COPQ reduction assessment for your operation.
Frequently Asked Questions
Standard camera-based size monitoring systems in pelletizing measure particle size distribution using image analysis algorithms that classify pellets by diameter. They report size distribution statistics but do not classify surface characteristics, detect cracks, assess shape regularity, or correlate visual observations with downstream quality outcomes. AI Vision Quality deploys deep learning models that extract dozens of quality-relevant features from each pellet image simultaneously — including characteristics that are not visible to human inspection and that do not correlate directly with size measurements. The result is a quality signal that predicts induration performance, not just size compliance. The two systems address fundamentally different questions: size monitoring asks what size are these pellets, and AI Vision QC asks what will these pellets do in the furnace. Talk to an expert about how iFactory integrates with existing size monitoring infrastructure.
The AI Vision model is trained on paired data: pellet images captured at the deployment site, labelled with the quality test outcomes — crush strength, size distribution, and moisture — that the sampled batches subsequently produced. This pairing is what gives the model its predictive power: it learns the site-specific visual characteristics that correlate with quality outcomes under the lighting, environmental, and ore blend conditions specific to this plant. The training dataset is built from 6 to 18 months of historical production with paired quality records. Model training and validation within the iFactory platform takes approximately 2 to 3 weeks within the deployment timeline. The model continues to learn from live production data after deployment, improving accuracy over time as it accumulates site-specific experience. Book a Demo to see the training and validation process for your site's data profile.
The iFactory platform connects to standard industrial process historians — OSIsoft PI, AVEVA Historian, AspenTech IP.21, and OPC-UA compliant systems — and to standard LIMS environments without requiring historian or LIMS upgrades. The AI Vision camera system connects to the platform as an additional data stream; it does not replace or modify any existing infrastructure. No new process sensors are required: the AI Vision system provides the visual quality data layer that supplements the existing sensor data the plant already collects. The platform adapts to existing infrastructure. Existing infrastructure does not need to adapt to it. Talk to an expert about the connection options for your historian and LIMS environment.
iFactory's COPQ reduction assessment builds the ROI case from your plant's own operational data — current specific energy consumption by zone, current oversize recycle rate, current binder dosage relative to minimum effective levels, current crush strength rejection rate, and current false-alarm frequency on the existing quality system. The assessment outputs a financial baseline and a projected improvement range based on comparable deployments in similar pelletizing configurations. This produces the plant-specific, data-backed ROI figures required for a capital committee submission — not industry averages, but estimates derived from your actual cost and performance data. The assessment is available at no cost as part of iFactory's expert consultation programme. Book a Demo to begin your COPQ reduction assessment.
Each pellet grade is registered as a separate specification profile — its own size range, crush strength target, chemical composition limits, balling moisture window, visual quality benchmarks, and energy KPIs. When the production line transitions between grades, the active specification and the AI Vision QC control limits switch automatically to the new grade profile. The energy performance dashboard segments specific energy consumption by grade, enabling the plant executive to compare energy intensity between blast furnace grade and direct reduction grade production separately — which typically reveals grade-to-grade efficiency differences that single-profile monitoring obscures. Cpk histories, defect records, and energy KPIs are all maintained by grade, providing a clean audit trail and a clear basis for grade-specific improvement programmes. Talk to an expert about multi-grade configuration for your production portfolio.
Calculate Your COPQ Reduction ROI — Get a Free Plant-Specific Assessment Based on Your Own Energy and Quality Data.
iFactory's AI Vision Quality platform for plant executives in mining pelletizing — deep-learning inspection, self-tuning SPC limits, multivariate ML defect forecasting, and a live COPQ dashboard that makes quality-driven energy waste visible at the operations level from day one.