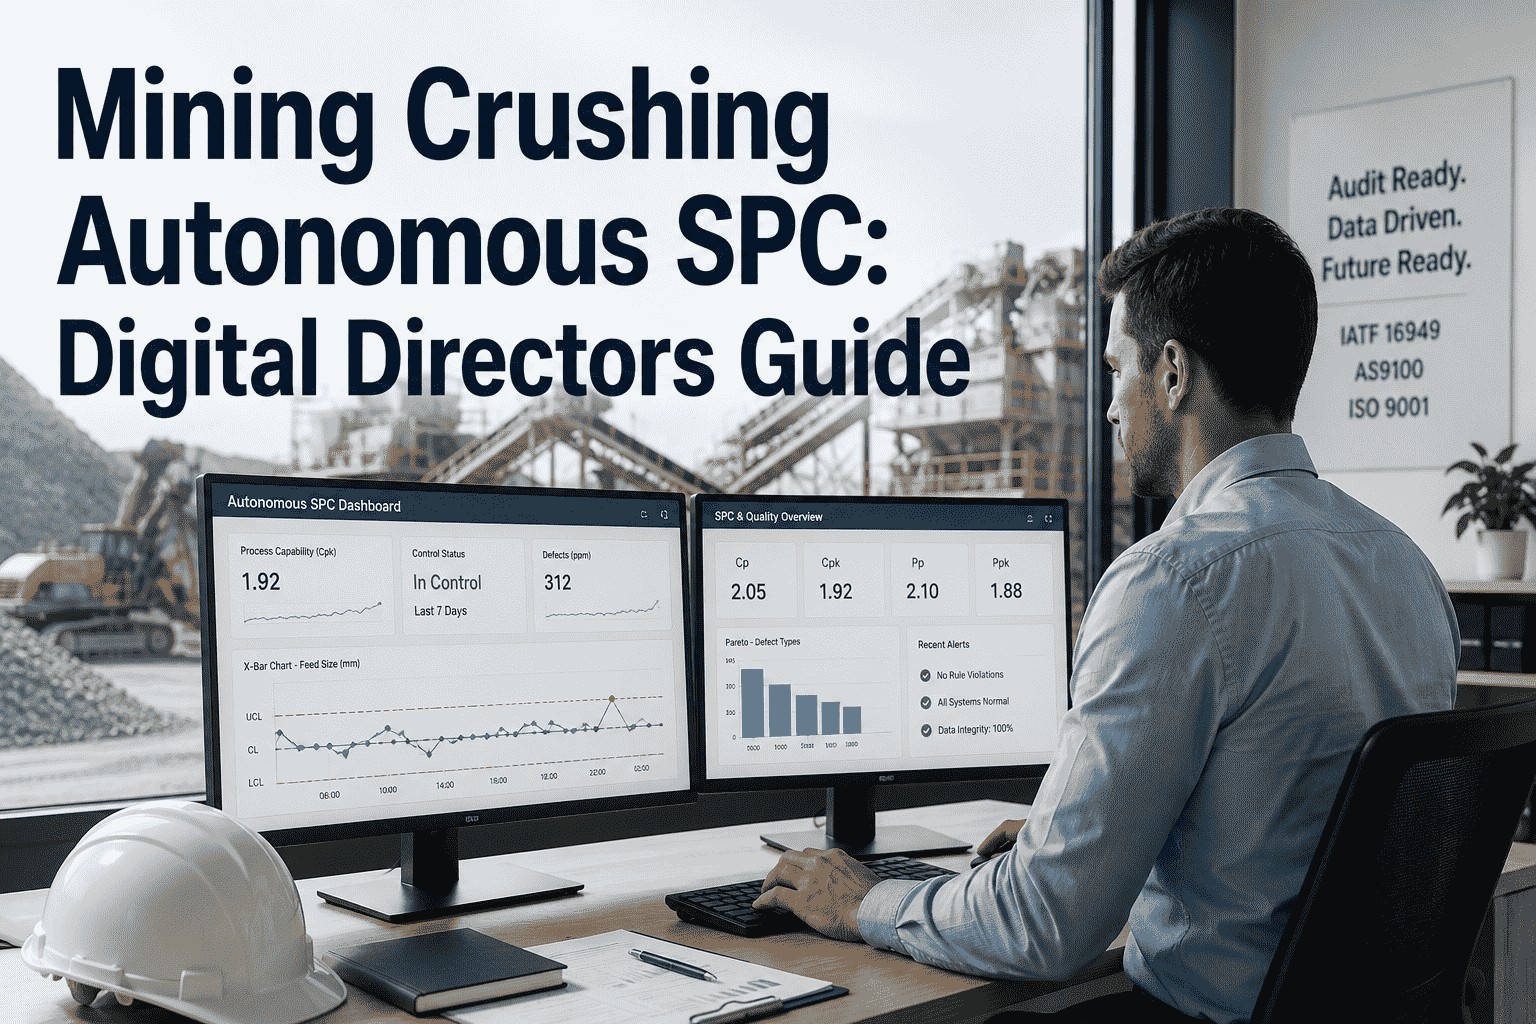
Autonomous SPC: Less Scrap in Mining Crushing

By Grace on June 8, 2026

autonomous-spc-mining-crushing-quality-leaders-scrap-reduction-

The monthly scrap report arrives on the quality manager's desk with the same structure it has carried for the past twelve quarters. A cover sheet showing overall scrap rate as a percentage of throughput. A bar chart breaking down losses by defect category — oversize, fines, contamination. A narrative section attributing the primary causes to feed variation, liner wear, and shift-to-shift inconsistency. And a corrective action plan that reads almost identically to the one filed three months earlier. The scrap rate has not moved more than one percentage point in either direction despite every action item being logged as complete. The reason is not a lack of effort. It is that the statistical process control system generating the quality data cannot distinguish between normal process variation and special cause variation in a crushing circuit where the process baseline shifts every time the ore changes, every time a liner wears, and every time the blend recipe is adjusted. The quality manager is reviewing a report built on control limits that were wrong the day they were calculated. Autonomous SPC replaces this cycle with a self-tuning statistical control layer that adjusts its own baselines, tracks capability indices continuously, and surfaces only the signals that require action — so the monthly scrap report tells a different story each month because the story is actually changing.

Autonomous SPC for Mining Crushing
How Quality Leaders Use Autonomous SPC to Cut Scrap 30-50% in Crushing Circuits
Autonomous SPC replaces static control charts with a self-tuning intelligence layer that tracks Cpk and Ppk continuously, applies all eight Western Electric rules in real time, and surfaces root-cause explanations the moment drift begins — without adding headcount or replacing instrumentation.
The Quality Leader's Scrap Problem

Quality leaders in mining crushing operations face a structural problem that no amount of process knowledge or shift supervision can solve. The data they rely on — control charts, capability indices, defect rates, scrap reports — is generated by statistical process control systems designed for stable manufacturing environments. A pharmaceutical filling line runs the same product at the same speed with the same raw material for months. Its control limits, calculated from an initial capability study, remain valid for the entire production cycle. A mining crushing circuit processing ore from multiple faces with variable hardness, continuous liner wear, seasonal moisture changes, and frequent blend adjustments is the opposite of a stable manufacturing process. Its control limits, calculated quarterly from historical averages, are invalid within days of being set.

The consequences for quality management are measurable and consistent across operations. Scrap rates sit in the 8 to 12 percent range and do not improve despite corrective action plans because the SPC system generating the data cannot tell quality leaders which alarms are real and which are false. Monthly quality reviews spend the first twenty minutes debating whether last month's scrap trend is meaningful or an artifact of outdated control limits. Shift-level Cpk reports show values that swing between 1.0 and 1.6 not because the process is unstable but because the control limits used to calculate Cpk do not reflect the current state of the process. The quality manager is making decisions on data that is structurally unreliable, and the scrap rate is the proof.

Published research confirms that standard control charts applied to mineral processing data without accounting for autocorrelation produce three to five times more out-of-control signals than adaptive or residual-based methods. A supervisor watching a static control chart cannot distinguish between a real drift and a false alarm generated by a change in ore hardness or a liner wear progression that the static limit was never designed to accommodate. The quality leader reviewing the monthly scrap report sees the aggregate result: the same defect categories recurring at the same rates, the same corrective actions filed, the same lack of improvement. Autonomous SPC breaks this cycle by replacing static limits with self-tuning control charts that adjust to every process condition change and surface only the signals that require management attention.

Autonomous SPC vs Traditional SPC
Capability
Traditional SPC
Autonomous SPC
Control limit calculation
Static UCL/LCL from quarterly or monthly historical data
Self-tuning EWMA baseline updated with every data point
Western Electric rules
Applied against static limits — high false alarm rate
Applied against adaptive limits — 40-60% fewer false alarms
Capability index tracking
Cpk calculated batch-wise from weekly lab results
Continuous Cp, Cpk, Pp, Ppk per crusher, per parameter, per shift
Root cause attribution
Manual investigation after alarm — 45-90 minutes per event
ML attribution within 3 minutes — ranked by contribution
Audit trail
Manual logs — gaps, inconsistencies, retrospective entries
Immutable time-stamped records — audit-ready at any moment
Scrap rate outcome
8-12% — stagnant despite corrective action plans
3-6% — trending down with documented improvement trajectory
The Autonomous SPC Architecture

Autonomous SPC is not a faster version of traditional SPC. It is a fundamentally different architecture that continuously adjusts its own baselines, runs pattern detection without human configuration, calculates live capability indices for every monitored parameter, and generates explanations rather than just alerts. The system operates through four integrated layers that process data from the crusher control system and deliver actionable intelligence to the quality team without requiring manual intervention at any intermediate step.

01
Data Ingestion Layer
Connects to existing DCS, SCADA, and data historian infrastructure via OPC-UA and Modbus TCP. Ingests crusher power draw, feed rate, closed-side setting, bearing temperatures, hydraulic pressure, liner wear counters, screen efficiency, and moisture readings. No new sensors required. The layer handles data from 80 to 150-plus variables per circuit at native sampling rates.
02
Analytics Engine
EWMA-based baseline estimation recalculates process mean and standard deviation continuously. Self-tuning UCL and LCL adjust as ore hardness, feed rate, and liner wear shift the distribution. Cp, Cpk, Pp, and Ppk calculated live per machine, per parameter, per shift. When Ppk diverges significantly from Cpk, the engine flags instability that short-term analysis would miss.
03
Detection Layer
All eight Western Electric pattern rules run against adaptive baselines in real time. Rules 1-4 catch acute events and mean shifts. Rules 5-8 detect systematic trends, stratification, and cyclic patterns — including the slow liner-wear drift that single-point alarms never see. Root-cause ML layer ranks contributing variables by percentage when any rule triggers.
04
Reporting Layer
Every alarm, limit change, root cause attribution, and corrective action logged with timestamps and process context. Shift-level Cpk and Ppk reports generated automatically. CAPA documentation compiled in audit-ready format. Quality leaders access a summarized view across all crushers with drill-down to individual event detail. No manual data consolidation required.
Capability Indices in Real Time

For quality leaders, capability indices are the most compact summary of process health available. A single Cpk number translates directly into expected defect rates — but only when it is calculated from current, stable process data rather than historical averages. Autonomous SPC tracks Cpk, Cp, Ppk, and Pp continuously against a rolling production window, updating with every data point and flagging the divergence between short-term and long-term capability that signals developing process degradation.

Parameter
Cpk (Static SPC)
Cpk (Autonomous)
Trend
Cpk/Ppk Gap
P80 product size
0.98
1.42
Improving
0.31 flagged
Fines percentage
0.87
1.38
Improving
0.28 flagged
Closed-side setting
1.12
1.55
Stable
0.15 normal
Power draw per tonne
1.04
1.48
Improving
0.26 flagged
Screen efficiency
0.93
1.41
Improving
0.33 flagged
The Cpk/Ppk gap is a leading indicator that traditional SPC cannot provide. When Cpk is significantly higher than Ppk, the process performs well in short windows but degrades over longer periods — exactly the liner wear pattern that destroys crushing circuit consistency. Autonomous SPC tracks both indices simultaneously and flags divergence before it becomes a scrap event. A Cpk/Ppk gap above 0.25 triggers an investigation alert in the quality dashboard, allowing the team to address the root cause — typically liner wear progression, feed hardness trends, or moisture cycles — before the defect rate increases.
30-50%
Scrap
Reduction
40-60%
False Alarm
Reduction
4
Live Capability
Indices Tracked
What Changes for Quality Leaders

For the quality leader, autonomous SPC transforms the relationship between the data they review and the decisions they make. The scrap report becomes a document of record for improvement rather than a repeating narrative of the same problems. The control charts on the quality dashboard reflect actual process capability rather than the output of limits that were calculated three months ago and have been wrong since day two. The shift from static to autonomous SPC changes three specific dimensions of quality leadership that drive scrap reduction.

01
Reliable Scrap Data
The quality leader sees scrap attributed to confirmed causes rather than speculation. Every percentage point in the monthly report is backed by a root cause finding with ranked contribution, timestamp, and corrective action record. The debate about whether last month's scrap trend is real ends because the data carries its own validation.
02
Continuous Capability Visibility
Cpk, Cp, Ppk, and Pp available per crusher, per parameter, per shift — updated with every data point. The Cpk/Ppk gap flags developing instability before it becomes a scrap event. Quality leaders see the capability trend line moving toward a threshold before it breaches, not after the monthly report reveals it.
03
Audit-Ready Documentation
Every limit change, alarm, root cause attribution, and corrective action is logged automatically with timestamps and process context. CAPA documentation is compiled in the format auditors require without manual data entry. Quality leaders transition from reconstructing the audit trail before an audit to producing it on demand during one.

Our quality management system was generating the same scrap categories on every monthly report for two years. Oversize from liner wear. Fines from over-crushing. Out-of-spec from feed changes. We had filed corrective actions for each one, reviewed them in quarterly management meetings, and watched the scrap rate stay between 9 and 11 percent. The problem was not our process knowledge. It was that our SPC system was using control limits calculated from data that was six months old by the time we reviewed the report. Autonomous SPC gave us control limits that matched what the circuit was actually doing. Within 60 days, our scrap rate dropped to 6 percent, and the monthly report showed a different pattern each month because the improvements we made were actually being reflected in the data.

Quality Manager, Base Metals Operation
From Static Reports to Autonomous Intelligence

The 30 to 50 percent scrap reduction that autonomous SPC delivers in mining crushing operations does not come from tighter limits, more frequent inspections, or additional headcount. It comes from a statistical control system that finally reflects the actual process. When control limits self-tune to ore hardness changes, liner wear progression, and feed variation, the false alarm rate drops to its theoretical minimum and the drift patterns that produce scrap become visible at a stage where corrective action prevents the defect rather than documenting it.

For quality leaders, the difference is between managing a scrap problem and managing a control system that solves it autonomously. The monthly report becomes a document of improvement rather than a record of stagnation. The capability indices on the dashboard reflect what the circuit is actually capable of producing, not what the limits say it should produce. The audit trail is continuous and complete, generated by the system rather than reconstructed from shift logs before an assessment.

The crushing operations that consistently achieve scrap rates below 5 percent of throughput share a common capability: autonomous statistical process control that adjusts to the process rather than requiring the process to conform to limits calculated months ago. That capability deploys as a software layer on existing DCS and SCADA infrastructure. It does not require new sensors, control system replacements, or additional quality staff. It requires a statistical architecture designed for the actual conditions of mining crushing, not for the stable batch processes that traditional SPC was built to serve.

90-Day Deployment Roadmap

Autonomous SPC deploys as a software layer on existing control infrastructure. The system connects to DCS and SCADA historians via OPC-UA and Modbus TCP, establishes initial baselines from 30 days of historical data, and transitions to live autonomous operation within four weeks. The roadmap is designed so quality leaders see meaningful capability data within the first month and measurable scrap reduction within the first quarter.

Days 1-7
Connect and Baseline
DCS/SCADA integration. Variable inventory. 30-day historical ingest. Initial Cpk report across all monitored parameters.
Days 8-30
Shadow Mode
Autonomous limits run alongside static SPC. False alarm comparison documented. Western Electric rules calibrated. Root cause model validated. First Cpk/Ppk gap flags generated.
Days 31-60
Live Activation
Autonomous SPC live on all crushers. Capability indices tracked per shift. Pattern-specific playbooks generated. Supervisors receive autonomous alerts with attribution. Scrap rate tracking begins.
Days 61-90
Sustained Reduction
Scrap rate trending 30-50% below baseline. Root cause frequency report generated. Shift-level Cpk trend data available. Audit-ready records for every event. Quality dashboard showing live capability across all circuits.
Start Your Autonomous SPC Deployment
Get a Free Cpk and Audit-Readiness Assessment for Your Crushing Circuit
Receive a 30-minute walkthrough of autonomous SPC running on your crushing circuit data. We will show you your current Cpk and Ppk across all monitored parameters, the false alarms your static system is generating, and the scrap reduction opportunity specific to your operation.
Frequently Asked Questions

Adaptive SPC refers specifically to dynamic UCL and LCL bounds that recalculate as process conditions change. Autonomous SPC is a broader capability that includes adaptive limits plus continuous capability index tracking (Cp, Cpk, Pp, Ppk), all eight Western Electric rules running against adaptive baselines, automated root cause attribution, and audit-ready reporting. The difference matters for quality leaders because autonomous SPC replaces the entire manual quality monitoring workflow — limit calculation, rule configuration, alarm investigation, documentation — with a self-tuning system that surfaces only the signals requiring management attention. Adaptive SPC solves the false alarm problem. Autonomous SPC solves the scrap reduction problem end to end. Book a Demo to see the full autonomous SPC architecture demonstrated on crushing circuit data.

The Cpk/Ppk gap is one of the most valuable leading indicators that autonomous SPC provides and that traditional SPC cannot. Cpk measures short-term capability based on within-subgroup variation, while Ppk measures long-term capability based on overall process variation including shifts and drift. In a crushing circuit, the gap between these two indices is driven primarily by liner wear progression, feed hardness trends, and moisture cycles — all of which produce gradual process drift that static limits miss. When Cpk is significantly higher than Ppk (a gap of 0.25 or more), it signals that the process performs well in short windows but degrades over longer periods. Autonomous SPC tracks both indices continuously and flags divergence at the parameter level with a root cause attribution. The quality leader sees not just the gap but the variable driving it — typically liner wear at 60 percent contribution — and can schedule preventive action before the gap widens into a scrap event. Talk to an Expert about Cpk/Ppk tracking for your specific circuit configuration.

Autonomous SPC requires access to the process data that most modern crushing plants already collect through their DCS, SCADA, or data historian systems. The core data set includes crusher power draw (amperage or kW), feed rate (tonnes per hour), closed-side setting position, and product quality measurements from online particle size analysers or laboratory information systems. Additional data streams such as bearing temperatures, hydraulic pressure, liner wear counters, screen efficiency readings, and moisture sensors improve model accuracy but are not required to start. iFactory connects via OPC-UA, Modbus TCP, and direct historian exports from OSIsoft PI, Wonderware, and ABB 800xA. The system processes data on an edge computing node installed alongside existing control hardware, with optional cloud connectivity for cross-plant benchmarking. A minimum of 30 days of clean historical data is sufficient for initial model training. Talk to an Expert about a data readiness assessment for your operation.

Autonomous SPC exceeds the documentation requirements of ISO 9001 clause 9.1.1 and IATF 16949 clause 9.1.1.1 for statistical tools and process control documentation. The system maintains a complete audit trail of every adaptive limit change with timestamp, process state, and rationale. Every alarm is logged with root cause attribution, corrective action, and outcome verification. CAPA documentation is generated automatically in the format required by quality management system audits. In documented deployments, IATF surveillance auditors completed SPC reviews in under two hours per plant where the autonomous system was in place, compared to a typical duration of 1.5 days for plants using traditional SPC with manual documentation. The audit-ready state is continuous — quality leaders do not prepare for audits. They produce the record on demand because the system maintains it in real time. Book a Demo to see the audit trail output and compliance reporting capabilities.

Scrap reduction follows a predictable trajectory across deployments. Alarm rate reduction is visible within the first week of autonomous limits going live — typically a 40 to 60 percent drop in total alarm volume as the self-tuning limits eliminate false positives from normal process variation. Cpk improvement trends emerge within the first 30 days as the most common root causes — liner wear progression, feed hardness variation, CSS drift — begin to be identified and addressed systematically. Measurable scrap rate reduction against the established baseline is typically available at the 60 to 90 day mark. Operations processing variable ore from multiple faces or pits typically see reduction at the upper end of the 30 to 50 percent range because their static SPC system was generating the highest false alarm rates and missing the most drift. Operations with more consistent feed see reduction at the lower end but achieve it faster because the replay baseline is shorter. iFactory provides shift-level comparison reporting so quality leaders can show quantified before-and-after performance from the same data the system was already collecting. Book a Demo to see the scrap reduction trajectory for a circuit similar to yours.

A Scrap Report That Repeats Itself Is Not a Report. It Is a Cycle.
iFactory autonomous SPC for mining crushing operations — self-tuning control charts, live capability indices, Western Electric rule detection with root cause attribution, and audit-ready documentation. Purpose-built for quality leaders who need scrap reduction that compounds across quarters, not corrective actions that repeat across them.

Share This Story, Choose Your Platform!