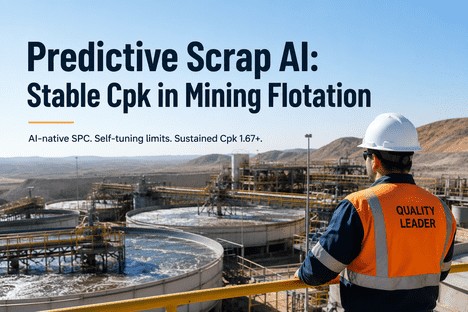
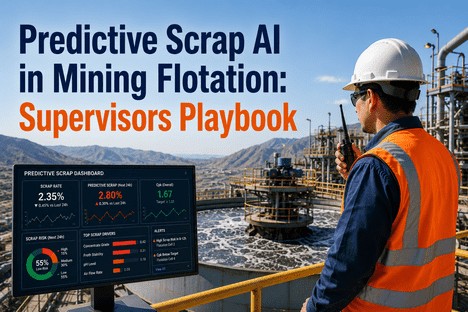
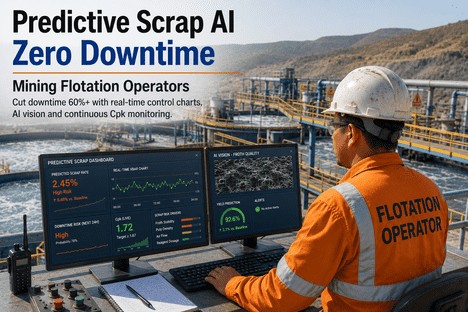
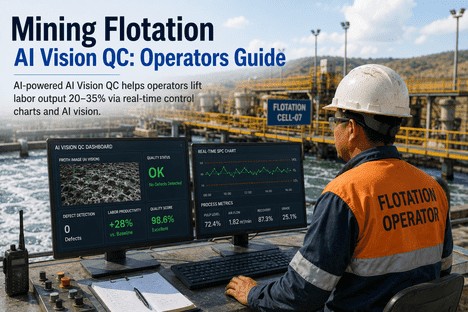
It is 2:17 a.m. on a Wednesday. The flotation circuit operator watches the concentrate grade trend crawl toward the lower spec limit for the third consecutive hour. The SPC dashboard shows green on every parameter. Reagent flow, pH, air addition, froth depth, pulp density. All within the static UCL and LCL that were calculated during last quarter's process capability study. The operator knows something is wrong — the froth looks thinner, the colour is off — but the control chart says everything is fine. By shift handover, the lab confirms the concentrate is off-spec. Eight hours of production tagged for reprocessing. The static control limits that were supposed to protect quality became the reason the defect was missed. For flotation operators still relying on fixed-limit SPC charts updated quarterly, this is not a rare event. It is the recurring cost of using a quality control system designed for stable manufacturing in a process where ore mineralogy, reagent response, and froth characteristics change every hour. Autonomous SPC exists to close this gap — giving operators a self-tuning quality intelligence layer that tracks every parameter continuously and alerts them the moment real drift begins, not hours later when the lab confirms what they already suspected.
Why Static SPC Charts Fail Flotation Operators on Every Shift
Statistical process control was developed for manufacturing lines where the raw material is consistent, the tooling does not wear mid-run, and the process baseline stays stable for months. Froth flotation is the opposite of that environment. Feed mineralogy changes every time the mining face moves. Reagent effectiveness shifts with ore hardness and pulp chemistry. Froth characteristics — bubble size, stability, velocity, colour — respond to changes in air flow, pulp level, and particle size distribution that occur on minute-by-minute timescales. A control limit calculated from last quarter's feed assay data has no statistical relationship to what the flotation circuit is doing right now.
The operator on shift sees this disconnect every day. Static UCL and LCL boundaries produce alarms that fire constantly during normal feed transitions — training operators to dismiss the very signals that are supposed to protect quality. Meanwhile, real drift events — a gradual drop in feed grade, a change in frother effectiveness, a pH probe drift that goes unnoticed — slide under the fixed detection threshold because the static limits were set for a different ore type at a different recovery rate. By the time the lab assay confirms the off-spec condition, the operator has been running blind for hours.
The problem is structural, not behavioural. The SPC system the operator is working with was designed for conditions that do not exist in a live flotation circuit. Autonomous SPC replaces that system entirely — not by asking operators to check charts more frequently, but by making the charts self-correcting. Control limits that recalculate from the current process window. Western Electric rules that run automatically on every parameter. Cpk that updates with every data point. The operator does not need to become a statistician. The system does the statistics, and the operator gets a clear instruction when action is needed.
What Autonomous SPC Actually Does Inside a Flotation Circuit
Autonomous SPC is not traditional SPC with a faster refresh rate. It is a structurally different system that continuously recalculates its own baselines, runs pattern detection without human configuration, and generates root-cause explanations — not just alarms. For the flotation operator, this means the control charts on the screen finally reflect what the process is actually doing, and every alarm that fires is a signal worth acting on. The system operates through a continuous four-stage cycle that runs on every data point from every sensor in the circuit.
I have been operating flotation circuits for 12 years. I learned to ignore the SPC alarms because they fired every time the ore changed. The autonomous system is different. It does not scream at me when the feed drops. It adjusts the limits and tells me exactly what changed. I caught a reagent line blockage at 45 minutes into the shift instead of 3 hours. That is the difference between a good shift and a scrap report.
— Flotation Circuit Operator, Copper-Zinc Concentrator, 12 Years ExperienceThe Flotation Parameters That Autonomous SPC Monitors Continuously
A flotation circuit has more interacting variables than any other mineral processing stage. Autonomous SPC tracks every instrumented parameter simultaneously — applying adaptive limits, Western Electric rules, and live Cpk to each one. The table below maps the critical parameters for each flotation stage and the drift events that autonomous SPC detects before they produce off-spec concentrate.
What the Operator Sees: The Autonomous SPC Control Room
An autonomous SPC platform generates value only if the operator can act on its output in real time. The iFactory operator interface is designed around the three questions that define every flotation operator's decision loop — without requiring navigation through separate systems or manual chart interpretation.
Deploying Autonomous SPC: What the Operator Needs to Know
Transitioning from static to autonomous SPC does not require replacing the DCS, installing new sensors, or retraining operators on unfamiliar software. The autonomous model runs as a software layer on top of the existing control infrastructure, ingesting live data from standard historians and displaying self-tuning control charts on the same operator dashboards used today. The operator does not learn a new system. The system learns the operator's process.
With 30 days of clean historical data, the initial autonomous limits deploy within 24 to 72 hours after data connectivity. The EWMA model uses a minimum of 100 data points per parameter to establish the initial rolling window. At typical flotation data collection rates of one measurement per minute, this represents less than two hours of production data. The system then runs in shadow mode alongside the existing static SPC for two to three weeks, allowing operators to compare limit behaviour and validate autonomous alerts against their own observations. After validation, the autonomous limits replace the static limits as the primary control chart reference. Operators see the same charts they always have — the difference is that the limits now mean something.
Conclusion
The flotation operator running a conventional SPC programme is working with a quality control system that was designed for a fundamentally different operating environment. Static limits that were correct at commissioning become progressively less accurate as feed mineralogy, reagent response, and froth characteristics shift through every shift. Lab samples that arrive hours after the material was produced do not provide quality control — they provide quality history. Cpk numbers from quarterly studies do not tell the operator what the circuit is capable of right now. They document what it was capable of three months ago under different feed conditions.
Autonomous SPC changes this structural misalignment by making the control limits self-correcting. The operator does not need to calculate limits, does not need to interpret ambiguous alarms, and does not need to wait for the lab to confirm what the froth appearance already suggests. The system calculates, interprets, and attributes — and the operator acts on a clear instruction delivered at the moment it matters. The 30 to 50 percent scrap reduction that flotation teams achieve with autonomous SPC does not come from working harder. It comes from working with a quality intelligence system that is designed for the actual condition of the process: variable, interactive, and continuous.
The compliance evidence generated by autonomous SPC is equally important for the operator's documentation workload. Every shift produces a complete quality record: per-cell parameter values, live Cpk for each monitored variable, control chart state at time of production, Western Electric rule violation log, and operator intervention record — all timestamped and linked to the feed type and reagent regime. That documentation, which previously required manual chart review and spreadsheet entry at shift handover, is generated automatically by the system that already monitored the process. For the operator preparing for an ISO 9001 or AS9100 audit, the difference between manually reconstructing the quality record after the fact and having it generated as a byproduct of the shift is the difference between hours of overtime and a clean handover.
Autonomous SPC does not ask the operator to become a statistician. It does the statistics — the EWMA calculations, the Western Electric rule evaluations, the Cpk tracking, the root-cause attribution — and hands the operator a single clear instruction when action is needed. The operator's job shifts from watching charts to running the process, which is where the operator's experience has always delivered the most value.