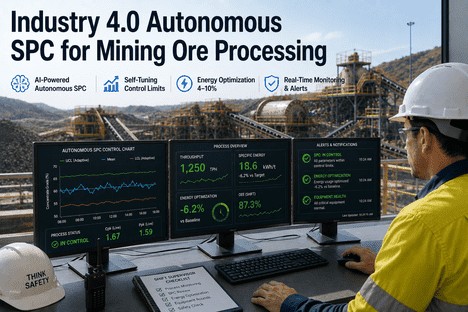
At 3:45 p.m. on a Tuesday, the shift supervisor watches the SAG mill power draw climb past 11 MW for the third time this shift. The control board shows every parameter within its static control limits. The operator is adjusting feed rate manually based on instinct. The metallurgist will review the Cpk report at the end of the week. Forty-five minutes later, the mill trips on overload. The recovery sequence costs 90 minutes of production and 14 MWh of energy that went into circulating load rather than breakage. The supervisor knows the energy was wasted, but the SPC system gave no warning because the control limits were last calculated during commissioning. The energy loss was not detected. It was simply accepted as normal operation. Autonomous SPC closes that gap by replacing static limits with self-tuning control charts that continuously recalculate UCL and LCL from live process data, running Western Electric rules and Cpk tracking automatically, so supervisors see energy drift before it becomes a power spike and a lost shift.
In ore processing, comminution alone consumes 40 to 70 percent of the total plant energy budget. Grinding circuits pull megawatts continuously, and every unnecessary kilowatt-hour spent on recirculating load, over-grinding, or recovery from a mill trip is energy that contributed nothing to throughput. The cost is not visible on a control chart that was calibrated six months ago because static limits cannot distinguish between normal operating variation and accumulating energy waste. The chart stays green while the power bill climbs. The breakdown below shows where energy is consumed and where autonomous SPC intervenes.
Most ore processing plants operate somewhere between generation one and generation two. The shift to generation three, autonomous SPC, is what unlocks the 4-10 percent energy reduction that reactive systems cannot reach. The table below maps the operational difference across every dimension that matters to a shift supervisor.
- Control limits set at commissioning, recalculated quarterly if reviewed
- Western Electric rules checked manually on printed charts
- Cpk calculated from end-of-shift data pull
- Energy drift invisible until power spike triggers alarm
- Operator adjusts feed rate based on experience
- Process recovery after trip: 60-120 minutes
- Control charts displayed on DCS with automated limit calculation weekly
- Western Electric rules run in software, alarms triggered on violation
- Cpk batch-calculated and reported per shift
- Energy drift visible in trend, but no predictive intervention
- Operator receives alarm then investigates manually
- Process recovery after trip: 30-60 minutes
- Control limits recalculate continuously from rolling process window
- Western Electric and Nelson rules run in real time with auto-classification
- Cpk, Cp, Pp, Ppk tracked per circuit continuously
- Energy drift flagged 2-6 hours before threshold crossing
- Supervisor receives alert with root cause and recommended correction
- Process recovery after drift: prevented before trip occurs
Autonomous SPC reduces energy through four specific mechanisms that operate across every ore processing circuit. Each mechanism produces a measurable reduction in specific energy consumption, and together they create the 4-10 percent improvement documented across industrial APC deployments.
Each circuit responds to autonomous SPC differently. Grinding delivers the largest absolute energy savings because it consumes the most power. Flotation delivers the highest value savings because recovery improvements compound across the entire concentrator. The following breakdown shows the documented reduction range for each circuit based on industrial APC and autonomous SPC deployments.
- Mill load variability compressed 40-50% through continuous limit recalculation
- Power draw trend detected 2-4 hours before overload via Western Electric Rule 3 automation
- Circulating load stabilised, reducing energy per tonne of finished product
- Air flow per cell optimised against real-time pulp level, reducing compressor energy
- Reagent dosing precision improved via Cpk-driven setpoints, lowering chemical energy embedded in production
- Grade variability compressed, reducing re-grind energy for off-spec concentrate
- Underflow density stabilised through autonomous limit management, reducing pump energy per dry tonne
- Flocculant dosing optimised against real-time feed solids, cutting chemical waste and embedded energy
- Filtration cycle times stabilised by consistent underflow density, reducing press energy per cycle
- Grade trajectory monitoring prevents energy spent processing material that will be rejected post-assay
- Continuous Cpk on grade parameters reduces rework energy by maintaining spec on the first pass
- Spec-boundary proximity alerts allow feed rate adjustments before off-spec production consumes energy
The implementation of an advanced regulatory control structure in a copper SAG mill circuit achieved a 5.84 percent reduction in specific energy consumption and a 1.90 percent increase in productivity. The standard deviation of power draw decreased by 53 percent, confirming that variability compression is the primary mechanism driving energy improvement.
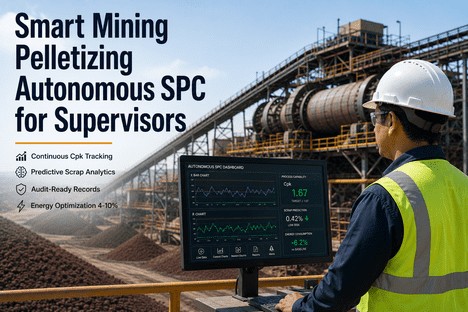
- Specific Energy Reduction in a SAG Mill Circuit by Automatic Control, Scientific Reports, 2025The autonomous SPC interface is not a quality engineer's tool repurposed for the shift floor. It is built around the decisions a supervisor makes during a shift: which circuit needs attention, which parameter is drifting, whether the process is capable of holding spec at current throughput, and where energy is being consumed unnecessarily. The dashboard presents this information in four zones that match the supervisor's workflow.
The ore processing operations that achieve consistent 4-10 percent energy reductions are not the ones with the newest mills or the most aggressive throughput targets. They are the ones whose supervisors see energy drift as a trend rather than a trip, whose control limits reflect the current shift rather than the commissioning study, and whose Cpk data is available continuously rather than at the week-end quality meeting. The energy is already in the circuit. The question is whether the SPC system is tuned to find it and return it to throughput.
Autonomous SPC does not require new sensors. It does not require a DCS replacement or a plant-wide automation upgrade. It requires the analytics layer that recalculates control limits continuously, runs Western Electric rules automatically, and tracks Cpk per circuit in real time. That layer is available now, and the supervisors who deploy it are the ones who will consistently meet energy reduction targets while their counterparts investigate the same power spikes shift after shift. Book a Demo to see autonomous SPC running on your circuit data, or Get In Touch to start the data assessment for your operation.
Most DCS-based SPC systems are generation one or two: they display control charts on the operator screen, may calculate limits from a static data set, and fire an alarm when a point exceeds the UCL or LCL. They require manual limit recalculation, manual rule checking, and manual Cpk reporting. Autonomous SPC is generation three: control limits recalculate continuously from a rolling data window, all eight Western Electric rules run automatically on every charted parameter, and Cpk, Cp, Pp, and Ppk are tracked in real time per circuit. The difference is not cosmetic. It is the difference between a system that reports what already happened and a system that alerts supervisors to what is currently developing. Book a Demo to see autonomous SPC running alongside your existing DCS SPC for direct comparison.
The opposite. Autonomous SPC reduces total alarm load by classifying violations by severity and suppressing common-cause alerts that do not require supervisory action. When a point exceeds the adaptive limit but the deviation is within the process's natural capability band, the system logs the event but does not generate an operator alarm. Only Western Electric rule violations that indicate assignable-cause drift trigger supervisory alerts. Documented deployments show a 72 percent reduction in nuisance alarms when autonomous SPC replaces static limit-based alarming. The supervisor investigates fewer alarms — but every alarm that reaches the supervisor is actionable. Get In Touch to see the alarm reduction data from your circuit.
Yes. iFactory connects to standard industrial historians including OSIsoft PI, AspenTech IP.21, Inductive Automation Ignition, and SQL-based process data stores without requiring changes to your existing DCS, SCADA, or sensor infrastructure. The autonomous SPC layer runs on top of your current data pipeline, reading process measurements at their existing collection frequency and writing control limit calculations, Cpk values, and rule violation alerts back to your historian for audit trail purposes. The typical integration timeline is two to four weeks for a single circuit. Get In Touch to start the integration assessment for your facility.