Smart Mining Pelletizing Autonomous SPC for Supervisors
By Grace on June 11, 2026
Every megajoule wasted in the induration furnace is a cost you approved on the previous shift. As a supervisor in a pelletizing plant, energy is not an abstract efficiency metric — it is baked into every decision the control room makes about firing zone temperature, drying air velocity, and disc rotation speed. The problem is that most plants are still running those decisions against static setpoints that were configured during a process capability study months or years ago, using a different ore blend, a different binder batch, and a different pellet grade. The result is predictable: overcorrection, furnace temperature overshoot, excessive recycle, and a specific energy consumption figure that runs 6 to 12% above what it should be — shift after shift, with no alert to tell you why.
Autonomous SPC changes the equation. It does not wait for the operator to notice the drift. It does not fire false alarms every time you switch ore source. It recalculates what normal looks like in real time, monitors every key process variable against that current baseline, and surfaces the correction before the energy waste has already happened. For supervisors, this is not a technology upgrade — it is a shift in how process control accountability works on the floor.
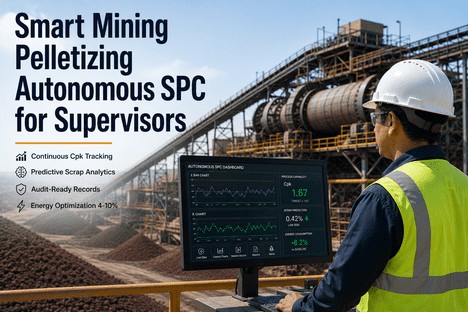
Autonomous SPC · Self-Tuning Control Charts · Cpk Continuous Tracking · Predictive Energy Alerts
Your Induration Furnace Is Running on Last Quarter's Setpoints. Autonomous SPC Runs on Today's Process.
iFactory's autonomous SPC engine self-tunes control limits to your current ore blend, binder batch, and recipe — cutting specific energy consumption 4–10% by eliminating overcorrection, false alarms, and the thermal drift that supervisors never see until it shows up in the monthly energy report.
Specific energy reduction achievable through autonomous SPC and real-time process optimisation in pelletizing induration
101.5 kWh
Average electrical energy consumed per tonne of pellets — one of the highest unit energy costs in the ironmaking chain
20%
Projected efficiency gain for pellet plants deploying AI-driven autonomous process controls by 2026
40+
Interacting process variables in pelletizing that influence energy consumption — no operator can track all of them simultaneously
Where Energy Is Lost in Pelletizing — and Why Supervisors Cannot See It in Real Time
Energy loss in pelletizing does not announce itself. It accumulates in small, compounding deviations — a firing zone temperature that runs 15°C above optimal for two hours, a drying air volume that is not adjusted when green pellet moisture drops, an oversize recycle burden that forces the disc to work harder than the feed rate should require. None of these individually triggers a quality reject. Together, they add up to 6 to 12% excess energy on the shift report that no one can trace to a specific cause, because by the time the report is generated, the process has moved on.
The Five Energy Loss Points Autonomous SPC Monitors Continuously
01
Induration Temperature Overshoot
Firing zone temperatures running above the optimal window for the current pellet moisture and size distribution waste fuel directly. Each 10°C of sustained overshoot above the optimal firing temperature adds approximately 0.8–1.2% to specific fuel consumption per tonne. Static setpoints do not adjust when green pellet characteristics shift — autonomous SPC detects the mismatch and alerts before the excess heat is delivered.
02
Excess Oversize Recycle Load
Every tonne of oversize pellets recycled back through the balling disc represents energy already spent on balling, handling, and screening — with zero product yield. High recycle rates also increase the effective feed volume through the circuit, raising disc motor load and conveyor energy. Autonomous SPC detects moisture and particle size combinations trending toward oversize before the screen confirms it, cutting recycle before the energy cost accumulates.
03
Drying Zone Inefficiency from Moisture Variation
Green pellet moisture entering the induration furnace drives drying zone energy demand directly. A ±0.5% swing in green pellet moisture from the optimal balling window forces the drying zone to work harder, consumes more drying air, and risks spalling if the moisture is too high. Autonomous SPC tracks moisture against the adaptive optimal window for the current ore blend — alerting the operator to correct balling moisture before moisture-laden pellets reach the furnace.
04
Furnace Heat Distribution Imbalance
Non-uniform pellet size distribution entering the furnace creates uneven bed permeability, which forces higher air and gas throughput to achieve uniform firing across the bed. The energy penalty for a wide size distribution versus a tight on-spec distribution can reach 3–5% of total furnace energy. Autonomous SPC monitors size distribution trends at the disc and flags distribution widening before the affected pellets reach the furnace charging point.
05
Binder Over-Dosing to Compensate for Process Uncertainty
When operators lack confidence in process stability, the common defensive action is to increase binder addition rates to ensure green ball strength — even when the process does not require it. Over-dosed bentonite increases the acidic gangue load in the pellet, which raises downstream energy consumption in the blast furnace or DRI reactor. Each 1% excess bentonite addition increases DRI energy consumption by approximately 30 kWh per tonne of product. Autonomous SPC gives operators the process confidence to hold binder at the optimal rate rather than adding a safety buffer.
What Autonomous SPC Actually Does — and What Makes It Different From the SPC You Already Have
Most pelletizing plants have some form of SPC. The problem is almost always the same: static control limits that were set during a process capability study and have not been updated since. When the ore blend changes, those limits fire false alarms. When the binder batch changes, the system does not know. When you switch pellet grades, the operators learn to ignore the SPC board for the first two hours of the new run because it will flag everything as out of control. Autonomous SPC eliminates every one of those failure modes — because the limits are not static.
Conventional SPC — What Supervisors Deal With Today
Control limits calculated once during process qualification — never updated for ore blend or recipe changes.
False alarms every ore transition train operators to ignore the SPC board. Real drift gets missed in the noise.
Western Electric rules applied to a static baseline — violations flagged without context for whether the process has legitimately changed.
Cpk calculations done in monthly reviews by quality engineers — no real-time visibility during the shift when process decisions are made.
Energy waste identified in the shift energy report — hours after the overcorrection that caused it.
Autonomous SPC — What iFactory Delivers
Self-tuning UCL/LCL recalibrate continuously against the current ore blend, binder batch, and active recipe — no manual limit updates required.
False alarm rates drop 50–70% within the first two weeks — alerts that do fire are real, restoring operator confidence in the system.
Western Electric rules run continuously against the adaptive baseline — violations flagged only when the deviation is inconsistent with current process state.
Cpk, Cp, Pp, and Ppk calculated in real time for every monitored variable — supervisors see process capability live, not in next month's report.
Predictive energy alerts fire before the overcorrection — supervisor sees which parameter is driving the energy deviation and the recommended correction.
The Energy Waste Your SPC Board Cannot See Is the One That Keeps Repeating. Autonomous SPC Finds It Before It Starts.
iFactory's autonomous SPC runs Western Electric rules, continuous Cpk tracking, and predictive energy alerts against a self-tuning baseline — giving supervisors the process visibility to cut specific energy consumption 4–10% without adding workload to the operator.
The Supervisor's View: What Autonomous SPC Looks Like Across a Shift
Autonomous SPC is not a tool for quality engineers working in an office. It is built for the shift floor — designed to give supervisors three things they do not have with current SPC: a live process stability score they can read at a glance, an alert that fires before the energy waste has accumulated, and a handover report that does not require anyone to fill in a paper log. Here is what the system delivers across a standard 12-hour shift in a pelletizing plant.
Shift Start — Handover
Incoming supervisor sees the live process state, not a paper summary
The handover dashboard shows the outgoing shift's Cpk scores across all key quality characteristics, any alerts fired and corrective actions taken, the current ore blend and binder batch in use, and whether the autonomous limits have completed calibration to the current process regime. The supervisor knows in 90 seconds exactly where the process stands — without asking anyone to verbally brief them or reading a handwritten shift log.
Mid-Shift — Ore Blend Transition
Limits recalibrate automatically — no false alarm storm at the transition
When the operator logs the ore blend transition, the autonomous system registers the change and begins updating the baseline using incoming process data from the new feed. During the calibration window, the dashboard flags that a transition is active — so the supervisor sees context, not false alarms. If genuine drift occurs during the transition — not just the expected process shift — the alert fires against the new baseline, not the old one. The supervisor gets only alerts that matter.
During Shift — Energy Alert
Predictive alert fires with a ranked cause and a recommended action
The supervisor receives an alert: "Induration energy deviation trending upward. Primary driver: green pellet moisture at 9.9% — 0.5% above adaptive optimal for current particle size distribution. Firing zone temperature compensating upward. Recommended action: reduce balling moisture addition by 0.4 L/min." The operator makes the adjustment. The supervisor confirms the trend reversal on the dashboard within 20 minutes. The event is logged automatically — no manual entry, no verbal instruction chain, no paper record.
Shift End — Documentation
Audit-ready shift report generated automatically — no paper log required
At shift end the system generates a complete quality and energy record: total specific energy for the shift, Cpk scores for every monitored quality characteristic, all alerts fired with timestamps and operator actions, any recipe or blend changes logged, and the current process state for handover. Every record is timestamped, searchable, and exportable — meeting ISO 9001 audit requirements without any manual documentation work from the supervisor or the outgoing operator.
Real-Time Cpk: Why Supervisors Need Capability Scores During the Shift, Not After It
Cpk is the most honest measure of process performance a supervisor has access to — but in most pelletizing plants it is calculated once a month, by a quality engineer, from data that is already three to four weeks old. By the time a low Cpk value is identified and escalated, the process condition that caused it has already produced scrap, consumed excess energy, and been corrected empirically by an operator who never knew there was a systemic issue. Real-time Cpk flips this: the supervisor sees capability declining in the current shift — and can act before the consequence materialises.
Cpk, Cp, Pp, Ppk — What Each Metric Tells the Supervisor in Real Time
Cpk
Process Capability — Centring and Spread
Shows whether the process is producing output centred within the specification and whether the natural variation is tight enough to stay within spec limits. A Cpk below 1.33 in green pellet moisture means the process is regularly producing moisture values that push toward the oversize or undersize boundary. Supervisors use live Cpk to decide when a parameter needs active control intervention versus routine monitoring.
Cp
Process Potential — Spread Only
Shows how tight the process variation is, regardless of where the process is centred. A high Cp with low Cpk tells the supervisor the process is precise but aimed wrong — the variation is small but consistently off-centre. In induration temperature control this means the furnace is stable but running at the wrong setpoint, which wastes energy without triggering a quality reject.
Ppk
Performance Index — Long-Term Variation
Captures all sources of variation over the period being measured, including ore blend changes, shift changeovers, and binder batch transitions. A declining Ppk trend across multiple shifts tells the supervisor that something systemic is widening the process variation — not random noise but a structural change in the inputs or equipment that requires investigation.
Pp
Performance Potential — Actual vs Specified
Compares the actual spread of all production data to the specification width without assuming the process is centred. In fired pellet crush strength, a declining Pp score over a week of production is the earliest warning that the induration process is becoming less stable — often visible before any individual shift shows a quality reject or a Cpk breach.
"
We had a Cpk of 0.94 on green pellet diameter for the entire Q3 and nobody flagged it because the report came out six weeks after the quarter ended. With iFactory's real-time Cpk view, we caught a Cpk drop on moisture below 1.0 during a shift transition — traced it to a regrind circuit speed change that nobody had logged — and corrected it the same hour. Our monthly energy report that quarter was the best we had seen in two years. The specific energy per tonne dropped by 7.3%.
Why This Matters More in 2026 Than It Did Five Years Ago
The business case for autonomous SPC in pelletizing has shifted from efficiency improvement to operational necessity. Energy costs in iron ore processing are rising. Ore grades are declining, which means more variation in the concentrate reaching the pelletizing plant. Customer specifications for pellet quality — size distribution, crush strength, reducibility — are tightening as direct reduction steelmaking grows. And regulatory reporting requirements for energy consumption and emissions are creating audit obligations that manual shift logs cannot satisfy reliably.
At the same time, the workforce context has changed. Experienced pelletizing operators who learned process behaviour from years of floor observation are retiring. The replacement generation has technical training but less accumulated pattern recognition. Autonomous SPC is not a replacement for operator judgment — it is the system that gives newer operators the process intelligence that experienced operators carry in their heads. It tells them what the combination of moisture, disc speed, and particle size means for the oversize rate before the screen confirms it. It tells them when the furnace temperature profile is starting to drift toward a crush strength failure before the test returns. It closes the gap between experience and data.
Rising Energy Costs
With pelletization consuming 101.5 kWh per tonne of product, a 4–10% energy reduction from autonomous SPC delivers measurable cost impact at any production volume. At a 4 Mtpa plant, 7% energy saving translates to multi-million dollar annual operating cost reduction.
Tighter Customer Specifications
Direct reduction pellet buyers are specifying tighter size windows, higher minimum crush strengths, and lower fines content than blast furnace pellet specs required. Holding tighter specs consistently requires process control that adapts to variation in real time — not SPC limits set for average conditions.
Audit and Reporting Obligations
ISO 9001, ISO 50001 energy management, and customer audit requirements all demand documented process control records. Autonomous SPC generates these automatically — timestamped, searchable, and exportable — without adding any documentation burden to the shift supervisor or the operator.
Conclusion
The energy loss in pelletizing that autonomous SPC addresses is not the dramatic kind that shows up as a process shutdown or a batch rejection. It is the quiet, compounding kind — the firing zone running 15°C above optimal because green pellet moisture shifted an hour ago and nobody adjusted the setpoint, the oversize recycle rate climbing because the regrind circuit changed and the balling disc was not corrected in time, the binder addition running 0.2% above optimal because operators add a safety buffer when they cannot trust the process signals they are seeing. Each deviation is small. Across a 4 Mtpa plant running 8,000 hours a year, it adds up to millions in energy cost and scrap that appears on the monthly report with no clear cause assigned.
Autonomous SPC gives supervisors the system that connects the upstream parameter deviation to the downstream energy consequence — in real time, before the accumulation happens. Self-tuning limits that follow the process rather than fighting it. Real-time Cpk that shows process capability during the shift, not six weeks after it. Predictive alerts with ranked causes that tell operators what to adjust and in which direction. And automatic shift documentation that meets audit requirements without adding a single minute of manual record-keeping to the supervisor's shift.
iFactory's autonomous SPC platform is purpose-built for pelletizing supervisors — with the control intelligence to cut specific energy consumption 4–10%, the real-time Cpk visibility to manage process capability during the shift, and the audit trail to satisfy reporting requirements automatically. Book a Demo to see autonomous SPC running on a pelletizing use case matched to your production profile, or talk to an expert about what a deployment looks like for your plant configuration.
Frequently Asked Questions
The adaptive recalibration begins immediately when the ore blend transition is logged — either by the operator manually or automatically from a DCS event tag. The system uses a configurable sliding data window, typically 30 to 90 minutes of incoming process data, to build the new baseline for the incoming ore. During this transition window, the dashboard flags the active calibration period so the supervisor has context for any process behaviour — eliminating the false alarm pattern that static SPC generates at every ore change. For plants with frequent blend transitions, the window length can be shortened to improve responsiveness, with a small trade-off in baseline stability. Most pelletizing plants complete the adaptive recalibration within one hour of a blend transition. Talk to an expert about calibration window settings for your blend transition frequency.
The standard induration energy monitoring configuration covers firing zone temperature profiles across all furnace zones, drying air volume and temperature, green pellet moisture and size distribution entering the furnace, combustion air-to-fuel ratios, and exhaust gas temperature and composition. For straight-grate configurations, bed thickness and trolley speed are added. For grate-kiln configurations, kiln inlet and discharge temperatures and burner fuel flow are included. The system is configured to your specific furnace type and control system during the deployment assessment — iFactory does not use a generic template. Variables are mapped to energy impact weighting during configuration, so the predictive alert model knows which deviations carry the highest energy cost. Book a Demo to see the variable mapping process demonstrated for your induration configuration.
The iFactory supervisor dashboard is fully responsive and accessible via standard web browser on any mobile device or tablet connected to the plant network. Supervisors making rounds can see the live process stability score, current Cpk values for key quality characteristics, and any active alerts from the floor — without returning to the control room. Alert notifications can also be configured to send to a supervisor's mobile device when a predictive alert fires or when a Cpk value drops below the configured threshold. Role-based access ensures supervisors see the aggregated process view while operators see the detailed parameter-level dashboard relevant to their station. Talk to an expert about dashboard access configuration for shift supervisor workflows.
iFactory supports both. The highest-value deployment connects directly to your DCS or SCADA historian — pulling process variable data at the sensor polling rate, typically every 1 to 5 seconds, which enables real-time adaptive limit calculation and predictive alerts at the timescale pelletizing requires. For plants where direct historian integration requires a longer IT procurement process, the system operates in an operator-entry mode where key measurements — moisture, disc speed, binder dose, oversize rate, furnace temperatures — are entered manually at each measurement cycle. The autonomous model runs against the manually entered data, providing the same adaptive limit and Cpk visibility at the measurement frequency the operator uses. Most modern pelletizing plants with ABB, Siemens, or Rockwell DCS have OPC-UA or REST API connectivity available that makes historian integration straightforward. Talk to an expert about the integration pathway for your control system.
Every alert, operator action, limit change, recipe transition, and Cpk calculation is timestamped and stored in the iFactory audit log with full traceability to the process data that triggered it. The shift quality report generated at the end of each shift includes specific energy per tonne for the shift, Cpk trend for each monitored quality characteristic, a complete log of all alerts and corrective actions, and the active recipe and ore blend throughout the shift. These records are exportable in standard formats and are designed to satisfy the documented evidence requirements of ISO 50001 energy management systems and ISO 9001 quality management audits. For customers with existing quality management systems, iFactory can align the record structure to the document formats already in use. Book a Demo to see the audit record output for a pelletizing use case.
Your Shift Energy Report Tells You What Already Happened. Autonomous SPC Tells You What Is About to Happen — While There Is Still Time to Act.
iFactory's autonomous SPC platform for pelletizing supervisors — self-tuning control limits, real-time Cpk tracking, predictive energy alerts with ranked causes, and audit-ready shift documentation. Request a walkthrough on your process data.