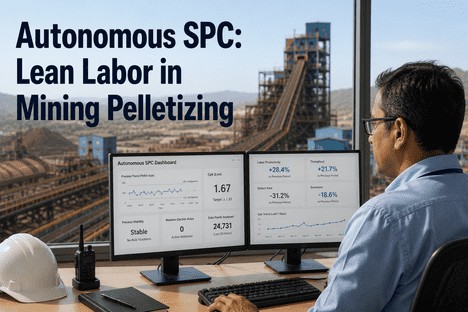
Digital manufacturing directors in mining pelletizing face a productivity paradox: the same SPC systems designed to protect quality consume disproportionate engineering and operator labor to maintain, validate, and interpret. Static control charts require manual recalibration after every ore blend change, recipe transition, or binder batch rotation. Capability studies demand dedicated analyst hours. Western Electric rule violations must be reviewed individually to distinguish real signals from noise. The cumulative labor burden of keeping a static SPC system current across a 6 Mtpa pelletizing operation typically consumes three to five engineering shifts per week — labor that should be directed toward process improvement, not chart maintenance. Autonomous SPC eliminates this structural inefficiency by replacing manual limit maintenance with self-tuning control charts that continuously recalibrate, run all eight Western Electric rules in real time, and surface only the alerts that require human judgment.
Autonomous SPC · Self-Tuning Limits · Western Electric Rules · Continuous Cpk
Digital Manufacturing Directors Are Freeing 20–35% of Engineering Labor by Replacing Static Control Charts With Autonomous SPC. Here Is How.
iFactory's autonomous SPC platform gives digital directors self-tuning control charts that eliminate manual limit recalibration, automate Western Electric rule detection, and deliver continuous Cpk tracking — freeing quality engineers to improve processes instead of maintaining charts.
Engineering labor productivity gain when autonomous SPC replaces static control chart maintenance — documented across pelletizing, flotation, and sinter operations
3–5
Engineering shifts per week reclaimed from manual limit recalculations, capability studies, and false-alarm review in a typical 6 Mtpa pellet plant
100%
Western Electric rules executed continuously across every parameter — no sampling intervals, no manual chart review cycles, no missed rule violations
0
Manual capability studies required after autonomous SPC deployment — Cpk, Cp, Pp, and Ppk update continuously without analyst intervention
The Labor Productivity Problem in Pelletizing Quality Management
Every pelletizing quality programme allocates engineering labor across three functions: maintaining the SPC system, investigating out-of-control signals, and driving process improvement. The first function is supposed to be a means to the second and third. In practice, manual SPC maintenance consumes so much capacity that investigation and improvement are chronically under-resourced. A typical pattern across grate-kiln and straight-grate operations shows that 60 to 70% of quality engineering time goes to activities that autonomous SPC can execute without human intervention — leaving only 30 to 40% for the work that actually moves capability and reduces defect rates.
L
Manual Limit Recalculation
Every ore blend change, recipe transition, or binder batch rotation requires an engineer to recalculate control limits manually — pulling historical data, computing new UCL and LCL values, updating the SPC system, and documenting the change for ISO 9001 compliance. In a plant producing multiple grades across several ore blends, this generates 8 to 12 limit recalculation events per week, each consuming 45 to 90 minutes of engineering time.
C
Capability Study Overhead
Cpk and Cp reports are typically generated shift-end or week-end — after the production data is complete. Generating a single capability study across three quality characteristics for one grade consumes 30 to 60 minutes of analyst time. With multiple grades, blends, and quality characteristics tracked simultaneously, capability reporting alone can consume a full shift per week. These studies are snapshots, not continuous signals.
A
Alert Review Fatigue
Each Western Electric rule violation requires a quality engineer to review the control chart, assess context, and determine whether the signal indicates a genuine process shift or a false alarm. When 60 to 80% of alerts during ore transitions are false positives triggered by outdated static limits, the review burden becomes unsustainable. Engineers either triage by ignoring low-severity alerts (missing real signals) or investigate every alert (consuming hours per shift).
D
Documentation Drift
ISO 9001 Clause 7.5 requires documented rationale for every limit change. In manual SPC systems, the documentation lags behind the change — or is completed retrospectively before audits. Engineers spend additional hours reconstructing the statistical basis for limit adjustments that were made weeks earlier. The audit trail exists, but the labor cost of maintaining it is rarely measured.
Static SPC vs. Autonomous SPC: Where the Productivity Multiplier Comes From
The labor productivity differential between static and autonomous SPC is not marginal — it is structural. Static SPC treats every process change as a manual intervention event. Autonomous SPC treats process change as data the system uses to recalibrate itself. The following comparison illustrates the difference across the four highest-labor-consumption activities in pelletizing quality management.
Quality Management Activity
Static SPC: Weekly Engineering Hours
Autonomous SPC: Weekly Engineering Hours
Limit recalculation after ore blend changes
8–10 hours
0 hours
Capability study generation (Cpk, Cp, Pp, Ppk)
4–6 hours
0 hours
Western Electric rule violation review
6–10 hours
1–2 hours
ISO 9001 limit change documentation
3–5 hours
0 hours
Total Engineering Labor Per Week
21–31 hours
1–2 hours
The net effect: 20 to 35 engineering hours per week are redirected from chart maintenance to process improvement, root cause analysis, and protocol optimization. In a 6 Mtpa pelletizing operation, this translates to 1.0 to 1.7 additional engineering FTE equivalents — recovered without hiring, redeployed without retraining, and applied to work that directly reduces defect rates and improves capability.
When Your SPC System Recalibrates Itself, Your Engineers Can Focus on What Actually Improves Quality — Not on Maintaining Charts That Should Have Updated Themselves.
iFactory's autonomous SPC platform eliminates the maintenance burden of static control charts — self-tuning limits, automated Western Electric rule execution, and continuous Cpk tracking that runs without analyst intervention.
Three Capabilities That Define Autonomous SPC for Pelletizing
Autonomous SPC is not a single feature — it is a platform capability that replaces three distinct manual workflows with automated systems. Each capability recovers engineering labor directly and enables quality management work that static SPC cannot support.
Capability 01
Self-Tuning Control Limits
Control limits calculate themselves continuously against a rolling statistical baseline of current process data. When an ore blend changes, a recipe transitions, or a binder batch registers, the system detects the regime shift and recalibrates limits to the new normal automatically — without an engineer pulling historical data, computing new UCL and LCL values, or updating charts manually.
Labor recovered: 8–10 hours per week in limit maintenance
Capability 02
Automated Western Electric Rules
All eight Western Electric rules execute continuously across every monitored parameter — one point beyond 3-sigma, two of three beyond 2-sigma, four of five beyond 1-sigma, eight consecutive points on one side, and the four extended Nelson rules. Every violation is logged with the process context at the time of the event, and only confirmed violations are surfaced for engineer review.
Labor recovered: 6–10 hours per week in alert review
Capability 03
Continuous Cpk With Audit Documentation
Cpk, Cp, Pp, and Ppk update with every new data point — not shift-end, not week-end — and are displayed as live trend lines across product grade, ore blend, and process zone. Every limit recalculation, rule violation, and capability shift is logged automatically with timestamp and context for ISO 9001 Clause 7.5 documentation. Audit packages export in one click.
Labor recovered: 7–11 hours per week in reports and documentation
Capability 04
Multi-Grade and Multi-Blend Segmentation
Each pellet grade registers as a separate specification profile with its own size range, crush strength target, and chemical composition limits. When the production line transitions between blast furnace and direct reduction grades, the active profile switches automatically and limits transition to the new baseline. Historical Cpk data is segmented by grade for direct comparison.
Labor recovered: Eliminates manual data sorting across grade transitions
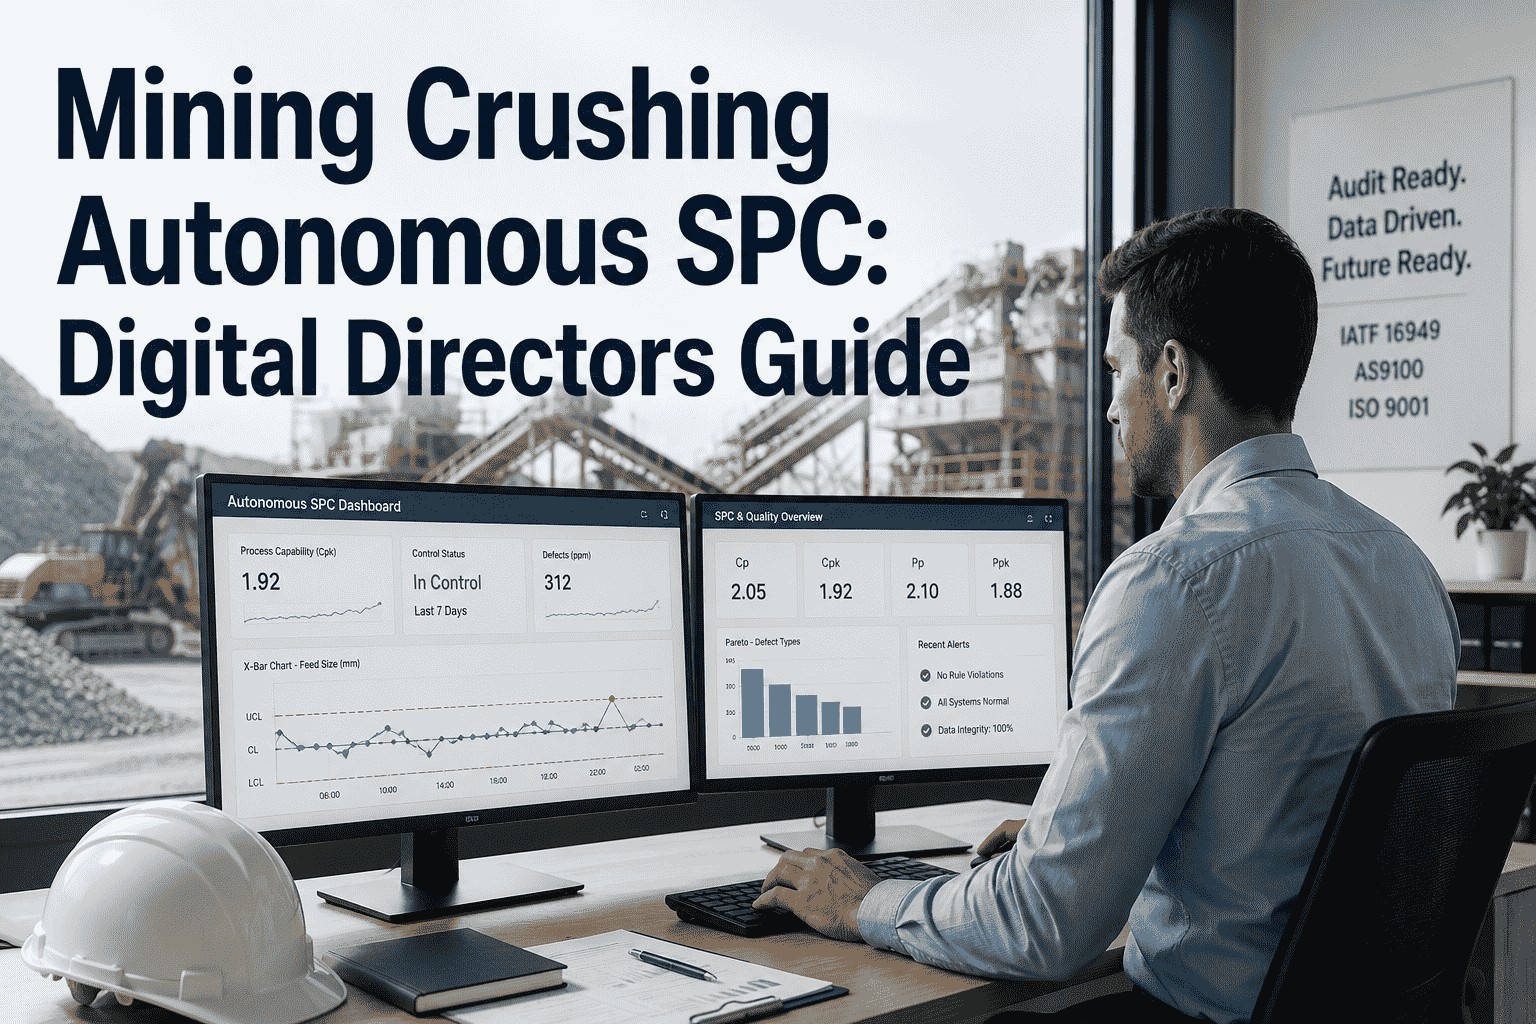
The Digital Manufacturing Director's Quality Dashboard
The autonomous SPC dashboard is designed for the digital manufacturing director who needs to know — at any moment — whether the quality programme is gaining or losing ground on labor productivity, defect reduction, and process capability. It surfaces the five metrics that matter most to director-level decision-making, each updated continuously and trended over time.
Director View 01
Labor Time Recovered — Live and Trended
A running total of engineering hours recovered by autonomous SPC, displayed as a weekly trend line against the baseline manual labor estimate. The director sees the productivity gain in hours, FTE equivalents, and cost terms. A shift from static to autonomous SPC typically shows 20 to 35 hours recovered per week within the first 30 days.
Director action: Validate labor reallocation to process improvement projects.
Director View 02
Cpk Trend by Grade — Live and Forecast
Cpk displayed as a continuous trend line for each product grade and quality characteristic, with current value, trajectory arrow, and projected Cpk at current drift rate. Falling Cpk triggers an alert before it crosses the 1.33 warning threshold. Improving Cpk validates that deployed process changes are working.
Director action: Falling Cpk prompts process review before capability is lost.
Director View 03
Alert Credibility Score
The ratio of confirmed rule violations to total alerts generated, displayed as a percentage. Static SPC systems typically score 20 to 40% — most alerts are false positives. Autonomous SPC scores 85 to 95% because self-tuning limits eliminate regime-change false alarms. The director sees alert system credibility as a measurable KPI.
Director action: Low credibility score triggers investigation into limit configuration.
Director View 04
Defect Rate by Grade and Process Zone
Defect frequency displayed by category, grade, and process zone with rolling 30-day trend. The director sees whether defect rates are declining, holding, or increasing in each area — and can correlate changes with process interventions or grade transitions logged in the same view.
Director action: Zone-level trend escalation to engineering for systemic protocol change.
Director View 05
Audit Readiness Status
A single view showing the completeness of ISO 9001 documentation across all active grades, blends, and process zones — limit change logs, capability histories, CAPA records, and defect event logs. Gaps are flagged with expected resolution time. Full audit package export is available in one click.
Director action: Close documentation gaps before audit notice arrives.
Director View 06
Economic Impact — Defect Cost Avoidance
A running calculation of cost avoided through defect prevention, calculated from the defect rate reduction since autonomous SPC deployment multiplied by the cost per defect category — oversize recycle, crush strength rejection, and composition nonconformance. The director sees the ROI of the autonomous SPC deployment in direct cost terms.
Director action: Use cost avoidance data to build the case for additional quality investment.
We deployed autonomous SPC across our grate-kiln pellet plant expecting quality improvements. What surprised us was the labor productivity gain. Our quality engineers were spending an average of 24 hours per week on SPC maintenance — limit recalculations, capability reports, and false alarm review. Within six weeks of autonomous SPC deployment, that dropped to under 2 hours. We redeployed three engineers to root cause analysis and protocol optimization. Crush strength defects dropped 42% in the following quarter, and we did not hire a single additional person to achieve it.
— Digital Manufacturing Director, Iron Ore Pelletizing Operation — Straight-Grate System, 8 Mtpa Annual Capacity
The Economic Case for Autonomous SPC
The direct economic return of autonomous SPC is driven by two factors: the labor productivity gain from eliminating manual SPC maintenance and the defect cost avoidance from improved detection effectiveness. Each factor independently justifies the investment. Together, they produce a return that is visible within the first quarter of deployment.
Labor Recovery
1.0–1.7
Additional engineering FTE equivalents recovered per 6 Mtpa plant — redeployed to defect reduction and process optimization work
Defect Reduction
30–70%
Defect rate reduction documented in pelletizing operations that moved from static to adaptive quality management with autonomous SPC
False Alarm Reduction
50–70%
Reduction in false alerts when ML-driven control limits replace static limits — restoring operator and engineer alert credibility
Yield Improvement
Up to 15%
Overall yield increase documented when AI-powered SPC predicts yield issues up to 24 hours ahead, enabling pre-defect corrective action
Conclusion
Labor productivity in pelletizing quality management is not determined by how hard engineers work — it is determined by how much of their work the SPC system can execute without them. Static SPC systems assign engineers the role of chart maintenance technicians, spending 60 to 70% of available quality engineering labor on activities that add no direct defect reduction value. Autonomous SPC reassigns that labor to what actually drives quality improvement: root cause analysis, protocol optimization, and systemic defect elimination.
The 20 to 35% engineering labor productivity gain is not a theoretical ceiling — it is the documented outcome range from pelletizing operations that deployed self-tuning control limits, automated Western Electric rule execution, and continuous Cpk tracking. The digital manufacturing directors achieving the upper end of that range are the ones who recognized that the SPC system is not a quality tool — it is a labor allocation decision. Every hour the system can manage independently is an hour the engineer can spend on work that reduces defect rates, improves capability, and strengthens the compliance position.
iFactory's autonomous SPC platform is built for digital manufacturing directors who need to demonstrate measurable labor productivity improvement alongside quality outcomes. Book a Demo to see the autonomous SPC dashboard configured for your pellet grade portfolio and ore blend profile, or talk to an expert about a free labor productivity assessment for your pelletizing quality programme.
Frequently Asked Questions
The autonomous SPC system detects an ore blend change through multiple signals — the operator blend declaration, the change in particle size distribution from upstream sensors, the shift in moisture response at the balling disc, and the adjustment in binder dosage rate. When a blend change is detected, the system enters a configurable transition window during which control limits move progressively from the old baseline to the new baseline using a rolling data window. During this transition, the system suspends Rule 1 (single point beyond 3-sigma) for parameters known to shift with blend changes while continuing to monitor Rule 4 (eight consecutive points on one side) and Rule 5 (six-point trend) as early indicators of instability within the new regime. The quality leader configures the transition window length — typically 30 to 90 minutes depending on the parameter response time — and receives a notification when the new baseline is established. This eliminates the burst of false alarms that occurs when static SPC systems encounter the same blend transition with limits calibrated for the previous ore type. Talk to an expert about configuring transition windows for your ore blend profile.
The deployment timeline depends primarily on data connectivity. If the process historian and LIMS are already connected and accessible, the autonomous SPC platform can be configured for a single product grade and process zone within two to three weeks. The engineering resource requirement during deployment is approximately one quality engineer for the initial configuration — defining the monitored parameters, product grade profiles, and transition windows — and one IT resource for the data connection setup. After the initial configuration, the system runs in parallel with the existing SPC programme for a validation period of two to four weeks, during which the quality team reviews autonomous SPC alerts against their standard process to confirm accuracy. Full deployment across all grades, blends, and process zones typically completes within eight to twelve weeks. The engineering time required during deployment is a fraction of the engineering time recovered after deployment — most operations recover their deployment investment within the first six to eight weeks of operation. Book a Demo to see a deployment timeline tailored to your plant configuration.
Yes. The iFactory autonomous SPC platform is designed to connect to existing plant data infrastructure — process historians (such as OSIsoft PI, Aspen InfoPlus.21, or Siemens SIMATIC IT), LIMS platforms, and control system data streams — through standard integration protocols including OPC-UA, REST APIs, ODBC, and MQTT. The platform does not require replacement of existing data systems or control infrastructure. It reads process variable data from the historian and quality test results from the LIMS, performs the SPC calculation and Western Electric rule analysis autonomously, and presents the output through the quality dashboard. The data connection configuration is typically completed in one to two weeks by the plant IT or automation team with remote support from iFactory. For plants with limited data infrastructure, the platform can also ingest data directly from control system tag exports or structured file uploads as an interim integration path. Talk to an expert to discuss integration with your specific plant data architecture.
Free Your Engineers From Chart Maintenance. Deploy Autonomous SPC and Recover 20–35% of Quality Engineering Labor in Your Pelletizing Operation.
iFactory's autonomous SPC platform for mining pelletizing digital manufacturing directors — self-tuning control limits that eliminate manual recalibration, automated Western Electric rules across all eight tests, continuous Cpk tracking without analyst intervention, and ISO 9001-aligned audit documentation generated automatically. Schedule a free labor productivity assessment for your pelletizing quality programme.