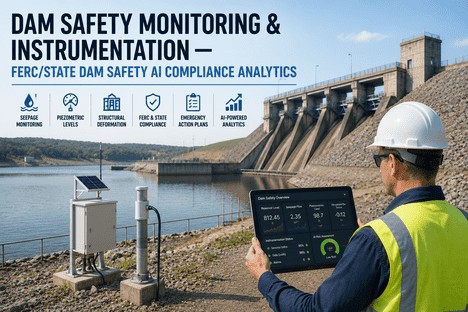
Dam Safety Monitoring & Instrumentation — FERC/State Dam Safety AI Compliance Analytics
By Grace on June 23, 2026
The United States has more than 92,000 dams, and the average age of those dams is 65 years. Nearly 17,000 of them are classified as high-hazard potential — meaning that if one fails, loss of life is the likely result. More than 2,500 of those high-hazard dams are already in poor or unsatisfactory condition. The American Society of Civil Engineers gives the nation's dams a D+ on its infrastructure report card, and the estimated cost to rehabilitate non-federal dams alone has climbed past $165 billion. These numbers are not a forecast of a future problem. They describe the present condition of the infrastructure that millions of people live and work downstream of every day. The gap between the monitoring data that dam safety programmes generate and the decisions that data could drive is not a technology problem. It is an instrumentation, documentation, and leadership problem. Dam safety directors who have invested in monitoring sensors and data platforms report that the instruments alone change nothing. What changes outcomes is the operational discipline around the instrumentation programme: whether readings are taken on schedule, whether trends are reviewed before they become anomalies, whether findings are documented with corrective action dates, and whether leadership holds the operation accountable to compliance metrics rather than assumptions. Building a data-driven dam safety culture is not a sensor installation project. It is a sustained compliance and leadership programme with defined stages, deliberate documentation discipline, and a monitoring framework that connects daily instrumentation data to strategic safety outcomes. This guide is written for dam safety directors, operations directors at hydroelectric facilities, and state dam safety engineers at the point of making that transition.
17,000
High-hazard potential dams in the US where failure could result in loss of life — yet risk reduction depends on the quality of daily monitoring data
$165B
Estimated rehabilitation cost for non-federal US dams — proactive monitoring is the most cost-effective risk reduction strategy available to dam owners
2,500+
High-hazard dams already rated in poor or unsatisfactory condition — every undocumented reading on these structures increases the risk profile
65 Yrs
Average age of US dams — most were designed for rainfall patterns that no longer reflect today's climate, making real-time monitoring essential
Dam Safety · FERC Compliance · Instrumentation · Monitoring · AI Analytics
Sensors Collect the Data. Your Culture Makes It Actionable. iFactory Connects Both.
iFactory's monitoring and compliance platform gives dam safety directors the infrastructure to track instrumentation readings, automate trend alerts, manage Part 12 findings, and build a documentation culture that passes every inspection with audit-ready evidence.
Why Most Dam Monitoring Programmes Underdeliver — and What the Research Reveals
A 2025 study published in Water Resources Management analysed 53 operational dam failures in the 21st century and found that poor management, design and construction flaws, and meteorological factors driven by climate change were the leading contributors. Human-related factors — not equipment failures — were the predominant cause. The pattern is consistent across dam safety programmes that invest in instrumentation without investing equally in the documentation culture and operational discipline needed to use the data effectively. The instruments go unread, the trend data goes unreviewed, and the emergency action plan goes untested until the next Part 12 inspection reveals the gaps. Three root causes appear in nearly every case.
01
Instruments Were Installed. The Reading Discipline Was Not.
Piezometers, weirs, inclinometers, and crack gauges require consistent reading schedules, calibrated data entry, and documented trends. Without explicit workflow protocols tied to each instrument type, readings become irregular, data quality degrades, and the trend analysis that should detect anomalies before they become emergencies never materialises. The instrumentation network becomes an installed asset rather than an operational intelligence system.
02
Compliance Data Was Collected Without Connecting to Decisions.
Many dam safety programmes begin by collecting every available instrument reading — seepage flow, piezometric level, rainfall, deformation — without identifying which data points will change which operational decisions and who is responsible for acting on each one. A reading that does not connect to a named action level and a named decision-maker is compliance paperwork, not risk management. The result is binders of data and no change in safety posture.
03
Leadership Did Not Model the Monitoring Culture It Was Asking Teams to Follow.
If dam safety directors continue to review instrumentation reports from memory and experience rather than pulling up trend dashboards during operations reviews, they signal to every engineer and technician that the monitoring system is a regulatory requirement, not a safety decision tool. Culture in dam safety is set from the top. If leaders do not demonstrate data-based reasoning in their own reviews, the organisation reads that signal correctly and the instrumentation programme is maintained for compliance rather than operated for insight.
FERC Part 12 Compliance — The Two-Tier Inspection Framework Every Dam Operator Must Know
Every FERC-licensed hydropower dam in the United States operates under Part 12 of the Commission's regulations. The 2022 final rule (Order No. 880) restructured Part 12 inspections into two alternating tiers on a 10-year cycle. Understanding what each tier requires — and how your ongoing instrumentation documentation feeds into both — is the starting point for building a compliant monitoring programme. A missed piezometer reading, an undocumented seepage observation, or a Part 12 finding without a tracked corrective action date can turn a routine inspection into a license condition or a directed engineering study that halts generation.
FERC Part 12 Two-Tier Inspection Structure — Alternating 10-Year Cycle
Periodic Inspection (PI)
Every 5 Years — Alternating
Independent consultant-led field inspection of all project structures — dam, spillway, powerhouse, and appurtenances
Evaluates current physical condition, reviews surveillance and monitoring data, checks compliance with prior cycle directives
Seepage and instrumentation review, prior finding remediation verification, O and M Manual compliance check
Alternating Cycle: 2024 PI — 2029 CA — 2034 PI
Comprehensive Assessment (CA)
Every 10 Years — Deeper Scope
Includes Potential Failure Mode Analysis (PFMA) and Semi-Quantitative Risk Assessment (SQRA)
In-depth review of instrumentation trends, seismic hazard, hydrologic loading, and spillway adequacy
Requires broader independent consultant team with multi-discipline expertise and 60-day advance IC approval submittal
60-Day Advance IC Approval Submittal Required
Instrumentation Data · Trend Alerts · Audit-Ready · Compliance
A Monitoring Programme That Only Produces Binders at Inspection Time Is Not a Safety Programme. iFactory Makes Your Data Audit-Ready Every Day.
iFactory documents every instrument reading, trend deviation, and corrective action in a structured digital trail that satisfies PI and CA inspection requirements with evidence that speaks for itself.
The Dam Instrumentation Maturity Model — Four Stages Every Monitoring Programme Passes Through
Understanding where your monitoring programme sits on the instrumentation maturity curve is the starting point for any compliance improvement strategy. Most dam safety operations are at Stage 1 or Stage 2. The programmes that consistently pass Part 12 inspections without findings and demonstrate measurable risk reduction are operating at Stage 3 or Stage 4. The difference is not the instruments they have installed — it is the documentation discipline and data review culture they have built around them.
Dam Instrumentation Maturity Model — Where Does Your Monitoring Programme Stand?
Stage
Monitoring Behaviour
Data Characteristics
Leadership Priority
Stage 1
Reactive
Instruments installed but read irregularly. Seepage and piezometric data collected manually with paper logs. Anomalies detected only after visible signs of distress appear.
Paper logbooks, disconnected spreadsheets, and inspection reports filed without trend analysis. No centralised data repository. No action level tracking.
Get all instrument readings into a single tracked system. Any CMMS or monitoring platform is a step forward from this stage.
Stage 2
Documentation
Readings taken on schedule and recorded in a central system. Data is reviewed monthly or quarterly. Part 12 inspection evidence is compiled reactively before each visit.
Centralised reading records, basic trend charts, PM schedule for instrument calibration. Data exists but is reviewed retrospectively rather than in real time.
Move from periodic data review to daily or weekly dashboard use. Establish action level alerts for every critical instrument.
Stage 3
Diagnostic
Teams understand not just what the readings show but why they are changing. Trend analytics identify developing failure modes. Maintenance actions are triggered by instrument data rather than calendar cycles.
Real-time dashboards, threshold alerts, trend visualisation across all instrument types. Data quality is actively managed with automated flags for missed or out-of-range readings.
Build team data literacy in instrumentation analysis. Establish weekly data review rituals. Reward documentation accuracy in performance conversations.
Stage 4
Predictive
Maintenance interventions are scheduled before anomaly thresholds are breached. Instrument trends feed into PFMA updates. Risk assessments are informed by continuous monitoring data rather than point-in-time observations.
AI-driven anomaly detection, automated trend analysis, integrated hydrologic and seismic data streams. Monitoring data is embedded in every safety review and planning cycle.
Integrate monitoring analytics into strategic risk management. Use data for board-level safety reporting. Benchmark instrumentation programme against industry peers.
Critical Monitoring Metrics — What to Track at Each Level of Your Dam Safety Programme
The following monitoring taxonomy is grounded in the decision architecture principle: every instrument reading connects to an action level, a decision-maker, and a response protocol. iFactory's monitoring platform tracks all of these in real time with configurable threshold alerts and trend visualisations at every level of the organisation.
Field Technician
Piezometer reading schedule adherence — daily, weekly, or monthly readings completed vs. missed per instrument
Instrument calibration status — next calibration date by device, with automatic notification at threshold
Field observation documentation — seepage, cracking, or displacement notes linked to the asset record at point of inspection
Supervisor / Engineer
Seepage flow trend — weekly moving average vs. action level threshold, with automatic alert at 80% threshold
Piezometric level deviation — individual instrument readings vs. historical seasonal baseline by monitoring point
Instrument downtime — percentage of scheduled readings missed across the monitoring network in the reporting period
Compliance Manager
Part 12 finding remediation status — open, in-progress, and closed findings with tracked corrective action dates and evidence
Instrumentation trend report completeness — percentage of instruments with current trend analysis submitted per review cycle
EAP readiness score — drill completion rate, updated inundation maps, and training records current within review period
Director Level
Monitoring network health score — percentage of instruments reading within expected range, by dam and by instrument category
Finding closure velocity — average days from Part 12 finding identification to corrective action completion, trended quarterly
Risk reduction investment allocation — capital deployed vs. risk reduction achieved across the dam portfolio year to date
The Compliance Playbook — Five Actions That Build an Audit-Ready Dam Safety Culture
Culture in dam safety does not change through sensor installation projects or documentation policy announcements. It changes through consistent leadership behaviour, visible accountability mechanisms, and the gradual replacement of assumption-based safety reviews with data-based ones. These five actions distinguish dam safety programmes that consistently pass Part 12 inspections from those that produce last-minute evidence packages before every review cycle.
Action 01
Map Every Instrument Reading to an Action Level and a Decision-Maker
Foundation Step
Before configuring any monitoring dashboard, map every instrument in your network to a defined action level — the reading threshold at which a specific response is triggered — and a named individual responsible for executing that response. A piezometer reading at 90% of the action level should automatically notify the engineer assigned to evaluate the trend. A seepage flow increase of 15% week-over-week should generate a work order for field inspection. This decision architecture, built before the dashboard is configured, is what separates monitoring programmes that drive safety actions from those that generate filed reports. Every instrument reading should trace to a decision, a decision-maker, and a response timeline.
Action 02
Start Every Safety Review with the Live Monitoring Dashboard
Leadership Behaviour
The most powerful signal a dam safety director sends about the importance of monitoring data is how they open every review meeting. If Part 12 preparation meetings, monthly instrumentation reviews, and quarterly risk assessments begin with a live dashboard review rather than a verbal briefing, the message to every engineer and technician is unambiguous: instrument data is how we measure safety posture here. Establish a standing protocol where the first five minutes of any safety review involves opening iFactory's monitoring dashboard and reviewing the previous period's instrument readings against action level thresholds — seepage trends, piezometric deviations, finding closure rates, and instrument network health. Leaders who do this consistently see their teams begin preparing data before they arrive at meetings, rather than constructing post-hoc explanations after action levels have already been breached.
Action 03
Build Documentation Discipline at the Instrument Reading Level
Team Capability
The quality of every Part 12 inspection outcome is entirely dependent on the quality of instrument reading documentation at the point of collection. A technician who records a piezometer reading without noting the time, weather conditions, and instrument ID creates a data gap that no dashboard can recover. The solution is not a compliance checklist — it is understanding and motivation. Technicians who understand why accurate documentation matters — this reading is what triggers the next action level review or this trend is what tells the engineer there is a developing seepage path — document more accurately than those who see data entry as administrative overhead. Invest in role-specific training sessions that show field teams how their data inputs connect to the safety decisions the organisation makes. This is one of the highest-ROI activities in any dam safety culture programme.
Action 04
Treat Part 12 Finding Remediation as a Tracked Operational Process
Compliance Process
A Part 12 finding that is documented in a PDF and emailed to the engineering team is not a tracked corrective action. Findings must be entered as structured work items with assigned owners, corrective action descriptions, evidence upload requirements, and target closure dates — all linked to the specific instrument, structure, or inspection observation that generated them. iFactory's platform supports finding-to-closure tracking with automatic escalation when target dates approach without evidence upload. The organisations that close Part 12 findings fastest are not the ones with the most engineering resources — they are the ones with the most structured remediation workflows. Every open finding should be visible on a dashboard, not buried in an email thread.
Action 05
Use the Annual Owner's Dam Safety Programme Review to Evolve Your Monitoring Framework
Continuous Improvement
FERC Part 12 Subpart F requires licensees to review the Owner's Dam Safety Programme at least annually and submit findings, corrective measures, and revisions to the Regional Engineer. This annual review is the natural moment to evaluate whether your monitoring instrumentation framework is still fit for purpose. Which instruments are producing data that drives decisions and which are being read for compliance only? Are there developing failure modes identified in the latest PFMA that the current monitoring network does not address? Are there sensors that have not triggered an alert in three years that could be redeployed to higher-risk locations? Organisations that treat the annual ODSP review as a genuine monitoring strategy evaluation rather than a documentation exercise consistently maintain higher network health scores and lower finding recurrence rates.
"
We had invested over two million dollars in instrumentation — piezometers, weirs, inclinometers, crack gauges — across six dams in our portfolio. At the three-year mark, we had clean instrument records and a compliance binder for every structure. We did not have a safety culture driven by monitoring data. Engineers were still reviewing trends in the month before the Part 12 inspection. What changed the trajectory was when I, as Director of Dam Safety, stopped accepting verbal readiness briefings and started opening the monitoring dashboard at the start of every monthly safety review. Within two months, every engineer was reviewing their instrument trends before the meeting so they could explain the data. Within six months, we caught a developing seepage path at one dam three months before it would have reached the action level threshold — a condition that would have become a formal finding in the next PI if we had not detected it early. The instruments did not change the culture. I changed the culture. The platform made it possible.
— Director of Dam Safety Operations, Regional Hydroelectric Utility — 22 Years Civil and Geotechnical Engineering Leadership
Conclusion
The audit-ready dam safety culture that separates high-performing monitoring programmes from their peers is not built by installing sensors — it is built by leaders who change how they review instrument data, how they manage findings, and how they hold their teams accountable for documentation quality. With nearly 17,000 high-hazard potential dams in the United States, an average dam age of 65 years, and the ASCE infrastructure report card assigning a D+ to the nation's dams, the organisations that close the gap between installed instrumentation and actionable monitoring intelligence will outperform on every safety metric that matters: finding closure velocity, instrument network health, risk reduction investment efficiency, and — most importantly — the prevention of failure conditions before they become emergencies. The platform makes it possible. The leadership makes it real.
iFactory's monitoring and compliance platform gives dam safety directors the operational infrastructure to build an audit-ready culture — with instrument reading schedules, threshold alerting, trend analytics, finding remediation tracking, and the data quality monitoring that keeps your monitoring programme grounded in operational reality. Book a Demo to see how the platform's monitoring framework maps to your instrumentation network and compliance requirements, or talk to an expert to begin building your dam safety monitoring culture with iFactory today.
Frequently Asked Questions
iFactory structures every instrument reading, trend deviation, inspection observation, and corrective action as a traceable record linked to the specific dam asset and monitoring point. For Periodic Inspection preparation, the platform generates a complete evidence package organised by the review categories defined in FERC Part 12.35 — surveillance and monitoring data, prior finding remediation, physical condition documentation, and O and M Manual compliance. For Comprehensive Assessment cycles, iFactory supports PFMA documentation, risk analysis data aggregation, and the multi-discipline consultant evidence package required under Part 12.38. Threshold alerts are configured per instrument action level, so when a reading approaches a defined threshold, the relevant decision-maker is notified in the platform rather than discovering the deviation during the next inspection. Talk to an expert to configure your Part 12 compliance framework and activate instrument-level alerting across your dam portfolio.
The most effective starting point is the decision architecture exercise — before configuring a single instrument dashboard, map every critical instrument to its action level threshold and identify who is responsible for acting when that threshold is approached. Then configure iFactory to surface only the readings and trends that connect to those decisions, visible to the people who make them. Resist the temptation to track every available data point — a focused dashboard of the 15 to 20 most decision-relevant instrument readings drives more behaviour change than a comprehensive report of 80. Run the first director-level monitoring review in the second week after go-live, not at the end of month one. Early use at the leadership level sets the cultural expectation for everyone below it. Book a Demo to walk through the decision architecture process with our dam safety team before your implementation begins.
iFactory surfaces data quality indicators within the monitoring layer — flagging instrument readings recorded outside the scheduled window, readings that exceed expected range without a field note, and instruments with no recorded reading in the expected period. These flags appear in the engineer and director dashboards as data quality alerts rather than being silently excluded from trend analysis. This makes documentation quality a visible operational metric rather than an invisible data management problem. The platform also applies mandatory field requirements at reading entry time, including instrument ID verification, reading timestamp, technician identification, and field condition notes. These fields prevent the most common documentation gaps at the point of entry rather than detecting them retrospectively before an inspection. Talk to an expert to activate data quality monitoring across your dam monitoring network.
Organisations that begin director-level monitoring reviews in the first two weeks of deployment typically see measurable behaviour change in engineering and technician-level documentation discipline within six to eight weeks — with teams independently completing instrument readings on schedule and flagging deviations before they are escalated. Measurable improvements in monitoring metrics — reading schedule adherence rate, trend report submission timeliness, finding closure velocity — typically appear within three to four months when combined with the documentation discipline investment described above. Organisations that delay director-level adoption and use the platform primarily for compliance record-keeping take six to twelve months longer to see the same outcomes. The speed of culture change is more dependent on leadership review intensity than on platform features or configuration. Book a Demo to discuss how your implementation plan can be structured to maximise leadership adoption from day one.
$165 Billion in Dam Repairs Needed. Proactive Monitoring Is the Most Cost-Effective Risk Reduction Strategy Available.
iFactory gives every level of your dam safety organisation the right instrument data, at the right time, in the right format — and gives directors the monitoring infrastructure to build a culture where data-driven safety decisions are the norm, not the exception.