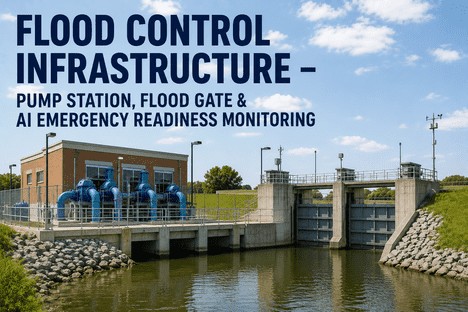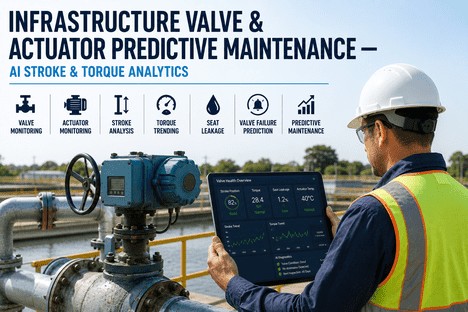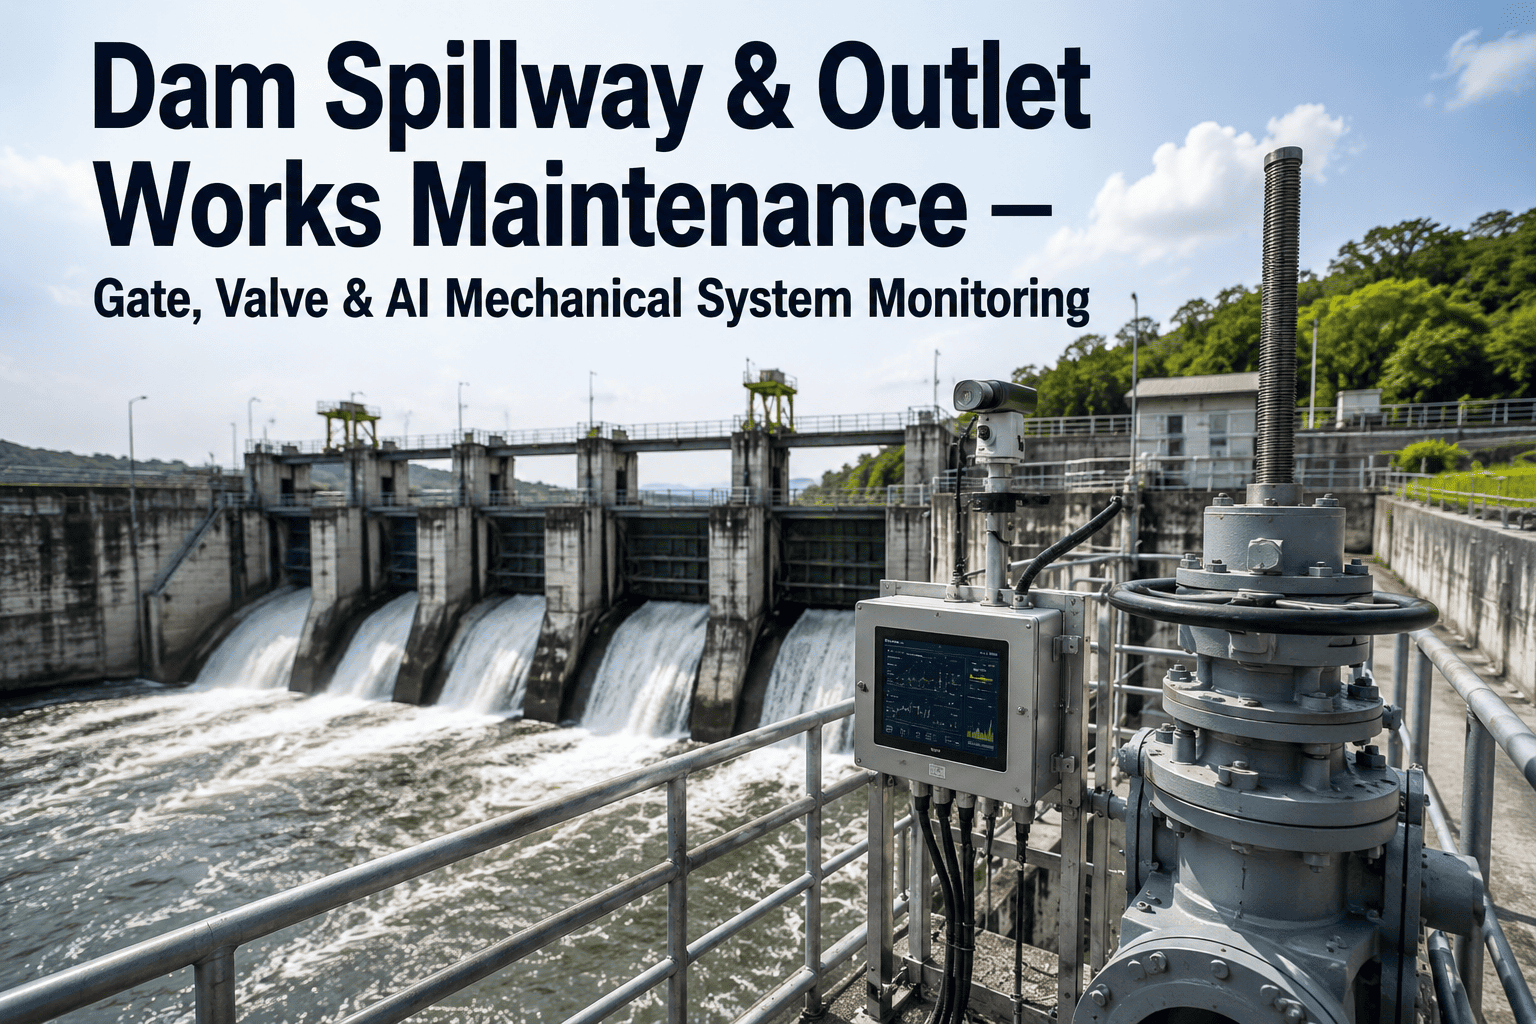
A spillway gate that won't move on command rarely gives warning in the way people expect. The stem doesn't groan for weeks first, the hoist doesn't grind audibly on every cycle, and the actuator doesn't trip an obvious alarm during routine operation. Instead the torque required to move it creeps upward by a few percent per cycle, the position encoder drifts a few millimeters off its expected seat, and none of it is visible to a technician doing a scheduled visual check every few months. Outlet works valves fail the same quiet way — stem corrosion, packing wear, and seat erosion build for months before a valve sticks at partial stroke during the one release cycle when full function actually matters. See how iFactory turns gate hoist, valve actuator, and control system data into an early warning system for outlet works maintenance teams.
Dam Spillway & Outlet Works Maintenance: Catch Gate and Valve Failure Weeks Before an Inspection Would
Continuous AI monitoring of gate mechanism torque, hoist vibration, valve actuator condition, and control system reliability — so the first time you learn a gate won't fully open isn't during a flood event.
Spillway Gates and Outlet Valves Fail Quietly, Long Before Anyone Is Standing There to Notice
Most dam maintenance programs still run on a fixed inspection calendar — walk the crest, check the hoist room, cycle the gate if the schedule allows it, log what was visible that day. That approach was reasonable when it was the only option. It is also the reason critical deterioration in gate mechanisms and outlet valves so often goes unnoticed until it becomes an emergency, because visual estimates and handwritten notes simply cannot catch a torque signature drifting upward between visits. When the Oroville Dam's emergency spillway failed in 2017, roughly 188,000 residents were evacuated in what remains the largest dam evacuation in United States history — and the structural warning signs had been developing for some time before the failure became visible. That single event reshaped how the industry thinks about spillway and outlet works condition monitoring, and it is not an isolated risk profile: nearly 17,000 high-hazard potential dams exist across the United States alone, with roughly 2,500 of them currently rated in poor condition. A gate or valve fleet sitting inside that population cannot be managed safely on a periodic-inspection cycle alone.
The Outlet Works Cross-Section: Six Points Where a Small Deviation Becomes a Big Failure
A spillway gate or outlet valve assembly isn't one component that either works or doesn't — it's a chain of mechanical and electrical subsystems, and a failure at any one point in that chain can be enough to prevent full, reliable operation when it's needed most. A gate can have a perfectly sound structural frame and still fail to open because a position encoder has drifted out of calibration, or because packing on an unrelated outlet valve downstream has degraded enough to change the discharge profile the gate is expected to manage. The diagram below maps the six points along that chain where AI-monitored sensor data is already catching problems that a scheduled visual inspection would miss entirely, and each point corresponds to a specific, measurable signal rather than a general "check for wear" instruction on a paper checklist.
Four Measurements That Predict Gate and Valve Failure Before a Manual Inspection Ever Would
None of these signals require guesswork or a specialist reading a chart by hand. Each one is a quantitative deviation from a commissioning baseline, and each one gives maintenance planners a measurable lead time before the component would actually fail in service. That lead time is the entire point — a torque rise flagged six cycles into a drift can be scheduled into a planned outage window with parts ordered and a technician assigned in advance, while the same drift discovered only when a gate physically won't move has to be treated as an emergency call-out, with all the cost, risk, and discharge-capacity exposure that comes with it. The table below is intentionally specific about thresholds, because a maintenance manager evaluating a monitoring program needs to know what number actually triggers action, not just that "AI monitors condition."
| Signal | What It Measures | Early Warning Threshold | What It Usually Means |
|---|---|---|---|
| Torque Rise Over Time (TROT) | Torque required to operate the gate hoist or valve actuator, cycle over cycle | Roughly 15% increase over baseline within six operating cycles | Stem corrosion, thread wear, or lubricant degradation building up |
| Vibration Spectral Shift | Dominant vibration frequency band on hoist and actuator-mounted accelerometers | A shift of roughly 15Hz in the dominant frequency band | Bearing wear, misalignment, or early-stage cavitation damage |
| Position Deviation on Closure | Discrepancy between commanded and actual stem or gate position at full seat | A 3–5mm gap between expected and actual seated position | Stem-thread damage, jamming, or a foreign-body obstruction |
| Stroke Time Drift | Time required to complete a full open or close cycle against its commissioning baseline | Roughly 15–18% slower than baseline stroke time | Packing overtightening, actuator thrust loss, or hunting at partial stroke |
Reactive Inspection Cycles vs. Continuous AI Condition Monitoring
The gap between these two approaches isn't a matter of preference — it's the gap between finding a problem on paper months later and finding it on a dashboard the week it started. Most dam owners aren't choosing between these two models in the abstract; they're deciding how to allocate a maintenance team that's already stretched across a fleet of gates, valves, and outlet structures with more assets than there are hours in an inspection cycle. The comparison below is about where that limited time actually gets spent — chasing a fixed calendar, or responding to the assets that are genuinely showing signs of wear.
- Comprehensive structural and mechanical surveys conducted only every few years due to cost and access logistics
- Technicians rely on visual estimates and handwritten notes, which cannot catch a gradual torque or vibration drift
- Rope access and confined-space entry into penstocks and spillways expose inspectors to real physical risk
- A stuck gate or sticking valve is typically discovered during the operation that actually needed it to work
- Torque, vibration, position, and pressure stream continuously into the asset record, not once every few years
- Each asset gets a health score measured against its own commissioning baseline, not a generic industry threshold
- Tiered alerts route warning-level drift to the next planned outage and critical drift to shift supervisors immediately
- Work orders are pre-populated with fault type, recommended procedure, and parts list before a technician is even dispatched
Every Reading Becomes Part of Your Emergency Action Plan Evidence, Not a Separate Task
Dam safety programs already carry a documentation burden that goes well beyond routine maintenance logs — regulators and dam owners expect a defensible record showing that gate and outlet works mechanical systems were actively monitored and maintained between formal periodic inspections, not just inspected on the schedule required by permit. A continuous monitoring program produces that record automatically. Instead of a maintenance manager assembling evidence after the fact from scattered work orders, handwritten logs, and whatever inspection photos happened to be filed correctly, every torque reading, every vibration trend, every alert, and every resulting work order lives in one asset record from the moment it's captured. That record does two things at once: it shortens the time a technician spends preparing for an audit or a Federal Energy Regulatory Commission-style periodic inspection, and it gives incident investigators an actual data trail if a gate or valve does eventually fail, rather than a best guess about what condition it was in beforehand.
A Stuck Gate Under Flood Load Is Not the Moment to Discover a Torque Problem
iFactory streams gate hoist, valve actuator, and control system data into one asset record, scores every component against its own baseline, and routes a work order before the deviation becomes a discharge-capacity emergency.
From Sensor Reading to Work Order: The Monitoring Sequence Behind Every Gate and Valve Asset
This is the same sequence running quietly in the background for every gate and valve in the fleet, every cycle, without a technician needing to trigger it manually.
The value of this sequence compounds over time rather than delivering a one-time benefit. As more cycles accumulate for a given gate or valve, the baseline it's measured against becomes more precise, false positives drop, and the health score becomes a genuinely reliable predictor rather than a rough estimate. A maintenance manager running this across a fleet of gates and outlet valves ends up with something a fixed inspection calendar can never provide — a ranked list of which specific assets actually need attention this month, based on real deviation from normal, instead of a list based purely on how long it's been since the last visit.
For most of my career, dam maintenance meant walking the crest, checking the hoist room on schedule, and hoping nothing had changed since the last visit. That's not oversight anymore, it's a gap. Torque and vibration drift on a gate hoist doesn't wait for a scheduled inspection window, and by the time a stuck gate shows up on a visual check, it's usually already been stuck for weeks. Continuous monitoring doesn't replace the maintenance team — it tells them exactly which asset in a large fleet actually needs their attention this week, instead of asking them to guess.
Frequently Asked Questions
Give Your Gate and Valve Fleet the Same Early Warning Discipline Flood Forecasters Already Rely On
iFactory monitors gate mechanism condition, valve operation, and control system reliability continuously, scores every asset against its own baseline, and puts a work order in front of your team before a stuck gate becomes the emergency.