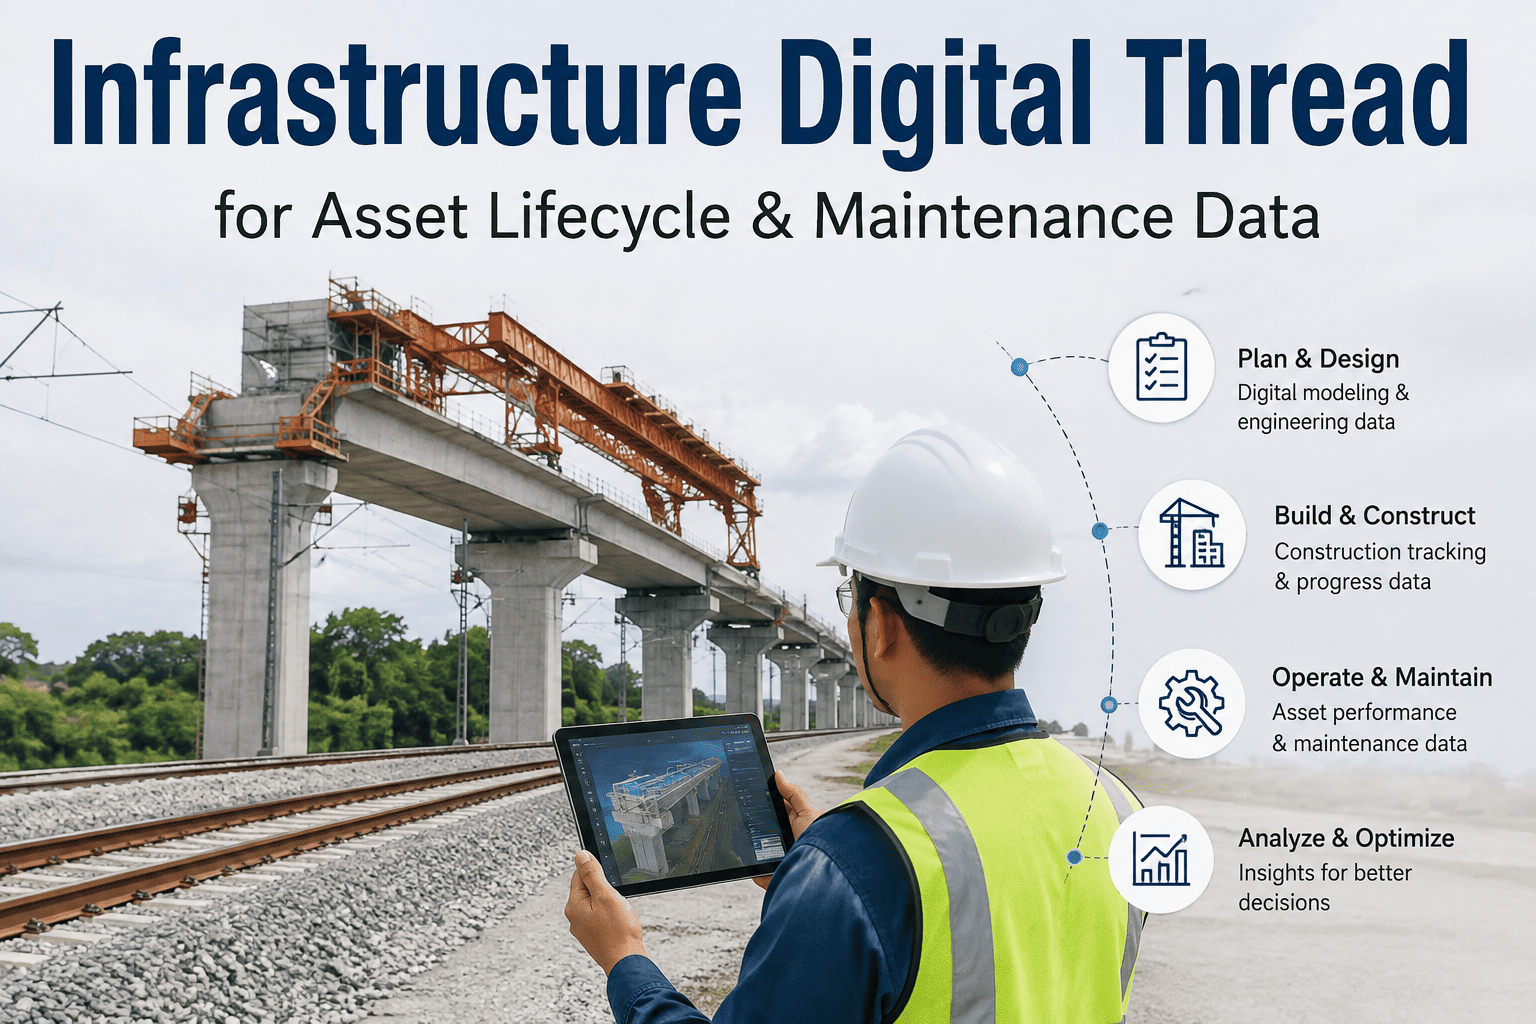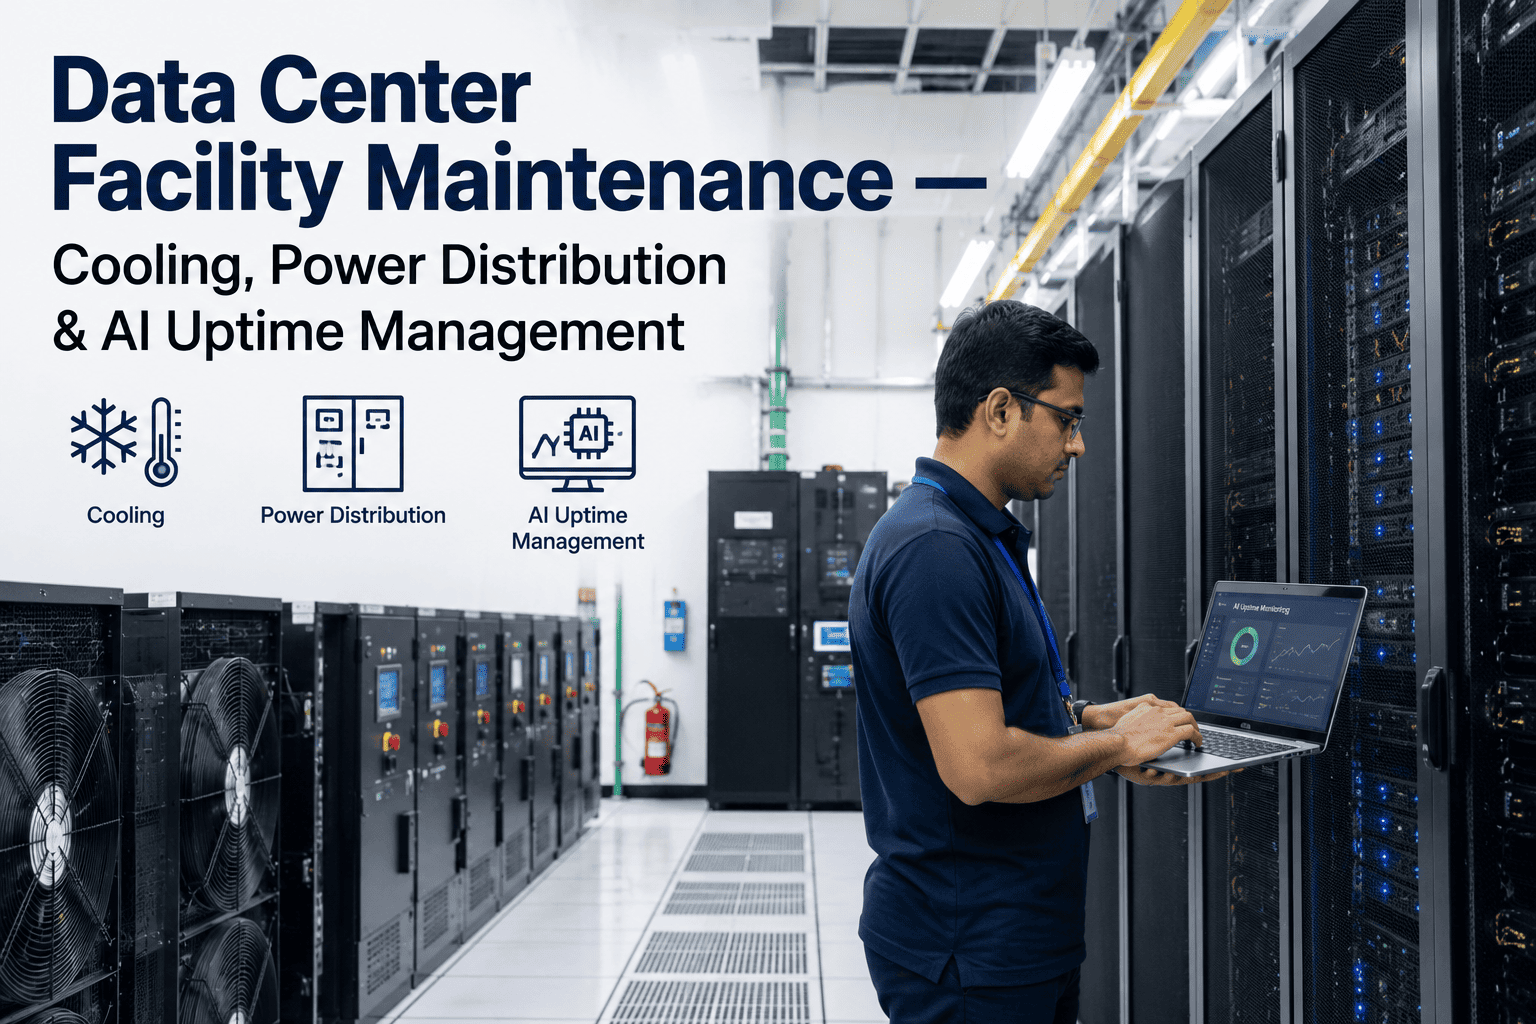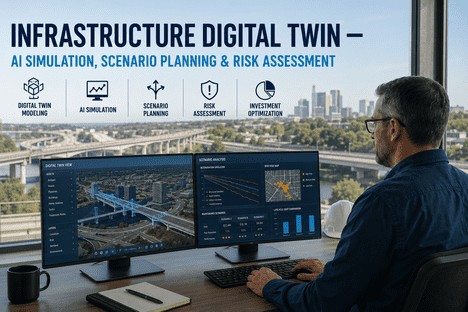
The hardest calls an Operations Director makes — which line gets overhauled this summer, which roof fails first, where next year's capital actually goes — still depend on spreadsheet fragments, decades-old PDF drawings, and institutional memory that retires with the engineers who hold it. BIM was meant to fix this, yet the design model handed over at construction sits disconnected from the maintenance logs, energy meters, and production records describing what the facility really does each day. Infrastructure BIM and digital twin technology close that gap by fusing design models with live operational data, turning every asset into an AI-readable source of lifecycle intelligence for new and existing facilities alike. iFactoryApp turns that fusion into daily operations — book a 30-minute demo to see your BIM files, GIS layers, and equipment history become one decision-ready model.
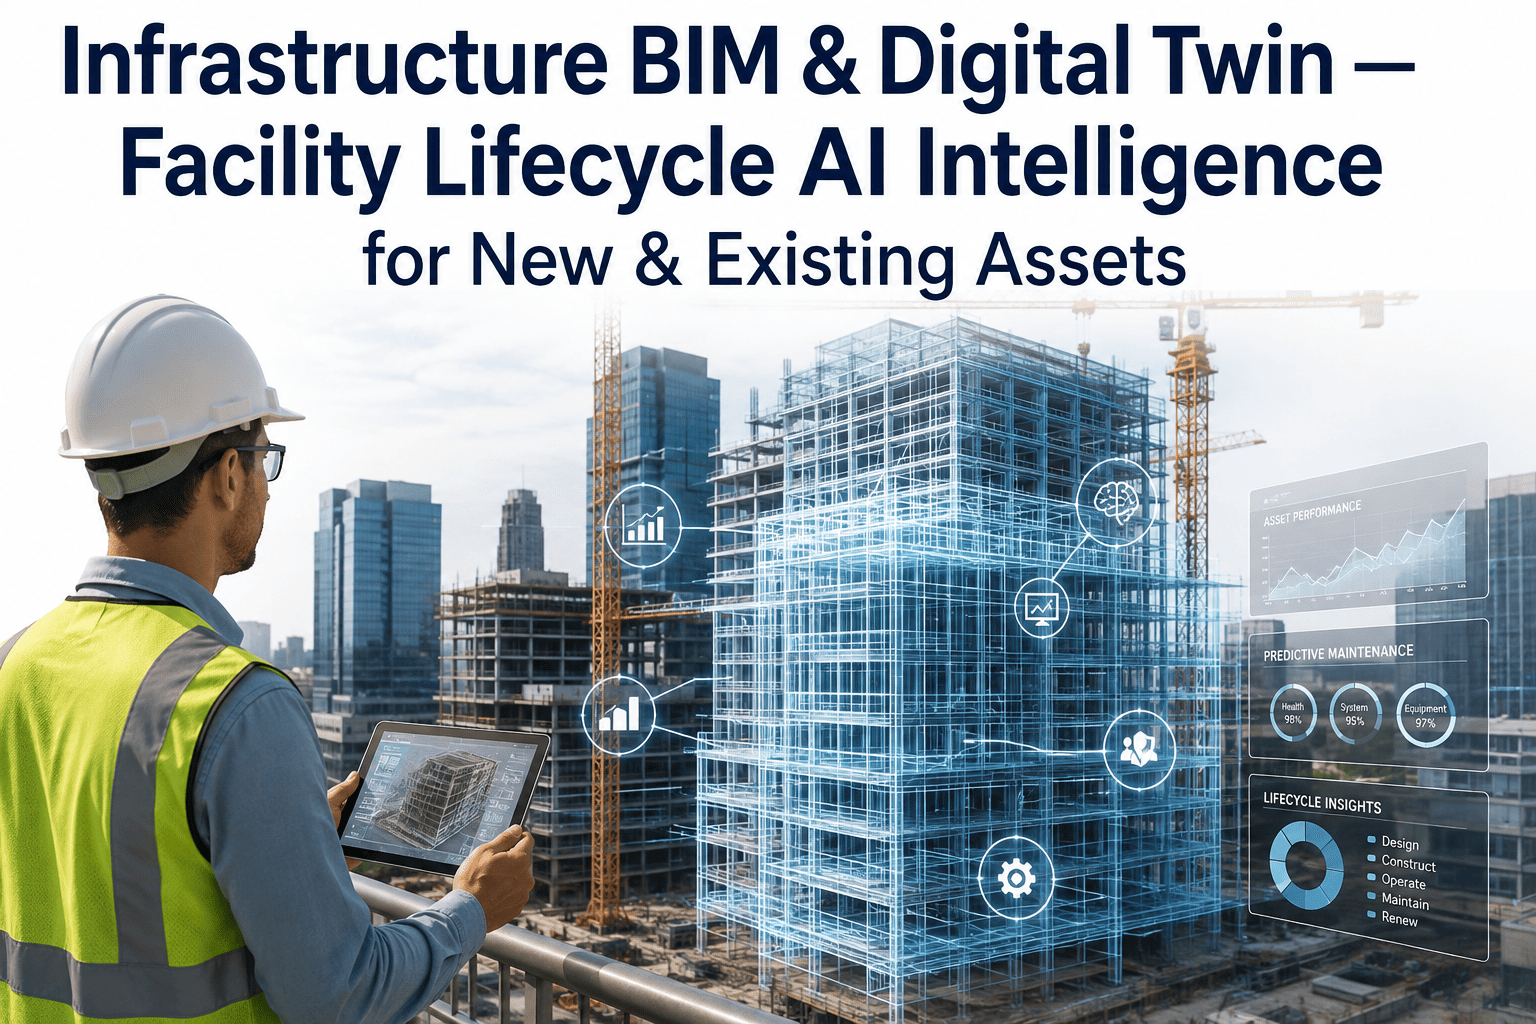
Infrastructure BIM & Digital Twin — Facility Lifecycle AI Intelligence for New & Existing Assets
Connect what your facility was designed to be with what it actually does. One living model that pairs BIM geometry and GIS context with live operational data — so maintenance, renovation, and capital decisions draw on evidence instead of estimates.
The 80 Percent Problem: Where a Facility's Real Cost Actually Lives
Ask a finance director what a facility costs and the answer will be the construction budget. Ask an Operations Director and the answer will be the thirty years that follow it. Lifecycle cost studies across the buildings and infrastructure sector consistently estimate that 60 to 80 percent of a facility's whole-life cost is incurred after handover — energy, maintenance, spare parts, retrofits, and the periodic renovations that keep a plant competitive. Almost all of the structured data effort, by contrast, happens before handover. The BIM model is built to win the contract, coordinate trades, and clear inspections; then it is archived, exported to flat PDF, and operations inherits a drawing set that starts aging badly on day one.
The downstream costs are predictable. When a chiller trips, the technician cannot find the O&M manual that matches the installed revision. When a renovation is scoped, contractors re-survey spaces the company already paid to model once. When the capital plan is assembled, repair-versus-replace calls rest on instinct because nobody can produce an asset's true cost history. A facility digital twin exists to make that 80 percent legible — and with analyst firms projecting the digital twin market to keep compounding above 35 percent a year through 2030, it is quickly becoming the default way serious infrastructure owners run the operating phase.
None of these numbers are exotic. They are what becomes available when the design model, the site context, and the operational record finally live in one place — which is precisely the gap iFactoryApp was built to close.
One Facility, Four Layers: What a Lifecycle Twin Actually Is
A facility digital twin is not a 3D picture of the building, and it is not a replica built for its own sake. It is a structured model that stacks four different kinds of truth about the same physical asset — and the operational value appears only when all four layers are connected. Geometry without live data is just a drawing. Live data without geometry is just a database. Neither one can answer the questions an Operations Director actually asks.
Geometry, systems, specifications, and spatial relationships: the structured record of every object from foundation to final fixture, captured at design and kept current by operations.
Site boundaries, utility corridors, drainage, access routes, and portfolio position across every site — the geographic context that decides what a problem at one location means for the rest of the network.
Meter readings, sensor streams, work orders, downtime events, and production counts — the facility's actual behavior, captured continuously instead of reconstructed quarterly.
Learned baselines, failure forecasts, degradation curves, and scenario models that convert the three layers below into ranked, defensible decisions.
Most facilities already own pieces of this stack without realizing it. The BIM file sits in a contractor's handover folder, the GIS site plan lives inside an old utility study, sensor and meter history is trapped in the SCADA system, and cost records sit in a CMMS nobody enjoys using. The twin is the connective tissue between them — and in iFactoryApp, connecting it is a data project measured in weeks, not the multi-year IT programs that originally gave digital twins their intimidating reputation.
The Handover Cliff: Where Facility Data Goes to Die
Facility data does not disappear in a single event. It decays in stages, and the decay accelerates at exactly the moment the data becomes most valuable — when a renovation, expansion, or failure investigation needs it. The pattern repeats so consistently across industrial estates that it deserves its own name: the handover cliff.
ISO 19650 and the COBie handover format were invented to prevent exactly this collapse, and they work — on new projects, when the client enforces them. They do nothing for the operating estate, which is where every facility spends the majority of its life. That is why a credible twin strategy has to work in both directions: capturing structured data properly on new projects, and rebuilding structure retroactively for everything already standing.
New Assets and Existing Assets: Two Roads Into the Same Twin
Most of the industrial building stock standing today was designed before BIM mandates existed. Public infrastructure requirements in the UK, across EU member states, and in a growing list of US transportation agencies govern new work — not the plant built in 1989. Any honest digital twin strategy therefore runs two parallel roads, and both arrive at the same destination.
Start Current
Handover packages built to ISO 19650 with IFC models and COBie data arrive structured from day one. iFactoryApp ingests the model directly, registers every object as a tracked asset, and the twin begins its life accurate — design intent and operational record aligned from the first work order onward.
Rebuild Backwards
No BIM is required to start. Scanned drawing sets, P&ID prints, and CMMS history are digitized into a structured asset registry; laser scans add model geometry wherever accuracy matters. The twin is reconstructed from records the facility already owns, then kept current by daily operations.
Both roads end at the same place: a single asset registry where geometry, documents, cost history, and live readings hang off one identifier. Whether that registry was born from a contractor's IFC model or rebuilt from scanned P&IDs matters far less than whether operations keeps feeding it — because a twin that stops receiving data is just a newer kind of archive.
Six Questions the Twin Answers That Spreadsheets Cannot
The clearest way to understand what a lifecycle twin does is to look at the questions it answers — questions that today get answered by walking the floor, opening five systems, or asking the longest-serving engineer, and that tomorrow get answered from one model.
Which asset fails next?
Ranked failure probability per asset, learned from live sensor behavior, meter data, and years of work-order history — so maintenance effort lands where the risk actually is, not where the calendar says.
What happens if we renovate?
Simulate shutdown sequences, detect clashes against the as-operated model, and price disruption before a single wall opens. Renovation scoping stops starting with a re-survey of a building you already own.
Repair or replace?
Total cost of ownership per asset — purchase, energy, maintenance, downtime — projected across scenarios, with remaining useful life estimated from the asset's own degradation curve rather than a generic table.
Where is the energy actually going?
Meters mapped to model zones expose which rooms, lines, and systems consume what. Energy anomalies surface as spatial alerts instead of buried columns in a monthly utility spreadsheet.
Does the layout still work?
Test layout changes against real production flow data before committing capital. The twin shows whether a proposed line move conflicts with utilities, clearances, or material handling paths.
Can we prove the as-built?
Audit, insurance, and compliance requests pull from a model updated by every work order — an as-built that stays as-built because operations keeps feeding it, not a PDF frozen at handover.
The Maintenance Maturity Ladder: From Firefighting to Foresight
Maintenance strategy is a ladder, and most facilities are standing on its lower rungs without a plan to climb. The ladder is not really about buying sensors — it is about whether the data those sensors produce can be connected to the asset it describes. That connection is exactly what the twin provides.
| Approach | Trigger | Downtime Profile | Cost Profile | Data Needed |
|---|---|---|---|---|
| Reactive | Failure has already happened | Longest and least predictable; collateral damage common | Highest — rush freight, overtime, secondary damage | None |
| Preventive | Calendar or runtime schedule | Reduced, but failures between intervals still land randomly | Moderate — healthy assets get over-serviced | Static schedules |
| Condition-Based | Sensor crosses a threshold | Lower — failures caught late in the curve | Moderate — sensor investment plus late intervention | Live sensor readings |
| Predictive (Twin-Driven) | AI forecast from model, history, and behavior | Lowest — work planned into production windows | Lowest per asset — effort spent only when needed | BIM + GIS + live operations + full history |
The jump that matters is from condition-based to predictive, and it is the jump facilities struggle with most — not because the analytics are hard, but because threshold alerts without asset context produce noise. A vibration reading means something different on a 1994 compressor than on its 2021 replacement. The twin supplies that context: model, history, and behavior in one record, which is what turns a sensor alert into a decision.
From Files to Foresight: How the Data Pipeline Works
Underneath the concept, a lifecycle twin is a data pipeline — and the pipeline is short enough to describe in five steps. Each step is a discrete, deliverable milestone, which is what makes the program manageable rather than monolithic.
Ingest
IFC and Revit models, COBie data, GIS shapefiles, PDF drawings, P&IDs, meter CSVs, and CMMS exports all enter one system.
Register
Every object becomes an asset with a unique ID — geometry, documents, and cost history attach to the same record.
Connect
Meters, sensors, production systems, and work orders stream live data, so the model reflects today, not handover day.
Learn
AI baselines each asset's normal behavior, then watches for drift, degradation, and early failure signatures.
Decide
Ranked risks, repair-versus-replace scenarios, and renovation simulations reach the Operations Director as capital-ready outputs.
Every step compounds the one before it. A registry without live data is still a documentation win; live data without the registry cannot be located in space; and the AI layer is only ever as good as both. Facilities that try to skip straight to analytics usually discover this the expensive way.
Your next renovation shouldn't begin with a re-survey of a building you already own.
iFactoryApp ingests your BIM files, GIS layers, legacy drawings, and CMMS history into one living facility model — then layers AI forecasting on top, so maintenance, renovation, and capital decisions draw on live evidence instead of estimates. See it mapped against your own asset list before your next planning cycle.
The Numbers Operations Directors Take to the Board
Every twin business case eventually reduces to a handful of measurable deltas, and they are the numbers an Operations Director can defend in a capital committee. The ranges below reflect what consultancies and early adopters report across industrial programs — the specific figure for any facility depends on where it starts on the maturity ladder.
less unplanned downtime, the range consultancies consistently report for mature predictive maintenance programs
lower maintenance cost per asset as over-servicing ends and failures get planned instead of survived
longer useful life for major equipment tracked against its own degradation curve rather than a generic table
energy reduction once meter data is mapped to zones and systems inside the model and anomalies become visible
to retrieve any drawing, manual, or cost record, versus the hours technicians spend hunting across shared drives today
typical time to first measurable return when implementation starts with the highest-value assets instead of the whole site
The returns that never make it onto a slide matter just as much. Documentation that survives staff turnover. An as-built record that satisfies an insurer on the first request. A renovation scoped in days instead of months. These are the quiet, compounding benefits of a facility that finally knows itself.
One Chiller, Two Outcomes: A Before-and-After Walkthrough
The abstract argument for a twin becomes concrete fast when the same failure runs twice — once in a facility running on drawings and spreadsheets, and once in a facility running a live model. Same chiller, same plant, two entirely different weeks.
Without a Twin — The Week That Actually Happens
02:40 — vibration alarm on chiller 2. The night technician searches shared drives for the O&M manual and finds three versions, none matching the installed revision.
The unit trips at 04:15. Process cooling is lost and the affected line stops for nine hours.
A rental chiller is sourced at emergency rates while the failure cause is still unknown.
Contractors re-measure the plant room because the only drawings predate the 2011 retrofit.
Two quotes arrive — repair and replacement — priced against different assumptions, neither comparable.
The decision is made under pressure in a Thursday meeting, from memory and instinct.
With a Twin — The Same Week, Rewritten
Two weeks earlier — the twin flags chiller 2 drifting from its learned baseline: bearing wear signature, rising vibration trend.
A work order opens automatically with the asset ID, the matched manual revision, and nine years of cost history attached.
The AI prices three scenarios — run to failure, overhaul now, replace at summer shutdown — against actual downtime cost.
Replacement is scheduled into the planned shutdown window; the new unit is on site before the old one is disconnected.
The capital plan updates automatically, with the full evidence trail attached to the budget line.
Zero unplanned downtime. The decision took minutes, and every number in it is defensible.
Implementation Roadmap: The First Six Months
Twin programs fail when they are scoped as an IT transformation and succeed when they are scoped as a sequence of deliverables. The six-month arc below is the shape most industrial implementations follow, and it deliberately front-loads the quick wins that fund the rest.
Baseline
Asset inventory audited, data sources mapped, drawings and records collected, and the highest-value assets selected as the starting scope.
Model
BIM and GIS files ingested — or legacy records digitized — and every object registered into the asset registry with documents attached.
Connect
Meters, sensors, and work-order flows stream live data, and the AI begins learning each asset's normal behavior.
Decide
Forecasts mature, repair-versus-replace scenarios enter the capital cycle, and the twin becomes the standing input to planning.
The single most common implementation mistake is attempting the whole site at once. Starting with the highest-value assets — the chillers, compressors, and lines whose failure actually stops production — delivers proof inside one budget cycle, and proof is what earns the scope for the rest of the facility.
Frequently Asked Questions
Our facility was built in the 1980s with no BIM at all — can we still build a digital twin?
Yes, and in practice most of the industrial estate is in exactly this position, because BIM mandates for public infrastructure only govern new projects. The retrofit path starts from whatever exists today: scanned PDF drawing sets, P&ID prints, paper O&M manuals, spreadsheets, and the work-order history buried in your CMMS. That material is digitized and structured into an asset registry, and — wherever measurement accuracy matters — supplemented with laser scans that turn point clouds into model geometry. iFactoryApp is built to start from imperfect legacy data rather than requiring a born-digital model. Book a 30-minute demo and the team will map which of your existing records can seed a twin.
What file formats and data sources can iFactoryApp actually ingest?
The ingestion layer accepts the formats facilities realistically hold, rather than a short list of ideal ones: IFC and Revit exports for BIM, COBie spreadsheets from handover packages, GIS shapefiles and GeoJSON for site context, scanned PDFs of legacy drawings and P&IDs, CSV exports from meters and energy systems, and history from CMMS or ERP systems. Each object in an ingested model becomes a registered asset with a unique identifier, so geometry, documents, cost history, and live readings all attach to the same record. The point is not format purity — it is consolidation, so that answering a question about one asset never requires opening five different systems.
How is a digital twin different from the CMMS we already run?
A CMMS is a transactional log: it records that a work order was opened, what was done, and when it closed. A twin adds three dimensions a CMMS cannot hold. It adds spatial truth — where every asset sits in the building and what surrounds it. It adds design truth — the specifications, model geometry, and documentation the asset was built to. And it adds analytical truth — AI models that learn each asset's normal behavior and forecast what happens next. The two systems complement each other rather than compete: the twin enriches every work order with location, history, and prediction, while the CMMS keeps feeding the twin the failure and cost data its models learn from.
How does AI actually support a repair-versus-replace capital decision?
Every asset in the twin carries a degradation curve learned from its own behavior and cost history, not from a generic manufacturer table. The AI projects remaining useful life under different scenarios — keep maintaining, overhaul now, replace at the next shutdown — and prices each scenario using your actual spend data, downtime costs, and energy consumption. Risk is weighted in, so an asset whose failure would stop a production line scores differently from one with a redundant backup. The output is a ranked, defensible capital recommendation the Operations Director can carry into the board meeting, with the evidence trail attached to every number in it.
How quickly do we see value from a twin program?
Value arrives in phases rather than at the end. The first measurable win is usually documentation: once drawings, manuals, and history consolidate behind asset IDs, retrieval drops from days to minutes, and that alone changes how maintenance runs. The second wave comes when live data connects and the AI begins flagging anomalies — typically one to two budget cycles in. The third wave, forecasting and capital scenarios, strengthens as history accumulates. Facilities that start with their highest-value assets rather than attempting the whole site at once usually see the first returns inside the first quarter. Contact iFactory Support to scope a phased start against your asset list.
Every facility already generates the data. The only question is whether it ever becomes intelligence.
iFactoryApp turns BIM models, GIS context, legacy drawings, meters, and maintenance history into one living facility twin — with AI that flags failures before they stop production, prices repair-versus-replace honestly, and keeps the capital plan grounded in evidence. Book a 30-minute demo and see the twin running against your own asset list.