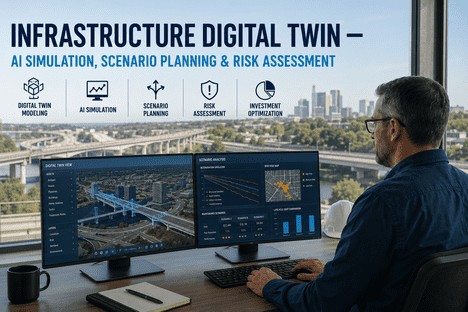
Infrastructure Digital Twin — AI Simulation, Scenario Planning & Risk Assessment
By Grace on June 23, 2026
The global digital twin market reached USD 29.3 billion in 2025 and is projected to exceed USD 223 billion by 2034 — a compound growth rate of over 25 percent that makes it one of the fastest-adopted technologies in infrastructure management history. Yet the organisations seeing measurable ROI from digital twins are not those that built the most detailed 3D models or ingested the most sensor streams. They are the ones that use digital twins to answer a specific question their operations directors face every day: what will happen to this asset, this network, or this portfolio if we maintain it the way we are currently maintaining it — and what changes if we invest differently? Infrastructure digital twins have evolved from static visualisation tools into AI-powered simulation environments where operations directors can model deterioration trajectories, test capital investment scenarios, compare maintenance strategies, and assess risk exposure across entire asset portfolios — all before committing a single dollar of budget. This guide explains how digital twin technology, combined with AI-driven simulation and scenario planning, gives infrastructure leaders the decision-making capability that static asset registers and spreadsheet models cannot deliver.
Digital Twin · AI Simulation · Scenario Planning · Risk Assessment · Infrastructure Intelligence
Stop Managing Infrastructure by Spreadsheet. Start Simulating Every Decision Before You Make It.
iFactory's digital twin platform combines AI-driven condition simulation, scenario modelling, and risk-based KPI dashboards — giving operations directors the ability to test every investment decision on a virtual replica before committing capital.
Projected digital twin market by 2034 — infrastructure and industrial sectors will represent the largest deployment segment
87.3%
Predictive maintenance accuracy achieved by AI-augmented digital twins — compared to 61% for conventional condition monitoring alone
20-30%
Improvement in capital and operational efficiency reported by infrastructure agencies using digital twin scenario planning (McKinsey)
30-50%
Reduction in unplanned downtime when AI-driven digital twin simulations are used to schedule condition-based rather than calendar-based interventions
What an Infrastructure Digital Twin Actually Does — Three Capabilities That Change How Decisions Are Made
The term digital twin is used broadly, but three distinct capabilities separate infrastructure digital twins that drive decisions from those that are simply visual databses. An infrastructure digital twin must be able to simulate future states based on current conditions, compare multiple scenarios side by side with quantified risk and cost outcomes, and update automatically as new sensor data, inspection results, or work order histories enter the system. Without all three capabilities, the twin is a static model — visually impressive and operationally inert.
Condition Simulation
The digital twin ingests real-time sensor data, inspection history, and operational parameters to model the current condition of every asset. AI-driven deterioration models project how each asset's condition will evolve under different load, climate, and maintenance scenarios. A bridge deck that currently shows 12 percent surface cracking can be simulated at 24, 36, and 48 months under three different repair strategies — and the cost consequences of each trajectory are calculated automatically.
Scenario Comparison
Operations directors can define and compare multiple future-state scenarios side by side: continue current maintenance with no additional investment, increase PM frequency by 30 percent across the portfolio, replace the highest-risk assets over five years, or defer all capital expenditure for two budget cycles. Each scenario generates quantified outputs — remaining useful life distribution, annual maintenance cost, unplanned event probability, and portfolio risk exposure — so the trade-offs between cost and risk are visible before budget decisions are made.
Automated Feedback
A digital twin that does not update itself is obsolete within the first week. iFactory's twin architecture automatically ingests every new sensor reading, inspection report, work order closure, and operational event — and recalibrates its deterioration models and scenario projections accordingly. If a pump's vibration profile shifts on Tuesday, the digital twin's remaining-useful-life projection for that pump updates on Tuesday, and every scenario that depends on that asset is re-evaluated by Wednesday morning.
The Scenario Planning Matrix — Mapping Decisions Across Risk and Time Horizons
Infrastructure investment decisions fall into four categories defined by two axes: the time horizon of the decision and the risk level of the outcome. A digital twin's scenario planning capability is most valuable when it can model decisions across all four quadrants of this matrix — from short-term operational adjustments that carry low risk to long-term capital investments whose failure consequences are measured in years of service disruption.
Short-Term / Low Risk
Operational Decisions
PM schedule optimisation
Simulate shifting PM intervals from calendar-based to condition-based for a pump fleet. Output: labour hours saved vs. failure probability change.
Spare parts inventory tuning
Model holding cost vs. stockout risk at different inventory levels for critical spares. Output: optimal reorder point by asset class.
Short-Term / High Risk
Emergency Response
Failure cascade simulation
Model the impact of a critical asset failure on downstream systems. Output: which assets to isolate first and estimated total downtime.
Emergency repair prioritisation
Rank repair sequence by risk exposure. Output: optimal order of intervention that minimises network-wide disruption.
Long-Term / Low Risk
Strategic Planning
CapEx phasing over 10 years
Model three replacement schedules for an aging asset class across a decade. Output: NPV comparison with risk-adjusted discount rates.
Regulatory compliance roadmapping
Simulate investment required to meet evolving standards. Output: year-by-year budget requirements to maintain compliance.
Long-Term / High Risk
Resilience Investment
Climate adaptation modelling
Simulate infrastructure performance under three climate scenarios over 30 years. Output: which assets need reinforcement and the cost of inaction.
Portfolio replacement strategy
Model full portfolio replacement under budget constraints. Output: risk exposure trajectory and optimal year-by-year replacement sequence.
Digital Twin · Scenario Planning · AI Simulation · Risk Modelling · Portfolio Intelligence
Every Infrastructure Decision Has a Range of Outcomes. iFactory Shows You All of Them Before You Commit.
iFactory's digital twin platform runs thousands of condition simulations and scenario comparisons in parallel — so operations directors can see the cost, risk, and performance consequences of every decision path at a glance.
Digital Twin Fidelity Levels — From Descriptive to Prescriptive, How Deep Should You Go?
Not every asset needs a full-physics digital twin. A water pipe network with 50,000 linear metres of cast iron main does not benefit from millimetre-level 3D rendering — it benefits from accurate flow, pressure, and corrosion rate modelling. A bascule bridge with complex mechanical linkages does benefit from a high-fidelity kinematic model. The fidelity level of a digital twin should match the criticality and complexity of the asset it represents. iFactory supports four fidelity levels that operations directors can mix across their portfolio based on asset type, risk, and budget.
L1
Descriptive
Digital Asset Register with Live Data
Every asset has a digital record with live condition data from IoT sensors, inspection history, and work order log. GIS-integrated map view shows asset locations with colour-coded condition status. Suitable for large, low-complexity asset classes — pipe networks, road segments, electrical feeders.
L2
Diagnostic
Condition Simulation with Trend Analytics
AI models analyse historical deterioration rates to project future condition. Simulate what-if scenarios — what happens to this pump's remaining useful life if we extend PM intervals by 30 percent? Suitable for medium-criticality assets where condition trends are available but the cost of a full physics model is not justified.
L3
Predictive
Physics-Based Deterioration Modelling
Full physics-of-failure models simulate crack propagation, corrosion progression, bearing wear, and fatigue cycles. Digital twin predicts time-to-failure with quantified confidence intervals. Suitable for high-criticality assets — bridges, turbines, large pumps, transformers — where failure consequences are measured in disruption costs.
L4
Prescriptive
Autonomous Scenario Optimisation
Digital twin runs thousands of scenario combinations automatically and recommends the optimal maintenance and investment strategy across the portfolio. AI ranks scenarios by cost, risk, and performance criteria defined by the operations director. Suitable for portfolio-level optimisation where multi-asset trade-offs are too complex for manual analysis.
Infrastructure Digital Twin Use Cases — Six Asset Classes, Six Simulation Approaches
Digital twin value varies by infrastructure type. The table below maps six common asset classes to the simulation approach that delivers the highest ROI for each — so operations directors can prioritise their twin deployment strategy based on which assets contribute most to portfolio risk and operating cost.
Asset Class
Simulation Approach
Primary Decision It Enables
Water Networks
Pipes, pumps, reservoirs
Hydraulic flow + corrosion rate simulation. Model pressure zones, leakage hotspots, and pipe burst probability under demand growth scenarios.
Which sections to refine vs. replace first under a 10-year capital constraint
Bridges & Structures
Steel, concrete, cable-stayed
Fatigue cycle + corrosion propagation model. Predict crack growth rates under traffic load and environmental exposure scenarios.
Optimal intervention timing before structural degradation reaches critical threshold
Rotating Equipment
Pumps, compressors, turbines
Vibration + thermal + wear model. Simulate remaining useful life under different load cycles and maintenance intervention schedules.
Condition-based maintenance interval that minimises total lifecycle cost per asset
Electrical Grid
Transformers, switchgear, feeders
Thermal + load + insulation degradation model. Predict transformer failure probability under peak load and ambient temperature scenarios.
Capacitor replacement timing and load redistribution strategy to defer upgrades
HVAC & Facilities
Chillers, air handlers, boilers
Energy performance + component wear model. Simulate energy consumption vs. maintenance cost trade-offs under different operating strategies.
Optimal balance between energy efficiency CAPEX and maintenance OPEX
Transport Corridors
Roads, rail, runways
Surface deterioration + traffic load model. Predict pavement condition index under different traffic growth and maintenance scenarios.
Segment-level resurfacing sequence that minimises user delay cost and lifecycle cost
Operations Director KPI Framework — Measuring the Impact of Digital Twin Deployment
The value of a digital twin is not measured in model fidelity or data volume — it is measured in whether the twin changes capital allocation decisions, reduces unplanned events, and extends the useful life of the asset portfolio. The KPIs below are designed for operations directors who need to track whether their digital twin investment is delivering measurable operational and financial returns.
Portfolio Risk
Portfolio risk exposure score — percentage of assets in the highest deterioration quartile, updated monthly from simulation outputs
Scenario comparison frequency — number of investment scenarios modelled per quarter, tracking whether the twin is being used for decision support
Unplanned event rate change — year-over-year trend in unplanned failures, attributed to condition-based interventions triggered by twin simulations
Capital Efficiency
CAPEX deferral value — dollars of capital expenditure deferred by extending asset life through condition-based intervention identified by the digital twin
Risk-adjusted NPV of investment scenarios — comparison of capital allocation decisions made with vs. without twin simulation
Budget-to-risk alignment score — how closely actual capital allocation matches the risk-prioritised sequence recommended by the digital twin
Asset Lifecycle
Remaining useful life accuracy — comparison of predicted vs. actual failure dates across the asset fleet, tracked monthly to measure AI model reliability
Mean time between failures trend — rolling 12-month MTBF by asset class, with digital twin-enabled improvements tracked separately from baseline
Maintenance cost per asset per year — unit cost trend by asset class, with digital twin-optimised assets compared to calendar-scheduled assets
Twin Adoption
Scenario simulation utilisation — number of unique decision-makers running scenario simulations per month, measuring adoption depth across the operations team
Twin data freshness — percentage of asset records updated within the past 24 hours, ensuring the twin reflects current operational reality
Decision impact ratio — percentage of capital and maintenance decisions that were directly informed by a digital twin scenario simulation
"
We manage a portfolio of 340 water and wastewater assets across six treatment plants and 2,100 kilometres of distribution main. Before deploying iFactory's digital twin, our capital planning process was a negotiation between plant managers, each advocating for their own facility based on anecdotal evidence and the last breakdown they remembered. The digital twin changed the conversation. We modelled five investment scenarios across the full portfolio — from maximum deferral to aggressive replacement — and presented the board with a single-page risk-adjusted cost comparison for each. For the first time, capital allocation decisions were made on quantified risk exposure and lifecycle cost rather than emotional urgency. In the first year, we identified and deferred USD 1.8 million in planned capital expenditure that the twin showed was not yet justified, and redirected it to assets whose deterioration trajectories were accelerating faster than our calendar-based inspections had revealed.
— Director of Operations, Regional Water Authority — 24 Years Infrastructure Management
Conclusion
The organisations that will achieve the highest ROI from infrastructure digital twins are not those that build the most technically detailed models — they are those that deploy twins as decision-support systems, not visualisation tools. With the digital twin market projected to exceed USD 223 billion by 2034 and AI-augmented twins already delivering 87 percent predictive maintenance accuracy, the capability to simulate every major infrastructure decision before committing capital is no longer an experimental advantage — it is becoming the baseline standard for operations directors who manage large asset portfolios. The difference between organisations that extract value from digital twins and those that accumulate underutilised models is whether the twin is connected to the decisions that matter: capital allocation, maintenance strategy, and risk exposure across the full asset lifecycle.
iFactory's digital twin platform gives operations directors the ability to simulate asset deterioration, compare investment scenarios, and quantify portfolio risk — all in a single AI-powered environment that updates automatically from live sensor and operational data. Book a Demo to see how iFactory's scenario planning capability models your portfolio's future under different investment strategies, or Talk to an Expert to discuss which fidelity level fits each asset class in your infrastructure portfolio.
Frequently Asked Questions
For L1 and L2 digital twin fidelity (descriptive and diagnostic levels), iFactory can begin generating value with as little as 12 months of historical condition data combined with the current asset register. Deterioration models at these levels use statistical trending that becomes reliable with 12 to 18 months of inspection and sensor history. For L3 physics-based models, 24 to 36 months of high-frequency sensor data is recommended to calibrate failure mode parameters. If historical data is limited, iFactory can seed models using industry-standard deterioration curves for the asset class and refine them as new data accumulates — typically reaching 85 percent accuracy within 90 days of live operation. Talk to an Expert to review your available data and determine the fastest path to a functional digital twin for your portfolio.
iFactory exports scenario simulation results directly into the formats and systems your planning team already uses — including Excel budget templates, CMMS work order schedules, GIS asset registers, and PowerBI dashboards. Scenario outputs include year-by-year maintenance cost projections, remaining useful life distributions, risk exposure scores, and recommended intervention timing for every modelled scenario. For organisations using Oracle, SAP, or Maximo for capital planning, iFactory's API layer supports direct integration so scenario outputs flow into the existing approval workflow without manual data transfer. The operations director can review scenario comparisons in iFactory's dashboard, select the preferred strategy, and push the resulting plan into the maintenance management system with a single action. Book a Demo to see how the scenario-to-workflow integration works with your existing planning systems.
Yes. For assets without IoT instrumentation, iFactory's digital twin models deterioration using inspection history, work order records, asset age, material type, environmental exposure data, and load or usage parameters extracted from operational logs. These non-sensor models are calibrated using industry-standard deterioration curves for each asset class and are automatically refined as new inspection findings and work order data are ingested. For organisations planning to add sensor coverage, iFactory can simulate the ROI of instrumentation — modelling the expected improvement in prediction accuracy vs. the cost of sensor deployment — so the operations director can make data-driven decisions about where to invest in IoT coverage based on which assets contribute most to portfolio risk. Talk to an Expert to discuss which of your assets would benefit most from sensor augmentation and which can be modelled accurately using existing operational data.
iFactory's scenario planning engine uses a multi-model ensemble approach that runs three independent deterioration models in parallel for each asset — a statistical regression model, a machine learning model trained on historical failure patterns, and a physics-based degradation model calibrated to asset material and loading conditions. The platform compares outputs across all three models and reports a confidence interval for every projection, not a single point estimate. For capital-grade scenario planning, the platform also runs sensitivity analysis that varies key assumptions — load growth rate, discount rate, inflation on spare parts, and climate exposure — and generates a range of outcomes for each scenario. The operations director sees not just the most likely outcome for each scenario but the probability distribution across a range of assumptions. This ensemble approach delivers 87 to 95 percent projection accuracy at the portfolio level, validated against actual outcomes across deployments in the water, transportation, and energy sectors. Book a Demo to review validation reports from similar infrastructure portfolio deployments.
Your Infrastructure Portfolio Has a Future. iFactory Lets You See Every Version of It Before You Invest.
From condition simulation to portfolio-level scenario comparison to risk-based KPI dashboards — iFactory's digital twin platform gives operations directors the intelligence layer that turns raw asset data into confident capital decisions.