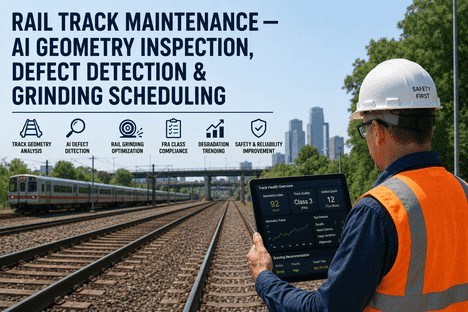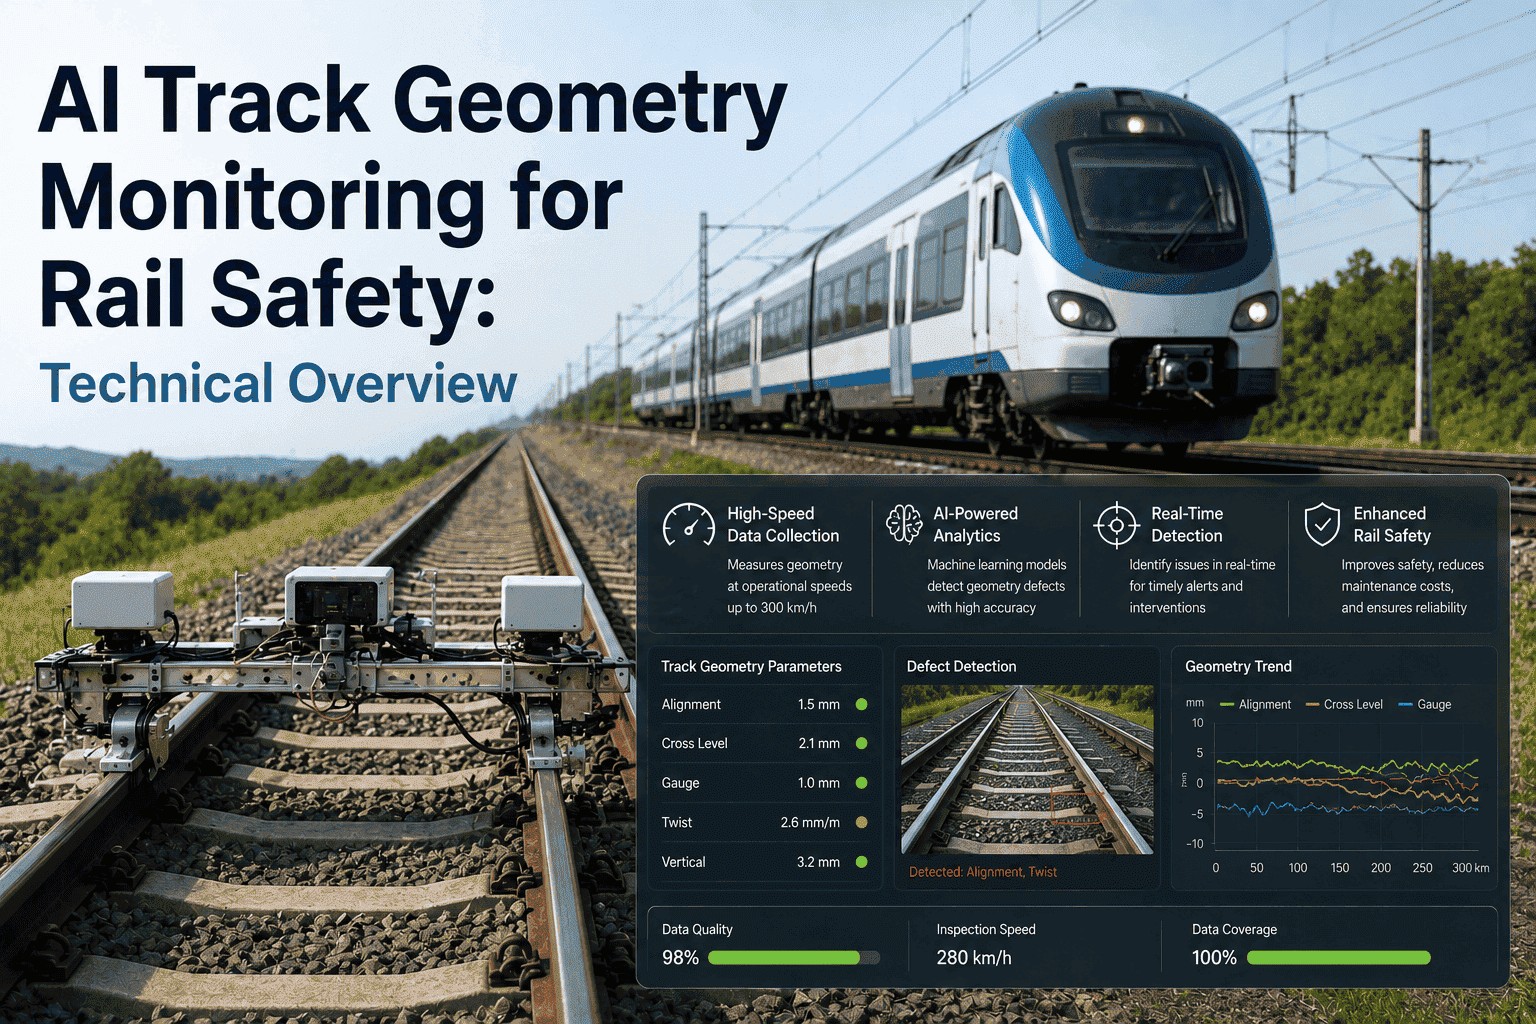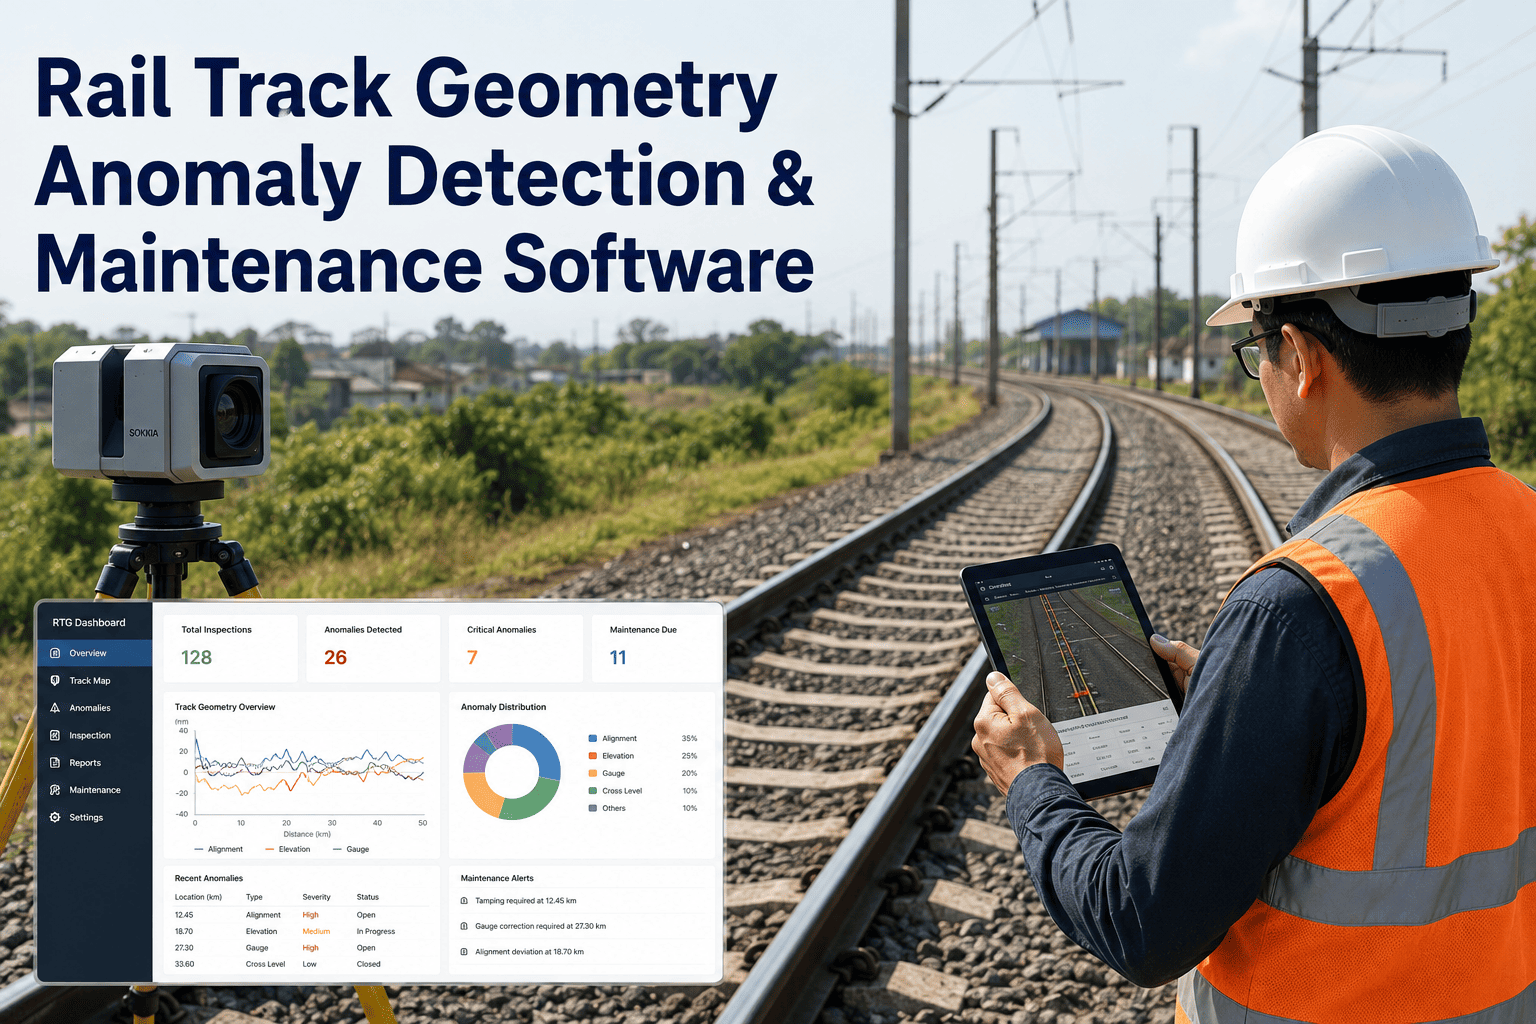
A track geometry car crosses a given mile of mainline only a handful of times a year, and between those passes the track keeps moving on its own schedule. Ballast settles unevenly under repeated axle loads, rail creeps under thermal cycling, and a joint that measured clean in March can show a widened gauge or a growing twist fault by June without anyone walking that segment in between. Track geometry defects rarely announce themselves as one dramatic event — they accumulate quietly under traffic until a wheel finally rides the flange, a car rocks hard enough to shift lading, or an FRA inspector flags a exceedance during a routine pass. Maintenance-of-way teams already know which curves, joints, and transitions tend to move; the harder problem is knowing which segment is moving right now, in the weeks between scheduled geometry car runs, when a defect is still cheap to correct with tamping or surfacing rather than an emergency slow order. AI-driven track geometry analytics from iFactory turn continuous sensor, inspection, and geometry-car data into a standing, constantly updated defect score for every segment of track under your care, and the underlying detection methodology is documented in full on the support page.
AI-Driven Track Geometry Anomaly Detection & Maintenance Prioritization
Continuously score gauge, cross-level, twist, warp, alignment, and profile across every mile of track, and turn raw geometry signal into a ranked, corrective maintenance work order before a defect becomes a slow order or a derailment cause.
Why Geometry Defects Are Different From Every Other Rail Fault Type
Most rail infrastructure faults — a cracked tie, a loose fastener, a worn frog — are visible defects that sit still until someone inspects that exact spot. Geometry defects behave differently. Gauge, cross-level, twist, and alignment are relational measurements between two rails and a moving reference frame, and they change continuously as ballast compacts, subgrade settles, and thermal stress redistributes rail forces across an entire curve. A geometry car captures a precise snapshot, but the track has already started drifting again before that car reaches the next subdivision. The table below lays out how the three common inspection approaches actually compare on the dimension that matters most for safety and cost — how much time passes between when a defect starts developing and when someone actually acts on it.
This distinction matters most on the curves and transitions that carry the highest traffic and the tightest tolerances, where even a small amount of drift compounds quickly under repeated axle loading. A curve that was surfaced to spec in the spring can develop measurable twist by late summer simply from seasonal ballast settlement and thermal rail growth, long before it would naturally come up again in a maintenance rotation planned around a fixed annual schedule. Waiting for the next scheduled inspection to catch that drift means the segment spends months operating closer to tolerance than anyone realizes, and the eventual correction often ends up being a larger, more disruptive surfacing job than it would have been if the drift had been caught and corrected early.
| Inspection Method | Detection Frequency | Defect Types Captured | Typical Response Lag | Labor Requirement |
|---|---|---|---|---|
| Manual walking inspection | Weekly to monthly | Visible surface and gauge issues only | Days to weeks | High, subject to fatigue |
| Scheduled geometry car | 1-4 passes per year | Full geometry suite, high precision | Weeks to months | Moderate, specialized crew |
| Onboard revenue-service sensors | Multiple passes per day | Vibration-correlated geometry proxies | Hours | Low, automated capture |
| Continuous AI geometry analytics | Every available pass, aggregated | Full geometry suite plus trend and rate-of-change | Minutes to hours | Low, exception-based review |
The Core Geometry Parameters the Models Track Continuously
A single geometry car pass produces dozens of measurable channels, but only a handful of them drive the overwhelming majority of derailment risk and ride-quality complaints. iFactory's models are tuned to weigh those channels the way an experienced track engineer would, watching not just the instantaneous value but the rate at which it is changing between passes.
Each bar reflects the relative weight that parameter carries in the combined segment risk score used to rank maintenance work orders.
iFactory can ingest your existing geometry car exports, onboard sensor feeds, or inspection records and show live defect scoring and rate-of-change trending on the exact subdivisions you operate, with no new hardware required to start.
From Raw Sensor Signal to a Prioritized Work Order
Detecting a geometry exceedance is only useful if it turns into a ranked, actionable task for the right maintenance gang before the next train runs over that segment. iFactory's analytics pipeline is built as a five-stage process that moves from raw signal capture through to a scheduled corrective action, with every stage logged for FRA compliance and internal audit purposes.
What a Missed Geometry Exceedance Actually Costs
Track geometry defects sit on a severity spectrum, and the corrective action, cost, and time pressure attached to each tier are wildly different. Catching a segment while it is still in the advisory range costs a fraction of what the same segment costs once it forces a mandatory slow order, and it costs almost nothing compared to the aftermath of a derailment traced back to an exceedance that was known but not acted on in time.
| Severity Tier | Typical Trigger | Required Action | Relative Cost If Caught Early |
|---|---|---|---|
| Advisory | Parameter trending toward tolerance, still compliant | Schedule into next planned surfacing cycle | Lowest — routine maintenance |
| Priority | Parameter within tolerance but rate of change accelerating | Dispatch spot maintenance within days | Low — targeted repair crew |
| Exceedance | Parameter exceeds class-of-track tolerance | Mandatory slow order until corrected | Moderate — plus operational delay cost |
| Critical | Compounding multi-parameter exceedance | Immediate line closure and emergency repair | High — plus derailment and liability exposure |
Deployment Models Built Around How Track Actually Gets Inspected
No two railroads capture geometry data the same way, so iFactory supports the inspection assets you already run rather than requiring a single hardware standard across the network. A short line with a single annual contracted geometry car run has a very different starting point than a Class I mainline running dedicated geometry cars quarterly plus continuous onboard sensor fleets, and the platform is designed to add value at either end of that spectrum. The goal during onboarding is never to replace what already works, but to make the data you already collect visible in one continuously updated place instead of scattered across separate systems, formats, and reporting cadences that make cross-referencing trend data unnecessarily slow.
Regulatory Reporting and Audit Trail Without the Extra Paperwork
Track geometry compliance is not just an internal maintenance concern — it sits directly under FRA track safety standards, and every exceedance, corrective action, and verification pass needs to be documented in a way that stands up to audit. Manually reconstructing that trail from paper work orders, spreadsheet logs, and geometry car printouts after the fact is slow and prone to gaps, especially across a large network with dozens of maintenance gangs working simultaneously. iFactory's platform captures the full lifecycle of every detected defect automatically, from the moment a parameter first crosses into the advisory tier through the corrective action taken and the verification pass that confirms it was resolved, so the audit trail exists as a byproduct of normal operations rather than a separate reporting task someone has to remember to complete. Reports can be generated by subdivision, by track class, or by time window, and are structured to align directly with the documentation formats FRA inspectors and internal safety auditors already expect to see.
This also changes how track engineers plan longer-term capital work. Instead of relying on a single annual geometry car summary to decide where next year's surfacing budget should go, planners can pull a full trend history for any subdivision showing exactly which curves and segments have been drifting fastest over multiple seasons, which joints keep reappearing on the priority list after supposedly being corrected, and which maintenance interventions have actually held. That historical pattern recognition, built from continuously logged data rather than a handful of annual snapshots, is often what separates a maintenance program that is constantly reacting to exceedances from one that is genuinely getting ahead of them.
A Track Engineer on What Continuous Monitoring Changed
Frequently Asked Questions
Scheduled geometry car runs tell you where your track stood on the day of the pass. iFactory's continuous analytics tell you where it is trending in between — turning raw sensor and inspection data into a ranked, actionable maintenance plan before a drifting parameter becomes a slow order or a safety event.