A seawall or bulkhead is not a static structure — it is a barrier under constant assault. Tidal cycles, storm surges, saline intrusion, biological fouling, and shifting sediment loads work on it 24 hours a day, 365 days a year. The corrosion rate in the splash zone of a marine steel bulkhead can reach 0.5 to 1.2 mm per year in aggressive coastal environments. Without intervention, a 12 mm steel sheet pile can lose structural integrity within a decade. The global cost of corrosion across all infrastructure is estimated at $2.5 trillion annually — 3.4% of global GDP — and marine structures account for a disproportionate share because they operate in the most aggressive natural corrosion environment on earth. For port and harbour maintenance managers, the question is not whether their seawalls and bulkheads are corroding. They are. The question is whether they have the data to know how fast, where the critical failure points are forming, and which section to rehabilitate first — before the next storm decides for them.
Your Seawall Is Corroding Right Now. The Question Is Whether You Will Find Out Before the Next Storm.
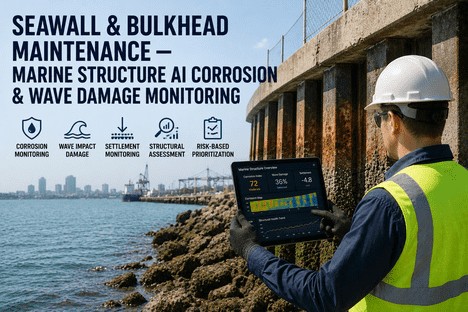
iFactory's marine structure monitoring module gives port maintenance teams AI-powered corrosion progression tracking, wave damage assessment, settlement detection, and rehabilitation priority scheduling — from a single platform that turns structural inspection data into actionable rehabilitation programmes.
Annual global cost of corrosion across all infrastructure — marine structures bear a disproportionate share due to continuous saltwater exposure and splash-zone acceleration
22.7%
CAGR of the corrosion monitoring predictive maintenance market — port operators using AI-driven corrosion tracking gain a widening cost advantage over calendar-based inspection regimes
0.5-1.2mm
Annual steel corrosion rate in the marine splash zone — a 12mm sheet pile can lose full structural effectiveness within a decade without monitored intervention
15-25%
Service life extension reported by operators using AI-powered corrosion prediction compared to reactive repair cycles driven by visual inspection alone
The Problem With Marine Structure Maintenance Is Not the Water. It Is the Blindness.
Port and harbour maintenance managers face a structural challenge that most civil infrastructure operators do not. A highway bridge can be closed for inspection. A building can be surveyed from stable ground. But a seawall or bulkhead exists in the intertidal zone — partly submerged, partly exposed, and fully inaccessible for large portions of each day. The corrosion that threatens it happens below the waterline, behind marine growth, and inside the crevices where oxygen differential cells form and accelerate localised pitting. Traditional inspection methods — diver surveys, visual walkdowns at low tide, manual ultrasonic thickness measurements — produce point-in-time data that is expensive to collect, difficult to compare across survey cycles, and almost impossible to aggregate into a meaningful trend unless the same inspector measures the same grid point at the same tidal state with the same equipment. Most port operators do not have that consistency. They have inspection reports from different vendors, using different reference points, producing data that cannot be compiled into a single rate-of-corrosion trend line — which means every rehabilitation budget decision is made on incomplete information.
Four Failure Modes That Calendar-Based Marine Structure Inspection Misses — and Why AI Monitoring Catches Every One
1
Accelerated Low-Water Corrosion — The Hidden Below-Wave Attack
ALWC is a microbiologically influenced corrosion mechanism that attacks steel sheet piles just above the mudline at low water. It can remove 3 to 5 mm of steel per year — 5 to 10 times the general corrosion rate in the same structure — and is almost invisible to topside visual inspection. By the time ALWC is visible from a boat or a walkway, the section has already lost significant load-bearing capacity. AI-driven corrosion monitoring detects ALWC by analysing thickness trends at consistent grid points across successive survey cycles, flagging any section where the material loss rate exceeds the structure's baseline corrosion envelope — weeks or months before a visual inspection would trigger concern.
2
Scour Undercutting — When the Seabed Disappears Beneath Your Wall
Scour is the removal of seabed material from the toe of a seawall or bulkhead by wave action and tidal currents. It creates an unsupported span that increases bending moments in the pile by an order of magnitude — and it progresses episodically, not linearly. A single storm event can remove more seabed material than a year of normal tidal action. iFactory's settlement monitoring module tracks changes in bulkhead alignment and toe elevation using data from inclinometers and bathymetric surveys, correlating scour events with wave height and tide data to distinguish storm-driven scour from gradual erosion — and triggering rehabilitation alerts when the unsupported pile length exceeds design tolerance.
3
Wave Impact Fatigue — The Cyclic Load That Never Stops
Every breaking wave exerts a dynamic load on the seawall. The force is not constant — it varies with wave height, period, direction, and the water depth at the toe of the structure. Over years of cumulative exposure, wave impact fatigue causes micro-cracking in concrete panels, stress corrosion cracking in steel piles at weld points, and progressive loosening of anchor systems. Traditional inspection does not measure fatigue accumulation — it only finds the cracks after they form. iFactory integrates wave monitoring data from coastal buoys or hindcast models with the structure's as-built fatigue curves to calculate cumulative fatigue damage in real time, flagging sections that are approaching their fatigue life limit before cracking initiates. Talk to an expert about configuring wave impact monitoring for your marine structures.
4
Cathodic Protection System Degradation — The Defence That Fails Silently
Most steel marine structures are protected by sacrificial anode or impressed current cathodic protection systems. These systems degrade over time — anodes erode, cables corrode, rectifiers drift out of specification. When a CP system fails on a section of bulkhead, the corrosion rate in that unprotected zone can increase by 5 to 10 times within weeks. Standard practice is to measure CP potential manually at test points on a quarterly or bi-annual schedule — meaning a failure in month one is not detected until month three or six. iFactory integrates CP potential data from automated monitoring stations, mapping anode consumption rates, circuit continuity, and protection potential across every bulkhead section — with automated alerts when any zone falls below the protection threshold of -850 mV versus Ag/AgCl. Book a demo to see how iFactory manages cathodic protection system monitoring for multi-berth port operations.
AI Corrosion Trend Analysis · Scour & Settlement Monitoring · Wave Fatigue Tracking · CP System Management
You Cannot Inspect Your Way to Structural Integrity. You Can Only Monitor Your Way There.
iFactory replaces the gap between inspections with continuous trend analysis. Every ultrasonic thickness reading, every CP potential measurement, every bathymetric survey is registered against the same structure in the same platform — building a corrosion trend line that tells you exactly where the rehabilitation budget should go.
What iFactory's Marine Structure Monitoring Module Actually Does
iFactory is not a document management system that stores PDF inspection reports. It is a structural monitoring platform that ingests inspection data from any source — ultrasonic thickness gauges, CP potential loggers, inclinometers, drone photogrammetry, diver surveys, lidar scans — registers it against a digital model of each marine structure, and applies AI analysis to detect corrosion trends, scour progression, wave fatigue accumulation, and rehabilitation priority. Every data point from every inspection cycle is comparable, because every measurement references the same grid, the same datum, and the same material register.
Capability 01
AI-Powered Corrosion Progression Mapping — Know Exactly Where and How Fast Your Structure Is Thinning
Predictive Corrosion Analytics
iFactory's corrosion mapping module takes ultrasonic thickness measurements from every inspection cycle and plots them on a digital elevation model of each bulkhead panel, seawall section, or pile group. The AI engine calculates corrosion rates at every grid intersection, identifies sections where the rate exceeds the structure's design corrosion allowance, and projects the remaining service life of each panel based on the actual measured rate of material loss — not a generic corrosion assumption from a design code. When a section is projected to reach minimum allowable thickness within the next inspection interval, the platform generates a rehabilitation alert with the specific location, the measured corrosion rate, and the projected expiry date. The maintenance manager sees a colour-coded structure map — green for within tolerance, amber for approaching threshold, red for rehabilitation required — updated with every new inspection data upload.
Grid-based thickness trend analysis
Remaining service life projection per panel
Automated rehabilitation threshold alerts
Capability 02
Wave Impact and Storm Damage Assessment — Correlate Structural Events With Metocean Data
Storm Event Correlation
iFactory connects to coastal wave buoys, hindcast models, or on-structure wave radar to import wave height, period, direction, and water level data for every storm event that affects your marine structures. When an inspection identifies new damage — a cracked concrete panel, a displaced fender, a scoured toe — the platform correlates the damage location and type with the wave conditions during the most recent storm events to determine the probable cause and the return period of the wave load that caused it. This correlation is what allows maintenance managers to distinguish between routine wear that can be scheduled into the next rehabilitation cycle and structural damage that signals a design-level deficiency requiring immediate engineering assessment. Over time, the accumulated wave impact data builds a fatigue exposure profile for each structure — showing which berths face the most aggressive wave conditions and which structural sections are absorbing the highest cumulative energy. Book a demo to see how iFactory integrates wave monitoring data with your structural inspection programme.
Storm event to damage correlation
Cumulative fatigue exposure tracking
Design-level deficiency flagging
Capability 03
Settlement and Scour Monitoring — Track Every Millimetre of Movement Across Every Berth
Structural Movement Tracking
Settlement and scour are the most under-monitored failure mechanisms in marine structure management because they require consistent survey data over time — not just a single as-built elevation check. iFactory's settlement module ingests data from inclinometers, prism-based total station surveys, multibeam bathymetry, and lidar scans to create a movement history for every panel and pile along the structure. The platform distinguishes between cyclic movement from tidal loading (elastic, recovers each cycle) and permanent settlement from scour or foundation failure (plastic, accumulates over time). When cumulative settlement or scour depth exceeds the threshold for the structure's design category, the platform alerts the maintenance manager with the specific location, the measured displacement, and the urgency level based on the rate of change. This eliminates the scenario where scour progresses unnoticed through multiple storm seasons until a panel displaces during a moderate weather event that the intact structure would have withstood.
Multi-source settlement data integration
Cyclic vs plastic movement classification
Rate-of-change urgency escalation
Capability 04
Rehabilitation Priority Scheduling — Allocate Budget to the Sections That Need It Most, Not the Sections That Are Loudest
Budget Optimisation
Every port maintenance manager knows the pain of the annual rehabilitation budget cycle: each berth or structure submits its list of required repairs, each with an urgency claim, and the central budget is allocated based on the most convincing presentation rather than the most objective structural need. iFactory replaces opinion-based budgeting with condition-based priority scoring. The platform calculates a composite priority score for each structure section based on measured corrosion rate relative to allowance, remaining service life, scour depth relative to design tolerance, cumulative wave fatigue damage, and CP system status. The sections with the highest composite scores are the ones that appear at the top of the rehabilitation queue — regardless of which berth manager submitted the most compelling spreadsheet. The result is a rehabilitation programme that allocates budget to the sections that actually need it, justified by trend data that every stakeholder can review and every regulator can accept. Talk to an expert to see how iFactory's priority scoring framework works for your marine structure portfolio.
Composite condition-based priority scoring
Multi-factor rehabilitation ranking
Audit-ready KPI justification for budgets
Inspection Method Comparison — How Each Data Source Feeds Into iFactory's AI Monitoring Engine
Inspection Method
What It Measures
Traditional Limitation
How iFactory Enhances It
Ultrasonic Thickness
Steel plate residual thickness at grid points
Point data with no standardised grid reference between survey cycles
AI registers each reading to fixed grid; calculates rate of loss and projects expiry per panel
CP Potential Survey
Electrochemical protection level at test points
Quarterly snapshots; failures between surveys go undetected
Continuous monitoring integration with automated below-threshold alerts
Multibeam Bathymetry
Seabed profile at toe of structure
Processed separately from structural data; not correlated with storm events
Correlates successive surveys to calculate scour rate; links to wave event data
Inclinometer Survey
Pile alignment and lateral displacement
Manual readings; cyclic vs permanent movement not distinguished
AI classifies movement as elastic or plastic; flags accelerating trends
Qualitative; no quantitative comparison between cycles
AI pixel-maps defect areas; quantifies crack width progression over time
"
We manage 14 kilometres of steel sheet pile bulkhead across three berths at a major container port. For years, our inspection programme produced individual reports that lived in PDF files on a shared drive. When it was time to plan the rehabilitation budget, we would spread seven years of inspection data across a table and try to figure out which sections were actually getting worse versus which had just been measured differently. With iFactory, every thickness reading from the last five years is plotted on the same grid. I can see which sections are corroding at 0.3 mm per year and which are at 0.9 mm per year — and I can allocate my budget on that basis, not on whoever argued the loudest at the budget meeting. The first year we used the platform, we reduced our reactive repair spend by 31% simply by prioritising the sections that the data said were next to fail — not the sections that looked worst from the walkway.
— Port Infrastructure Maintenance Manager, European Container Terminal Operator — 22 Years Marine Structure Management
Conclusion
Marine structures operate in the most corrosive natural environment on earth. The splash zone of a seawall or bulkhead experiences a corrosion rate that can exceed 1 mm per year — yet most port operators assess structural condition on an inspection cycle measured in months or years, not in continuous trend lines. Between inspections, corrosion progresses, scour deepens, CP systems degrade, and wave fatigue accumulates — invisible to the maintenance manager who has no way to connect discrete data points into a continuous condition profile. The gap between inspections is where structural failures begin, and the only way to close that gap is to replace calendar-based inspection thinking with condition-based monitoring logic.
iFactory's marine structure monitoring module turns every inspection data point into a permanent, comparable, trendable record — with AI-powered corrosion rate analysis, wave impact correlation, settlement tracking, and rehabilitation priority scoring that tells maintenance managers exactly where to invest their budget for maximum structural return. The platform does not replace inspection. It replaces the uncertainty between inspections with continuous visibility. Book a demo to see how iFactory maps to your marine structure portfolio, or talk to an expert about configuring AI corrosion monitoring for your seawalls and bulkheads.
Frequently Asked Questions
iFactory supports all common marine structure types including steel sheet pile bulkheads, concrete diaphragm walls, combi-wall systems, gravity seawalls, rock revetments, rubble mound breakwaters, piled jetties, dolphin structures, and anchored bulkhead systems. The platform's digital model framework accommodates any structure that can be defined by a linear or planar geometry with material properties and inspection grid references. Each structure type has its own monitoring template with appropriate condition metrics — steel structures use thickness and CP potential as primary indicators, concrete structures use crack width and chloride ingress, and rock structures use profile change and toe scour. Talk to an expert to confirm your structure type is supported and configure the appropriate monitoring template for your asset register.
This is one of the most common challenges iFactory solves. When you onboard your structure portfolio, the platform establishes a fixed grid reference system for each structure based on as-built drawings or a baseline survey. Every subsequent data upload — regardless of vendor, equipment type, or survey methodology — must be registered to that fixed grid. Inspection vendors upload their data through iFactory's standardised import templates that map their measurement points to the structure grid. The AI engine then normalises the data for any known measurement variability between equipment types (e.g., different ultrasonic probe frequencies producing slightly different readings on corroded surfaces). The result is that inspection data from 2019 using one vendor's equipment is directly comparable to 2025 data from a different vendor's equipment — because both are plotted on the same grid and normalised to the same reference standard. Book a demo to see the data normalisation workflow in action.
iFactory integrates with existing CP monitoring infrastructure — it does not replace it. The platform connects to automated CP monitoring stations via standard protocols (Modbus, 4-20 mA, SDI-12) to ingest protection potential and current output data in real time. For manually read CP systems, iFactory provides a mobile data collection interface that allows technicians to log potential readings at each test point with GPS-tagged location stamps, eliminating transcription errors and ensuring every reading is attributed to the correct location on the structure grid. The platform maps all CP data against the structure to show protection zones, identify under-protected sections, and track anode consumption rates over time. When protection potential at any grid point falls below -850 mV versus Ag/AgCl, the platform generates an alert with the specific location and the duration of the under-protection event. Talk to an expert to review your current CP monitoring setup and determine the integration approach.
iFactory's AI corrosion engine does not assume a uniform corrosion rate across the structure. It calculates corrosion rate separately for each grid cell based on the measured thickness trend at that specific location — and then segments the structure into corrosion zones based on actual measured performance, not theoretical exposure categories. The platform can also ingest environmental data layers — water temperature, salinity, dissolved oxygen, pH — from local monitoring stations or published sources, and correlate them with measured corrosion rates to identify which environmental factors are driving accelerated corrosion at specific locations. This allows maintenance managers to distinguish between sections that are corroding fast because of an environmental hotspot (e.g., a freshwater discharge point that changes local water chemistry) and sections that are corroding fast because of a material or coating deficiency. Each corrosion zone within the structure can then have a tailored rehabilitation strategy. Book a demo to see the environmental correlation layer in the corrosion mapping dashboard.
Your Seawall Is Not a PDF. Stop Managing It Like One.
iFactory's marine structure monitoring module — AI corrosion mapping, wave impact tracking, settlement monitoring, CP system integration, and rehabilitation priority scheduling. The single platform that turns inspection reports into structural intelligence.