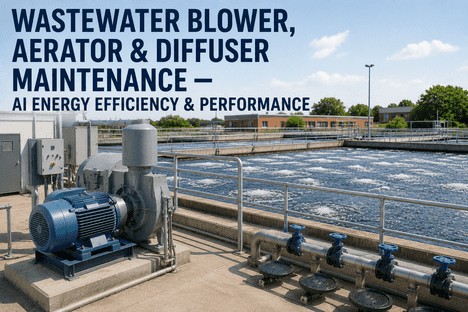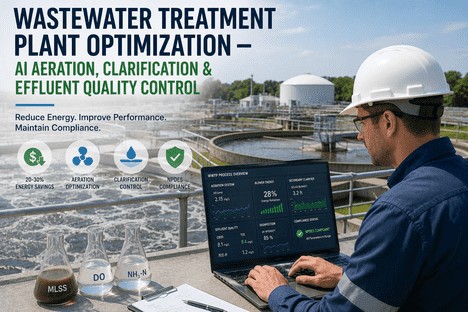
Disinfection is the last unit process before treated wastewater reaches the receiving stream, and it is the only process where a single equipment failure or dosing error can result in an immediate NPDES permit violation with public notification requirements. Reliability engineers at wastewater treatment facilities know that UV systems and chlorination systems fail in fundamentally different ways, yet most maintenance programs still treat them as interchangeable checklists. AI-driven dose control is changing how facilities optimize chlorine residual targets and UV energy delivery in real time, reducing chemical costs by double-digit percentages while keeping effluent fecal coliform counts well below permit limits. The facilities that still rely on static dose tables calibrated to average flow conditions are the ones that get caught off guard during storm events when transmittance drops and contact time shrinks simultaneously. Understanding exactly where each system breaks down, what sensors drift fastest, and how to structure a maintenance calendar around actual failure modes rather than calendar intervals is what separates facilities that pass every outfall sample from those that scramble after a exceedance. To see how iFactory tracks disinfection system performance data and maintenance schedules against permit requirements automatically, book a 30-minute demo.
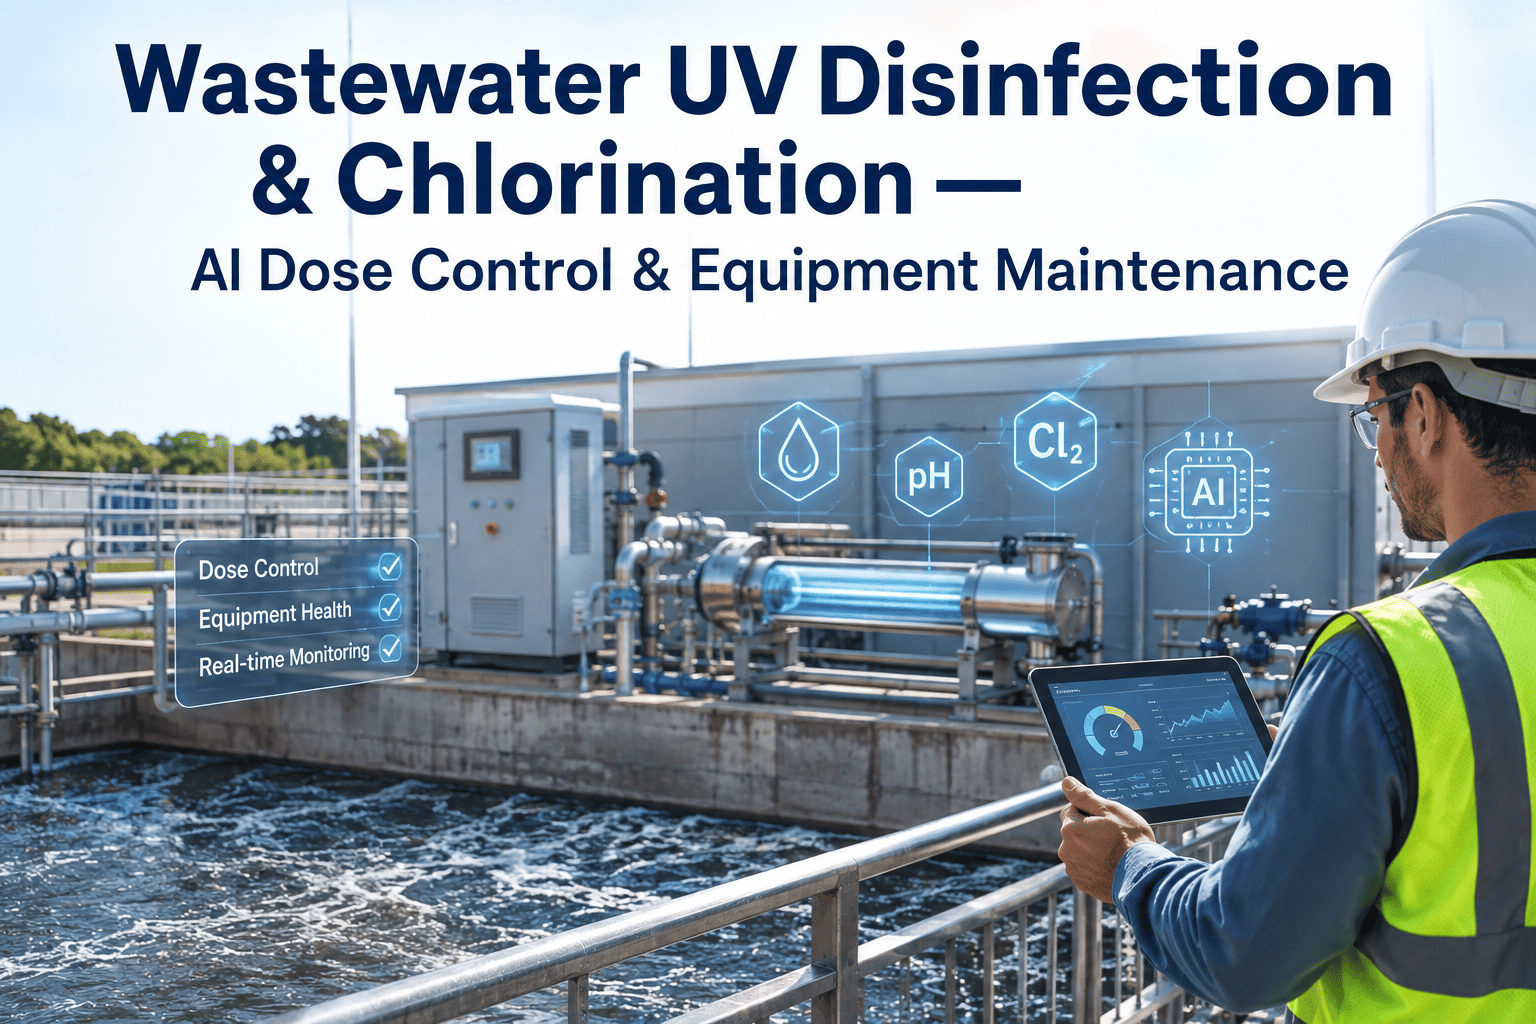
Wastewater UV Disinfection & Chlorination — AI Dose Control & Equipment Maintenance
How UV and chlorination systems fail differently, why static dose tables cost facilities money during storm flows, and how reliability engineers can build maintenance programs around actual failure modes instead of calendar intervals.
UV Disinfection — Light-Based Inactivation
UV systems deliver a calculated UV dose measured in millijoules per square centimeter to inactivate pathogenic microorganisms by disrupting their DNA. The dose delivered depends on lamp intensity, water transmittance, exposure time within the reactor, and lamp fouling or aging — all of which shift continuously during operation. A system calibrated for clear-weather secondary effluent can deliver a drastically insufficient dose during a high-flow storm event when suspended solids jump and UV transmittance drops simultaneously, which is why real-time dose monitoring matters more than the nameplate rating on the reactor.
Chlorination — Chemical Residual Control
Chlorination systems inject sodium hypochlorite, chlorine gas, or calcium hypochlorite to achieve a target residual concentration that must maintain contact with the effluent for a minimum time period — the CT value — before discharge. The challenge is that chlorine demand fluctuates with ammonia concentration, organic loading, temperature, and pH, which means a fixed dosing rate that works at 2 AM on a dry day will almost certainly under-dose or over-dose during a morning peak flow when the influent characteristics shift. Facilities that feed chlorine based on flow-proportional control alone consistently spend more on chemical costs than facilities using residual-based feedback loops.
UV System Failure Modes — What Actually Breaks
Reliability engineers who have tracked UV system performance over multiple permit cycles recognize that the catastrophic failures make up a small fraction of total downtime. The majority of permit-excursion risk comes from gradual degradation that goes unnoticed until an outfall sample comes back high.
UV lamps lose output intensity progressively over their operating hours. Most manufacturers specify an end-of-life threshold at which the lamp must be replaced, but facilities that wait for a lamp to fully fail before replacing it are running under-dosed for weeks or months before the failure becomes obvious. Group-replacing lamps based on cumulative operating hours rather than individual failure events is the only way to maintain consistent dose delivery across the entire bank.
Quartz sleeves that surround UV lamps accumulate mineral scaling and biological film over time, which blocks UV light transmission before it reaches the water. The rate of fouling depends on effluent hardness, alkalinity, and whether the facility has an upstream softening step. Automated cleaning systems help, but they do not eliminate fouling entirely — sleeves still require periodic manual inspection and chemical cleaning to restore transmittance, and the cleaning frequency should be driven by sensor data rather than a fixed schedule.
UV intensity sensors that monitor lamp output are the primary feedback mechanism for dose control, and they drift calibration over time due to fouling on the sensor window and inherent detector degradation. A sensor that reads 10 percent high gives operators false confidence that the dose is adequate when it is actually below the required threshold. Sensor calibration against a reference standard on a defined interval — and cross-checking sensor readings against actual effluent fecal coliform results — is the only reliable way to catch drift before it causes a compliance problem.
UV lamp ballasts and power supplies convert facility power to the high-voltage output lamps require, and these components degrade with thermal cycling and electrical stress. A failing ballast reduces lamp output without triggering an immediate alarm in many systems, so the reactor appears operational while delivering a reduced dose. Monitoring power supply input and output parameters as part of a preventive maintenance program catches this failure mode before it affects effluent quality.
Chlorination System Failure Modes — What Actually Breaks
Chlorination systems have fewer moving parts than UV reactors, but the failure modes they do have tend to be more disruptive because they affect chemical delivery directly and can cause both under-dosing violations and over-dosing events that create toxicity problems downstream.
Diaphragm meters pumps used for sodium hypochlorite feed lose accuracy as the diaphragm material degrades from chemical exposure and mechanical fatigue. The pump continues to stroke and appears operational, but the actual volume delivered per stroke drifts downward — meaning the system under-doses chlorine while the stroke counter suggests normal operation. This is why gravimetric feed checks, where the actual volume drawn from the chemical tank is measured over a timed interval, are essential on a weekly or biweekly basis rather than relying on pump stroke counts alone.
Sodium hypochlorite solutions lose available chlorine over time through decomposition, accelerated by heat, light exposure, and storage duration. A bulk tank delivered at 12.5 percent available chlorine can drop to 10 percent or lower within 60 days of delivery in warm climates, which means the dosing pump delivers the same volume but less actual chlorine. Facilities that do not track chemical age and strength through titration testing are feeding based on an assumed concentration that may no longer be accurate, resulting in consistent under-dosing that only shows up in effluent residual data trends.
Amperometric residual chlorine analyzers that provide the feedback signal for dose control are susceptible to electrode fouling from manganese, iron, and biological film in the sample stream. A fouled analyzer reads lower than the actual residual, which causes the control system to increase chlorine feed beyond what is necessary — driving up chemical costs and potentially creating a chlorine residual that exceeds the permit ceiling. Regular electrode cleaning and calibration against a handheld DPD test is the minimum maintenance standard, and many facilities are moving to automated cleaning cycles to reduce manual intervention.
Chemical injection nozzles and diffusers plug progressively from precipitated calcium carbonate, iron deposits, or crystallized hypochlorite solids. Plugging reduces the effective mixing and contact between chlorine and the effluent stream, creating localized zones of low residual even though the total chlorine mass feed rate appears adequate. Visual inspection of injection points during routine rounds, combined with differential pressure monitoring across the injection line where instrumentation is available, catches this before it affects contact basin performance.
UV vs Chlorination — Head-to-Head Comparison
Reliability engineers evaluating system performance or planning capital upgrades need a clear reference for how these two disinfection approaches differ across the factors that actually matter for day-to-day operations and permit compliance.
| Factor | UV Disinfection | Chlorination |
|---|---|---|
| Dose delivery method | UV light energy in mJ/cm2 | Chemical concentration in mg/L held for contact time |
| Primary variables affecting dose | Lamp intensity, UVT, flow rate, exposure time | Chlorine demand, residual target, contact time, temperature, pH |
| Most common gradual failure | Lamp aging and sleeve fouling reducing intensity | Chemical strength degradation and pump accuracy drift |
| Most common sudden failure | Power supply failure or lamp strike failure | Metering pump mechanical failure or chemical supply outage |
| Byproduct formation | None at typical wastewater doses | Trihalomethanes and haloacetic acids from precursor reactions |
| Effluent toxicity risk | None | Chlorine residual toxicity to aquatic life if dechlorination fails |
| Capital maintenance cost driver | Lamp replacement cycles and sleeve cleaning | Chemical procurement and pump rebuild schedules |
| Storm flow vulnerability | High — UVT drops and contact time shrinks simultaneously | Moderate — demand increases but contact time also shrinks |
AI Dose Control — How It Replaces Static Dose Tables
Most wastewater facilities still operate disinfection systems using dose tables that map a target dose to a flow rate and assume relatively constant water quality. AI dose control replaces this approach by continuously calculating the required dose from real-time sensor inputs and adjusting the system output — either UV lamp power or chlorine feed rate — to match the actual conditions in the effluent stream.
Operator looks up flow rate on a printed or spreadsheet-based dose table that correlates flow to a fixed UV power setting or chlorine feed rate.
System runs at that fixed setting until the next manual check, regardless of changes in water quality, temperature, or upstream treatment performance.
Effluent sampling results arrive 24 to 48 hours later, revealing whether the dose was actually adequate — by which point the conditions have already changed.
Sensors feed real-time data on flow, UV transmittance, turbidity, temperature, residual chlorine, and ammonia into a model that calculates the minimum dose required for compliance.
The model adjusts UV lamp power levels or chlorine pump output continuously — second by second — to match the calculated dose requirement as conditions change.
Historical effluent sample results continuously train and validate the model, improving prediction accuracy over time and flagging when sensor inputs diverge from expected ranges.
Maintenance Calendar — Organized by Failure Mode, Not Calendar Interval
The most effective disinfection maintenance programs are structured around the degradation curve of each component rather than a fixed calendar interval. A UV lamp that operates 4,000 hours per year needs replacement on a different schedule than one operating 8,000 hours, and a chemical storage tank in a hot climate degrades hypochlorite faster than one in a climate-controlled enclosure.
Gravimetric Pump Feed Check
Measure actual volume of sodium hypochlorite drawn from the bulk tank over a timed interval and compare to the pump stroke counter reading. A deviation greater than 5 percent triggers diaphragm inspection or replacement. This single check catches the most common cause of chronic under-dosing in chlorination systems and takes less than 15 minutes to perform.
Residual Analyzer Verification
Run a handheld DPD test on the same sample stream feeding the online residual analyzer and compare results. A deviation greater than 0.1 mg/L triggers electrode cleaning and recalibration. Cross-checking the analyzer against a manual test is the only way to detect the slow fouling drift that causes over-feeding and chemical cost waste.
UV Sensor Reference Check
Compare each UV intensity sensor reading against a portable reference sensor or a known-good spare sensor installed in the same position. Record the deviation and trend it over time to predict when calibration adjustment or replacement will be needed. Sensors that drift more than 5 percent from reference should be pulled for factory recalibration.
Chemical Strength Titration
Test the available chlorine concentration in the bulk storage tank using standard iodometric titration and compare to the delivery concentration documented on the shipping receipt. Calculate the decomposition rate and use it to project when the next bulk delivery should be scheduled to maintain minimum required strength. Facilities that skip this step consistently over-estimate their dosing accuracy.
UV Sleeve Inspection and Cleaning
Remove a representative sample of quartz sleeves from the reactor, inspect for scaling and biological film, measure transmittance through the cleaned sleeve versus a new reference sleeve, and clean or replace based on the transmittance loss percentage. This inspection determines whether the automated cleaning system is keeping up with fouling or whether the manual cleaning interval needs to be shortened.
UV Lamp Group Replacement
Replace all lamps in a bank or channel when the cumulative operating hours reach the manufacturer-recommended end-of-life threshold, regardless of whether individual lamps have failed. Group replacement ensures that all lamps in a channel deliver similar intensity, preventing the situation where a mix of new and heavily aged lamps creates uneven dose distribution across the reactor width.
NPDES Permit Compliance — What Gets Tested at the Outfall
Understanding exactly what parameters appear on the NPDES discharge permit for disinfection is critical because the maintenance program should be designed to keep the facility within those limits at all times, not just during scheduled sampling events.
The primary disinfection compliance parameter for most municipal NPDES permits. Typically expressed as a geometric mean of the most recent seven samples with a single-sample maximum, though permit language varies by state and receiving water classification. A single exceedance triggers increased monitoring frequency, and pattern exceedances can lead to enforcement action. The disinfection system must be designed and maintained to hold fecal coliform well below the geometric mean limit to provide margin for the inevitable variability in treatment performance.
For chlorination-dechlorination systems, the permit will specify a maximum total residual chlorine concentration at the outfall. Exceeding this limit creates acute toxicity to aquatic organisms in the receiving stream and is treated as seriously as a fecal coliform exceedance by most regulatory agencies. The dechlorination system — whether sulfite addition, carbonation, or UV reduction — must be maintained with the same rigor as the chlorination system because a dechlorination failure turns a properly disinfected effluent into a toxic discharge.
Some permits include TTHM limits at the outfall, particularly for facilities discharging to impaired waters or to water bodies with designated drinking water uses downstream. Trihalomethanes form when free chlorine reacts with natural organic matter in the effluent, and their formation rate increases with higher chlorine residuals, longer contact times, and higher precursor concentrations. Minimizing TTHM formation requires keeping the chlorine residual as low as possible while still meeting the fecal coliform limit — which is exactly what AI dose control is designed to do.
Disinfection compliance data should drive maintenance decisions, not sit in a filing cabinet until the next audit.
iFactory ingests UV sensor logs, chlorine residual trends, effluent sample results, and maintenance records into a single system that flags degradation patterns weeks before they become permit violations.
Storm Flow Vulnerability — Why Both Systems Struggle Simultaneously
Storm events create a compound risk for disinfection that catches facilities off guard because it degrades both UV and chlorination performance through different mechanisms at the same time. The reliability engineer who understands this compound effect can pre-position the maintenance and operational responses that prevent an exceedance.
Storm flows carry higher suspended solids and dissolved organics into secondary treatment, which reduces UV transmittance in the effluent. At the same time, higher flow rates reduce the hydraulic residence time inside the UV reactor, meaning each water parcel receives less exposure time. Lower transmittance and shorter exposure time compound to deliver a significantly reduced UV dose — often 30 to 50 percent below the dry-weather dose — at the exact moment when higher pathogen loading in the storm flow demands a higher dose. Facilities that do not have the ability to bring additional UV channels online or increase lamp power during storms are relying on safety margin that may not exist.
Storm flows increase chlorine demand through higher ammonia concentrations from inflow and infiltration, higher organic loading that consumes chlorine, and lower water temperatures that slow the disinfection kinetics. At the same time, higher flow rates reduce the contact time in the chlorine contact basin below the design CT value. The result is that the facility needs more chlorine to achieve the same kill, but has less time for it to work. Flow-proportional dose control that does not account for demand changes will under-dose during storms, and even residual-based control can lag behind rapidly changing conditions if the analyzer response time is slow relative to the rate of change.
An AI dose control system that receives flow, UVT, residual, temperature, and ammonia inputs can anticipate the compound effect of a storm event and begin adjusting dose delivery before the effluent quality actually degrades. The model recognizes the pattern of rising flow combined with dropping transmittance or rising demand and increases UV power or chlorine feed proactively rather than reactively waiting for the residual analyzer or UV sensor to show the dose deficit after it has already occurred. This predictive capability is the primary operational advantage of AI dose control over static or simple feedback control during the exact conditions that cause most permit exceedances.
CT Value Calculations — Where Facilities Get It Wrong
The CT concept is foundational to chlorination system design and permit compliance, but the way it is calculated in practice often diverges significantly from the way it is taught in treatment manuals. Reliability engineers who understand these divergences can identify compliance risks that operators and even permit writers sometimes miss.
CT is the product of the free residual chlorine concentration in mg/L and the contact time in minutes at a specific temperature and pH. The required CT value for a given log reduction of a target organism is specified in regulatory guidance, and the facility must demonstrate that it achieves at least that CT under all operating conditions, not just average conditions.
Contact time in a CT calculation must use the T10 value — the time at which 10 percent of the flow has passed through the contact basin — not the theoretical hydraulic residence time calculated by dividing basin volume by flow rate. Real contact basins have short-circuiting, dead zones, and velocity profiles that make the actual T10 significantly shorter than the theoretical residence time, often by a factor of 0.3 to 0.7 depending on basin geometry and baffle configuration. Facilities that calculate CT using theoretical residence time are overstating their actual disinfection performance.
CT required for a given log reduction increases as temperature decreases because chlorine disinfection kinetics slow in colder water. A facility that demonstrates compliance at 20 degrees Celsius may fail the same CT calculation at 5 degrees Celsius even with identical residual and contact time values. Winter operating conditions are often the governing case for CT compliance in northern climates, and facilities that sized their contact basins based on summer conditions may discover they cannot meet CT requirements during cold-weather high-flow events.
At higher pH values, a larger fraction of the total chlorine residual exists as the less-reactive hypochlorite ion rather than hypochlorous acid, which means a higher CT is required to achieve the same disinfection. Facilities that chlorinate to a fixed residual without monitoring pH may unknowingly operate below the required CT when pH spikes from upstream alkalinity addition or nitrification upsets in the secondary process.
Building a Disinfection Reliability Program — Three Pillars
The most effective disinfection reliability programs are built on three interconnected pillars that address the system holistically rather than treating maintenance, monitoring, and compliance as separate workstreams managed by different people.
Predictive Maintenance Based on Degradation Data
Every component in the disinfection system has a known degradation curve — lamps lose intensity at a predictable rate per operating hour, diaphragms lose accuracy at a predictable rate per stroke cycle, and chemical solutions decompose at a predictable rate per degree-day. A reliability program that tracks these degradation curves with actual operating data rather than assuming average conditions can predict component replacement dates with enough lead time to order parts and schedule labor without emergency overtime. The shift from calendar-based to condition-based maintenance for disinfection equipment consistently reduces both downtime and maintenance cost because components are replaced at the optimal point in their degradation curve rather than too early or too late.
Continuous Compliance Monitoring With Trend Analysis
Waiting for a permit exceedance to reveal a disinfection problem is like waiting for an engine to seize to reveal a lubrication problem. Continuous monitoring of the parameters that predict disinfection performance — UV intensity trends, sensor deviation trends, residual analyzer offset trends, chemical strength trends — allows the reliability engineer to see a compliance risk developing weeks before it produces a failed effluent sample. The key is trending the data over time rather than treating each reading as an independent pass-fail check, because gradual degradation only becomes visible when individual readings are plotted as a time series and compared against the degradation rate predicted by the maintenance schedule.
Storm Response Pre-Positioning
Most disinfection exceedances happen during storm events, which means the reliability program should include a defined storm response protocol that pre-positions the system for high-flow, low-quality conditions before they arrive. For UV systems, this means verifying that all standby channels are operational and can be brought online automatically, that lamp power can be increased to maximum output, and that the most recent sleeve cleaning has restored adequate transmittance. For chlorination systems, this means verifying that chemical storage is at maximum level with fresh product, that all standby pumps are operational, and that the dechlorination system has adequate sulfite supply and injection capacity to handle the increased chlorine feed rate. A storm response checklist reviewed and verified before each storm season is far more valuable than a reactive scramble when the rain starts falling.
Frequently Asked Questions
Can AI dose control be retrofitted to an existing UV or chlorination system, or does it require a capital upgrade?
AI dose control in most cases does not require replacing the existing disinfection equipment. The AI model sits between the existing sensors and the existing control system, taking the same real-time inputs that are already available — flow, UVT, residual, temperature — and calculating an optimized setpoint that the existing control system executes. What changes is the logic that determines the setpoint, not the hardware that delivers the dose. Facilities that already have SCADA systems logging sensor data at one-second or faster intervals have most of the infrastructure needed. The gap is usually the analytics layer that turns raw sensor data into optimized control decisions, which is what iFactory provides. Book a demo to see how this works with your existing system.
How much chemical cost reduction can a facility realistically expect from AI dose control?
Facilities that switch from static dose tables or simple flow-proportional control to AI-optimized residual-based control typically report chemical cost reductions in the range of 15 to 30 percent for chlorination systems, with the exact figure depending on how much safety margin was built into the previous dosing strategy. Facilities that were significantly over-dosing to compensate for uncertain demand conditions see the largest savings because the AI model targets the minimum effective dose rather than the maximum safe dose. UV systems see energy cost reductions in a similar range because lamp power is reduced during periods of high transmittance and low flow rather than running at full power continuously. The savings compound over time because the model improves its predictions as it accumulates more operating data. Contact support to discuss what savings are realistic for your specific operating conditions.
What is the single most impactful maintenance task for preventing disinfection permit exceedances?
For chlorination systems, the gravimetric pump feed check performed weekly is the single most impactful task because it directly verifies that the chemical delivery system is actually putting the right amount of chlorine into the effluent. Every other maintenance task on a chlorination system assumes that the pump is delivering accurately, and if that assumption is wrong, everything downstream of it — residual monitoring, CT calculations, permit compliance — is built on a false foundation. For UV systems, the equivalent task is the monthly sensor reference check, because a drifting sensor that reads high gives operators a false sense of security while the actual dose delivered is below the required threshold. Both tasks take less than 30 minutes to perform and both catch failure modes that would otherwise go undetected until an effluent sample fails.
How does a facility determine whether its contact basin T10 value is accurate for CT calculations?
The only reliable method for determining T10 is a tracer study, where a conservative tracer such as fluoride or lithium is injected at the basin inlet and the concentration is measured at the outlet over time to produce a residence time distribution curve. The T10 value is the time at which the tracer concentration at the outlet reaches 10 percent of the inlet concentration. Many facilities have never conducted a tracer study and are using the theoretical residence time divided by an assumed baffling factor from a table in a design manual, which can overstate T10 by a significant margin if the actual basin geometry differs from the assumed baffle configuration. A tracer study is a one-time investment that provides a compliance-critical data point for the life of the basin, and it should be repeated if any physical modifications are made to the basin internals.
Should a facility with both UV and chlorination run both systems simultaneously or use one as backup?
The answer depends on the permit requirements and the facility risk tolerance, but the most common configuration for facilities that have both systems is to operate one as the primary disinfection method and maintain the other as a standby that can be brought online quickly if the primary system experiences a failure or if effluent quality degrades beyond what the primary system can handle. Running both simultaneously is generally not cost-effective unless the permit requires multiple barriers or the receiving water has exceptional sensitivity. The key reliability consideration is that the standby system must be maintained in a state of operational readiness — which means it needs its own maintenance schedule, not a deferred maintenance schedule that assumes it will never be called on. A standby chlorination system with stale chemical and a pump that has not been exercised in months is not a reliable backup. Book a demo to see how iFactory tracks standby system readiness alongside primary system performance.
UV intensity logs, chlorine residual trends, effluent sample results, and maintenance records in one system — not four different spreadsheets managed by four different people.
iFactory connects the sensor data, maintenance schedules, and compliance records that reliability engineers need to keep disinfection systems within permit limits without scrambling after every storm event or sample result.