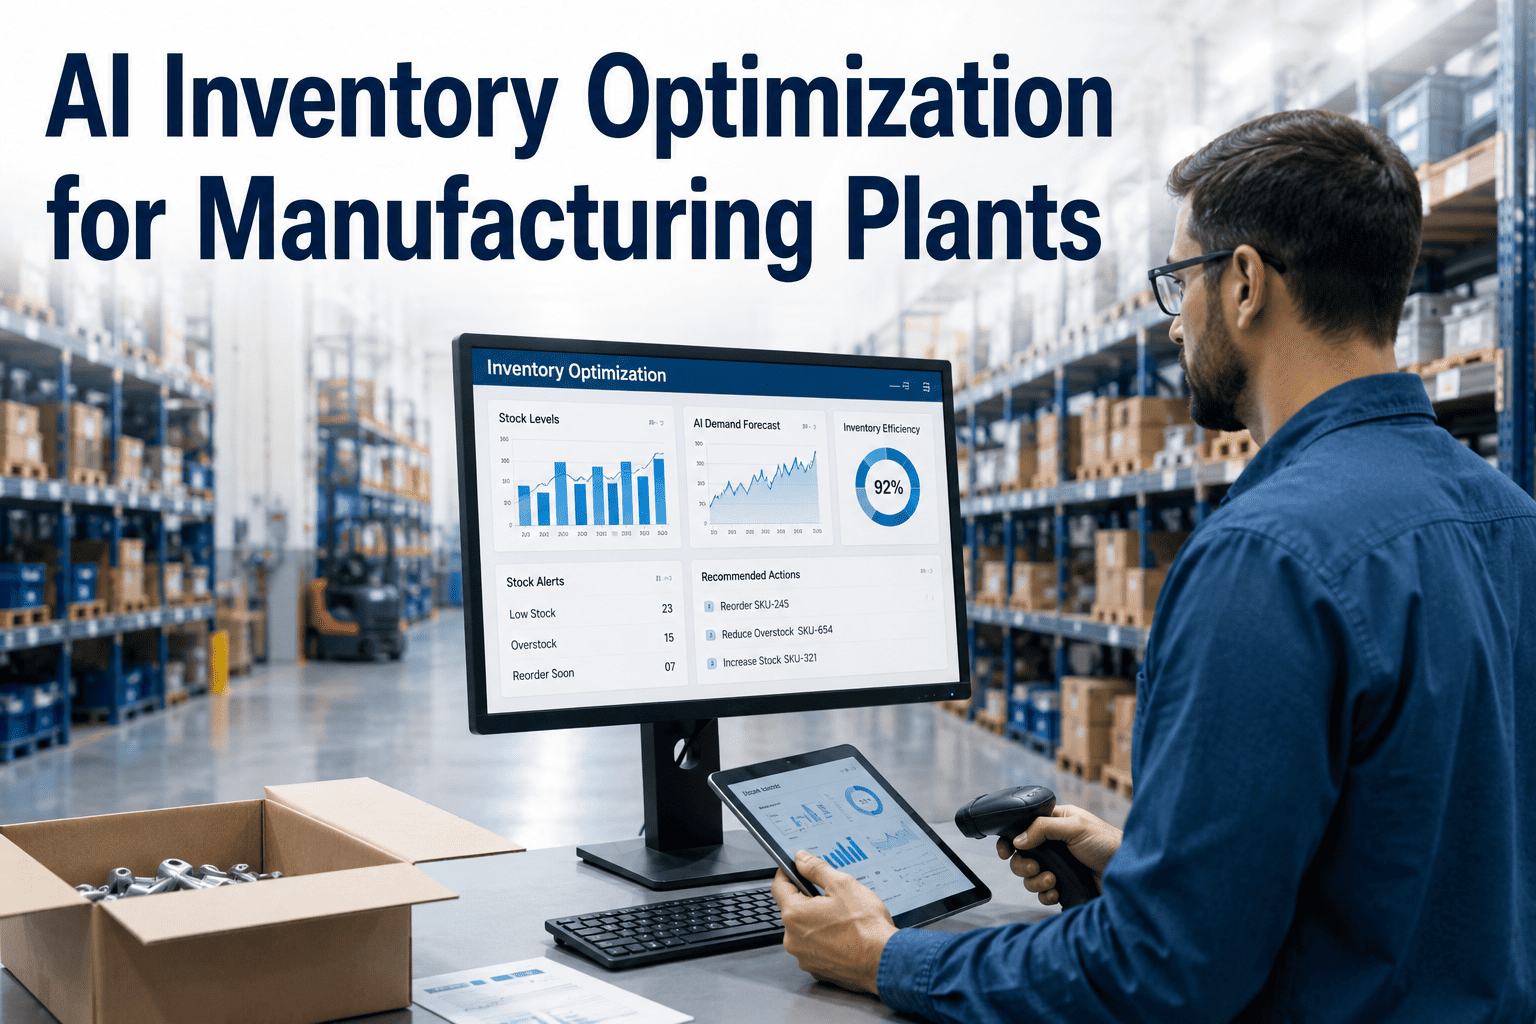
Every stockout on the plant floor and every pallet of slow-moving material sitting in the warehouse traces back to the same root cause: a forecast that missed. Supply chain directors running manufacturing operations have relied for decades on twelve-month historical averages and static min or max reorder points, models built for a world where demand moved slowly and predictably. That world is gone. Tariff volatility, compressed product lifecycles, and increasingly customized order patterns have exposed how fragile traditional forecasting really is, and the gap between what a spreadsheet predicts and what actually ships is now measured in millions of dollars of tied-up working capital. iFactory AI's demand forecasting platform closes that gap by learning directly from consumption history, production schedules, and supplier lead time variability.
The Real Cost of Forecasting Blind in Manufacturing
The average manufacturing plant carries roughly 20 to 30 percent more inventory than actual demand requires, while simultaneously logging anywhere from 5 to 15 stockout events per month that stall production schedules and delay customer shipments. Both problems come from the same source: a forecasting method that treats next month's demand as a repeat of last year's average, ignoring changeover sequences, promotional activity, and the demand-sensing signals a modern plant already generates every day. Supply chain directors feel this most acutely during peak season transitions, new product ramp-ups, and any period of tariff-driven or supplier-driven volatility, when static reorder points are furthest from reality.
The pattern above holds across independently reviewed manufacturing and retail benchmarks: AI-driven ensemble models consistently land in the 8 to 15 percent MAPE range, while historical-average and static min-max methods run 20 to 45 percent depending on how volatile the SKU is. The gap is widest exactly where the financial exposure is highest — promotional, seasonal, and new-product SKUs — because these are the patterns traditional statistical methods were never designed to capture. Reducing that gap is the single highest-leverage lever a supply chain director has for improving service levels without adding inventory. See how the same modeling approach performs against your own SKU portfolio by scheduling a forecast accuracy assessment.
How AI Demand Forecasting Models Actually Work
Ingest Consumption, Production, and Lead Time Data
The model pulls historical sales and consumption history, current production schedules and work orders from MES or ERP, supplier lead time performance, and inventory positions across every location. Unlike a manual forecast rebuilt monthly from a spreadsheet, this data connection runs continuously, so the model always sees the most current picture of demand and supply.
Detect Patterns With an Ensemble of Models
Rather than forcing every SKU through a single algorithm, an ensemble approach tests statistical methods and machine learning methods per SKU and automatically selects whichever performs best against that item's actual demand pattern — stable, seasonal, promotional, or intermittent. This is why ensemble platforms outperform single-model tools across a mixed SKU portfolio.
Recalculate Forecasts and Safety Stock Continuously
Safety stock stops being a static number set once a quarter. The model recalculates buffer levels daily per SKU per location, factoring in demand volatility, lead time variance, and service level targets — shrinking buffers on stable items to free capital and growing them on volatile items to protect service levels, simultaneously.
Push Forecasts Into Planning and Procurement Execution
The forecast output feeds directly into production scheduling and purchasing recommendations, converting demand predictions into material requirements against current bills of materials. Planners review exceptions rather than rebuilding forecasts from scratch, and every variance between forecast and actual becomes training data that improves the next cycle.
Forecasting Methods Compared: From Naive Averages to AI Ensembles
Not every forecasting method is built for the same job, and supply chain directors evaluating a platform should understand what each approach can and cannot do before comparing accuracy claims. The table below summarizes typical MAPE performance and where each method fits within a manufacturing planning process.
| Forecasting Method | Typical MAPE Range | Best Fit | Key Limitation |
|---|---|---|---|
| Naive / Historical Average | 35–45% | Extremely stable, low-mix production with no seasonality | Cannot react to trend, seasonality, or schedule changes |
| Moving Average / Static Min-Max | 30–40% | Simple reorder-point inventory with low SKU complexity | Buffers set manually; ignores lead time variability |
| Exponential Smoothing / ARIMA | 20–35% | SKUs with clear, consistent seasonal or trend patterns | Degrades quickly on promotional or causal-demand SKUs |
| Machine Learning Ensemble (Gradient Boosting) | 8–15% | Mixed SKU portfolios with promotional and volatile demand | Requires clean, connected historical and schedule data |
| Hybrid Statistical + ML with Production Schedule Integration | 8–12% | Manufacturing environments with MES/ERP-connected planning | Needs upfront integration work to reach full accuracy |
Where AI Forecasting Delivers the Biggest Wins
AI forecasting does not improve every SKU equally, and platforms that claim universal accuracy gains across an entire portfolio are overstating the case. The largest, most consistent improvements show up in specific demand patterns — understanding where your own portfolio falls determines how much accuracy gain to actually expect.
Items influenced by pricing changes, promotions, or recurring seasonal cycles see the largest MAPE improvement, since ML methods capture non-linear promotional lift that statistical models systematically miss.
Aggregating demand signals across production lines and locations into a unified forecast enables consolidated purchasing and identifies overlap that a single-plant view cannot see.
Dynamic, SKU-level safety stock recalculation typically reduces total inventory investment while simultaneously raising service levels, a combination static buffers cannot achieve.
When forecasts are generated directly from upcoming production schedules and current bills of materials, purchasing timing aligns to actual production starts instead of lagging indicators.
Is Your Plant Ready for AI Demand Forecasting? A Readiness Checklist
Before evaluating platforms, supply chain directors should confirm the operational and data readiness that determines how quickly a deployment reaches full accuracy. The checklist below reflects the readiness factors that most consistently separate fast, successful rollouts from stalled pilots.
Models need enough history to distinguish trend and seasonality from noise; shorter histories can still work for stable SKUs but reduce accuracy on volatile ones.
Connecting the forecast engine to upcoming schedules, not just past shipments, is what enables material-level demand sensing ahead of production starts.
Accurate BOMs let the platform translate production targets directly into raw material and component requirements without manual conversion.
Dynamic safety stock calculations require a target service level input; without it the model defaults to a blanket assumption that under-serves critical SKUs.
Successful rollouts typically start with a bounded pilot that compares AI forecast accuracy against the current process before expanding company-wide.
Supply Chain Director Perspective
I have run supply chain planning for manufacturing operations for over 19 years, and the shift that changed my team's day-to-day the most was not a new ERP module — it was moving safety stock off a quarterly spreadsheet calculation and onto a model that recalculates it every day. Before we deployed iFactory AI's forecasting platform, our team was managing roughly 3,200 active SKUs across four plants using a static min-max system that had not been meaningfully revised in over five years. Our MAPE on promotional and new-product SKUs was averaging close to 40 percent, and we were carrying almost a third more inventory than our actual consumption justified just to protect service levels. Within the first two quarters after connecting the platform to our MES and historical consumption data, our blended MAPE across the portfolio dropped into the 11 to 14 percent range, stockout events fell by more than half, and we freed enough working capital to fund a warehouse automation project that had been shelved for two years. The part that surprised me most was not the accuracy improvement itself — it was how much planner time came back. My team was spending close to 40 percent of its week rebuilding forecasts manually in spreadsheets; that dropped to reviewing exceptions the model flagged, which meant we could finally spend time on supplier negotiation and network design instead of reactive firefighting. For any supply chain director still running planning off historical averages: the cost of staying on the old method is not neutral, it compounds every quarter in tied-up capital and missed service targets.
— Supply Chain Director, Multi-Plant Industrial Components Manufacturer — 19 Years Industry Experience — iFactory AI Reference Customer 2026Conclusion
The accuracy gap between traditional and AI-driven demand forecasting is no longer a marginal improvement — for promotional, seasonal, and new-product SKUs, it routinely represents 20 to 30 percentage points of MAPE, which translates directly into fewer stockouts, less excess inventory, and materially more working capital available for other priorities. Supply chain directors who wait for demand volatility to stabilize before modernizing their forecasting process are waiting for a condition that current market dynamics make unlikely to return.
iFactory AI's platform connects directly to the MES, ERP, and inventory systems manufacturing supply chain teams already run, applying ensemble forecasting models to actual consumption history and live production schedules rather than static assumptions. The result is a forecast that gets more accurate every planning cycle instead of drifting further from reality. Book a Demo to see AI demand forecasting benchmarked against your own plant's data.
Frequently Asked Questions
Most manufacturing deployments see MAPE fall from a traditional range of 35 to 45 percent down to 8 to 15 percent, though the improvement varies significantly by SKU pattern. Stable, low-variability items see the smallest gains since statistical methods already perform reasonably well there, while promotional, seasonal, and new-product SKUs typically see the largest gains, often 20 to 30 percentage points. iFactory AI's platform reports MAPE at the SKU level rather than as a single portfolio average, so you can see exactly where the improvement is concentrated. Book a Demo to get an accuracy benchmark run against your own SKU portfolio.
Most ERP forecasting modules rely on a single statistical method, typically moving averages or basic exponential smoothing, applied uniformly across the SKU portfolio and recalculated on a periodic cycle, often monthly or quarterly. AI demand forecasting applies an ensemble of statistical and machine learning methods selected per SKU based on which performs best for that item's demand pattern, and recalculates continuously as new consumption and schedule data arrives rather than waiting for the next planning cycle. iFactory AI integrates with your existing ERP rather than replacing it, layering AI-driven accuracy on top of the system your team already uses daily.
A functional deployment generally requires 12 to 24 months of historical consumption or sales data per SKU, current production schedules and work orders from MES or ERP, up-to-date bills of materials, supplier lead time history, and current inventory positions across all storage locations. Data quality matters more than data volume — inconsistent SKU coding or incomplete transaction history will limit model accuracy regardless of how much history is available. iFactory AI's onboarding process includes a data readiness review before deployment begins; contact support for a checklist specific to your systems.
Promotion-driven SKUs, seasonal items, causal-demand SKUs affected by external factors like weather or events, and new product introductions typically see the largest accuracy gains, often 5 to 12 percentage points of MAPE improvement or more. Highly stable baseline SKUs with predictable, low-variability demand see smaller improvements since traditional statistical methods already perform adequately there, and very low-volume intermittent-demand SKUs offer limited pattern signal for any model to learn from. A platform using ensemble methods with automatic per-SKU model selection, like iFactory AI's, delivers more consistent results across a mixed portfolio than a single-method tool applied uniformly.
Manufacturers typically see measurable stockout reduction within the first 90 days of deployment, with documented ranges of 40 to 65 percent fewer stockout events, and inventory carrying cost reductions of 20 to 35 percent working capital freed emerging over the following two to three planning cycles as safety stock recalibrates per SKU. Full-scale ROI, including production scheduling efficiency and reduced manual planning time, generally becomes clear within two to three quarters. iFactory AI's platform typically deploys across an existing manufacturing facility in 8 to 12 weeks. Book a Demo to discuss a realistic ROI timeline for your specific plant and SKU portfolio.