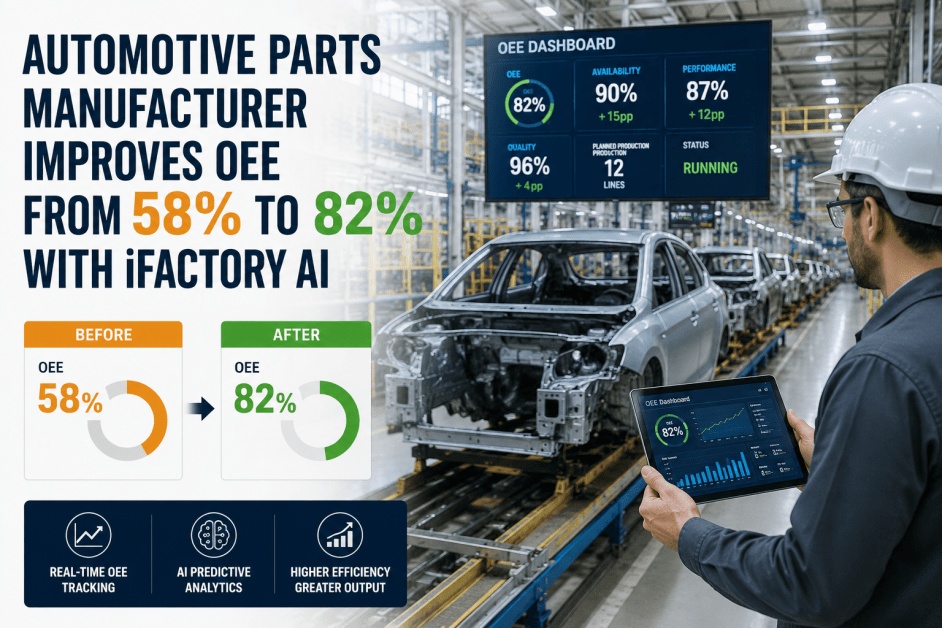
Automotive Parts Manufacturer Improves OEE from 58% to 82% with iFactory AI
By Hannah Baker on June 9, 2026
The numbers told a story no one wanted to read. Twelve production lines turning out automotive parts around the clock, and overall equipment effectiveness sitting at 58% — a figure the plant manager knew was leaving margin on the floor, but no one could explain exactly why. Utilization reports showed machines running, maintenance logs showed work getting done, and shifts were hitting their numbers some days and missing them by wide margins on others. The data was there, but it lived in silos: the line supervisors tracked throughput in spreadsheets, the maintenance team worked off a separate CMMS and quality data arrived days later in a PDF. No one had a single view of what was really happening on the floor. The plant had tried lean initiatives, shifted schedules, added overtime — but OEE stayed stuck in the mid-fifties. That is when the operations director decided to stop guessing and put a real-time production monitoring system in place: iFactory AI.
Case Study — Automotive Parts Manufacturing
From 58% to 82% OEE: How AI-Powered Monitoring Unlocked 24 Points of Capacity
A 12-line automotive parts plant recovered 41% more effective capacity in under six months — not by adding equipment, but by seeing the floor in real time, predicting failures before they stopped production, and giving every shift a single source of truth for performance.
The Baseline: Fifty-Eight Percent and No Clear Reason Why
The plant manufactured stamped and assembled components for Tier 1 automotive suppliers — brackets, mounting plates, and structural subassemblies running across twelve transfer presses and assembly lines. The published OEE of 58% came from end-of-month calculations built from operator logs and maintenance records that were reconciled days after the fact. By the time a problem surfaced in the numbers, the shift that owned it was three rotations gone.
Three patterns kept appearing in the noise. First, availability ran at 72% because minor stops — sensor faults, feed jams, misaligned blanks — were treated as shift-to-shift nuisance events rather than tracked as a cumulative drain. Second, performance hovered near 80% because line speed was set conservatively to avoid those stops, and no one had real-time visibility into whether the line was actually running at target. Third, quality-first pass yield ran at 90%, but the defects that did occur were not correlated back to the machine state or operator at the time of the event. The plant had the data to improve; it just could not connect the dots fast enough.
Metric
Baseline
Target
Gap
OEE (Overall Equipment Effectiveness)
58%
85%
27 pts
Availability
72%
90%
18 pts
Performance
80%
95%
15 pts
First-Pass Yield
90%
97%
7 pts
Unplanned Downtime / Shift
47 min
<15 min
32 min
Why Spreadsheets and Siloed Data Could Not Fix It
The plant had invested in a CMMS for maintenance and an ERP for production planning, but neither tool was designed to answer the question that mattered most: what is happening on the floor right now? The CMMS tracked work orders after the fact; the ERP updated at the end of each batch. In between, the line ran blind.
The operations director described the problem this way: "We had a room full of smart people making decisions based on data that was three days old. We were fighting last week's fires while this week's problems built up behind us." The missing piece was a real-time layer that could ingest signals from the plant floor — PLC cycle counts, sensor states, production tallies — and translate them into OEE, downtime, and performance metrics that every shift could act on immediately.
Before iFactory AI
Reactive, delayed, fragmented
OEE calculated end-of-month from operator logs
Downtime tracked on paper clipboards
Quality data arrived 2–3 days late
Maintenance was reactive, not predictive
No correlation between stops and root cause
With iFactory AI
Real-time, unified, predictive
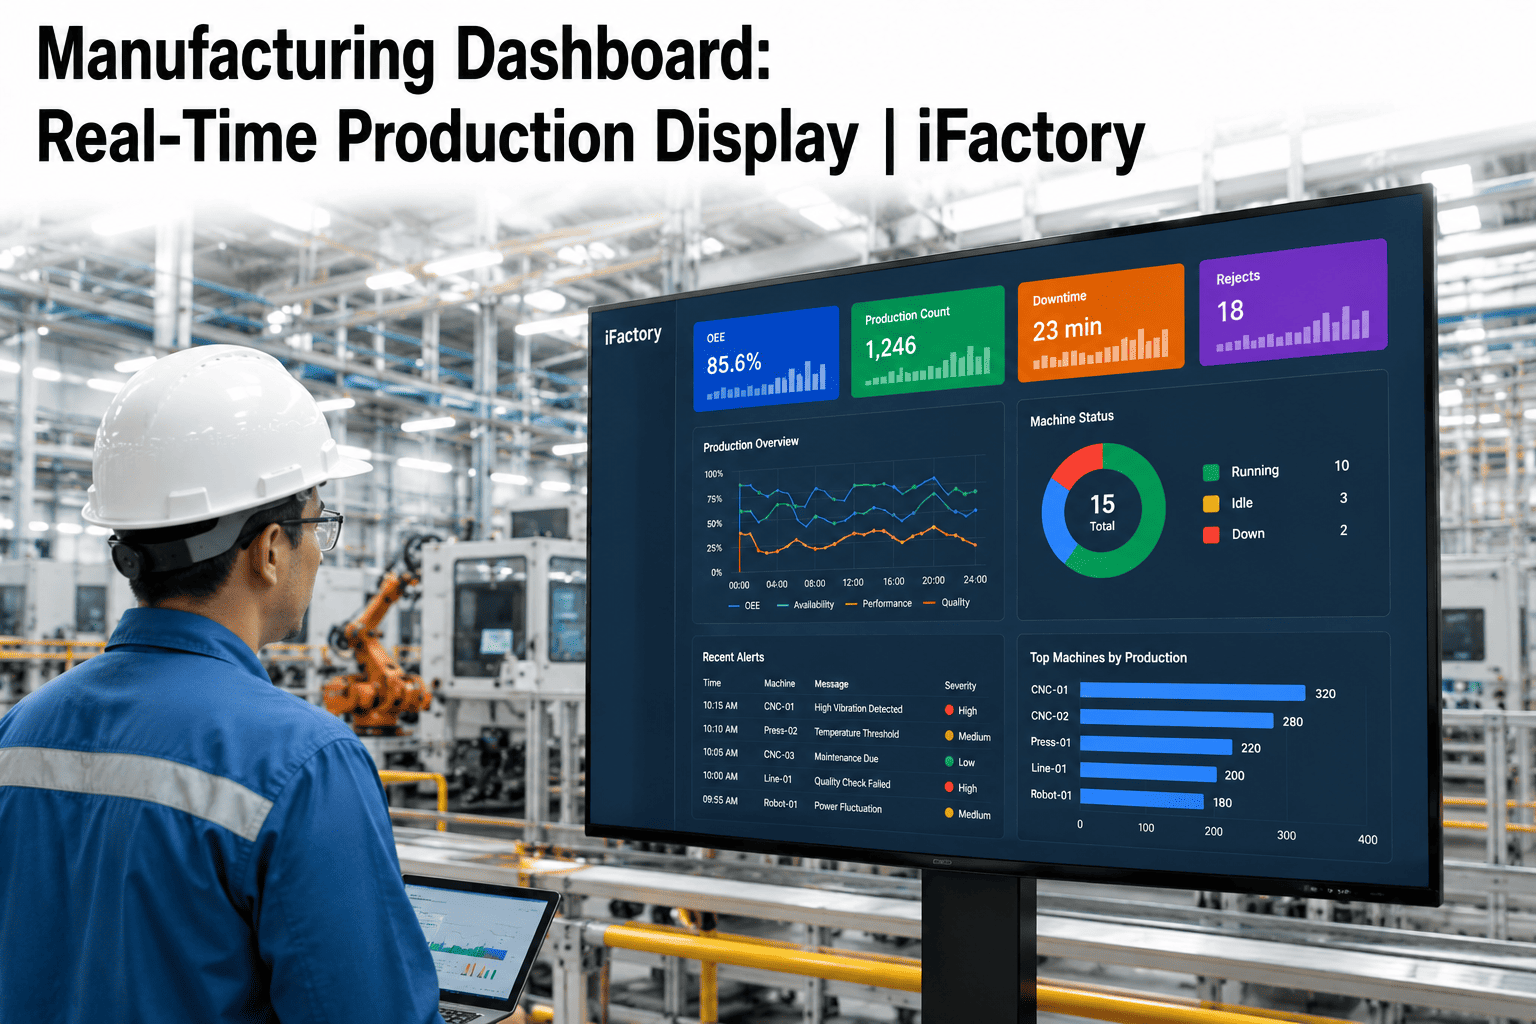
OEE updated every cycle in a live dashboard
Downtime auto-classified by cause in seconds
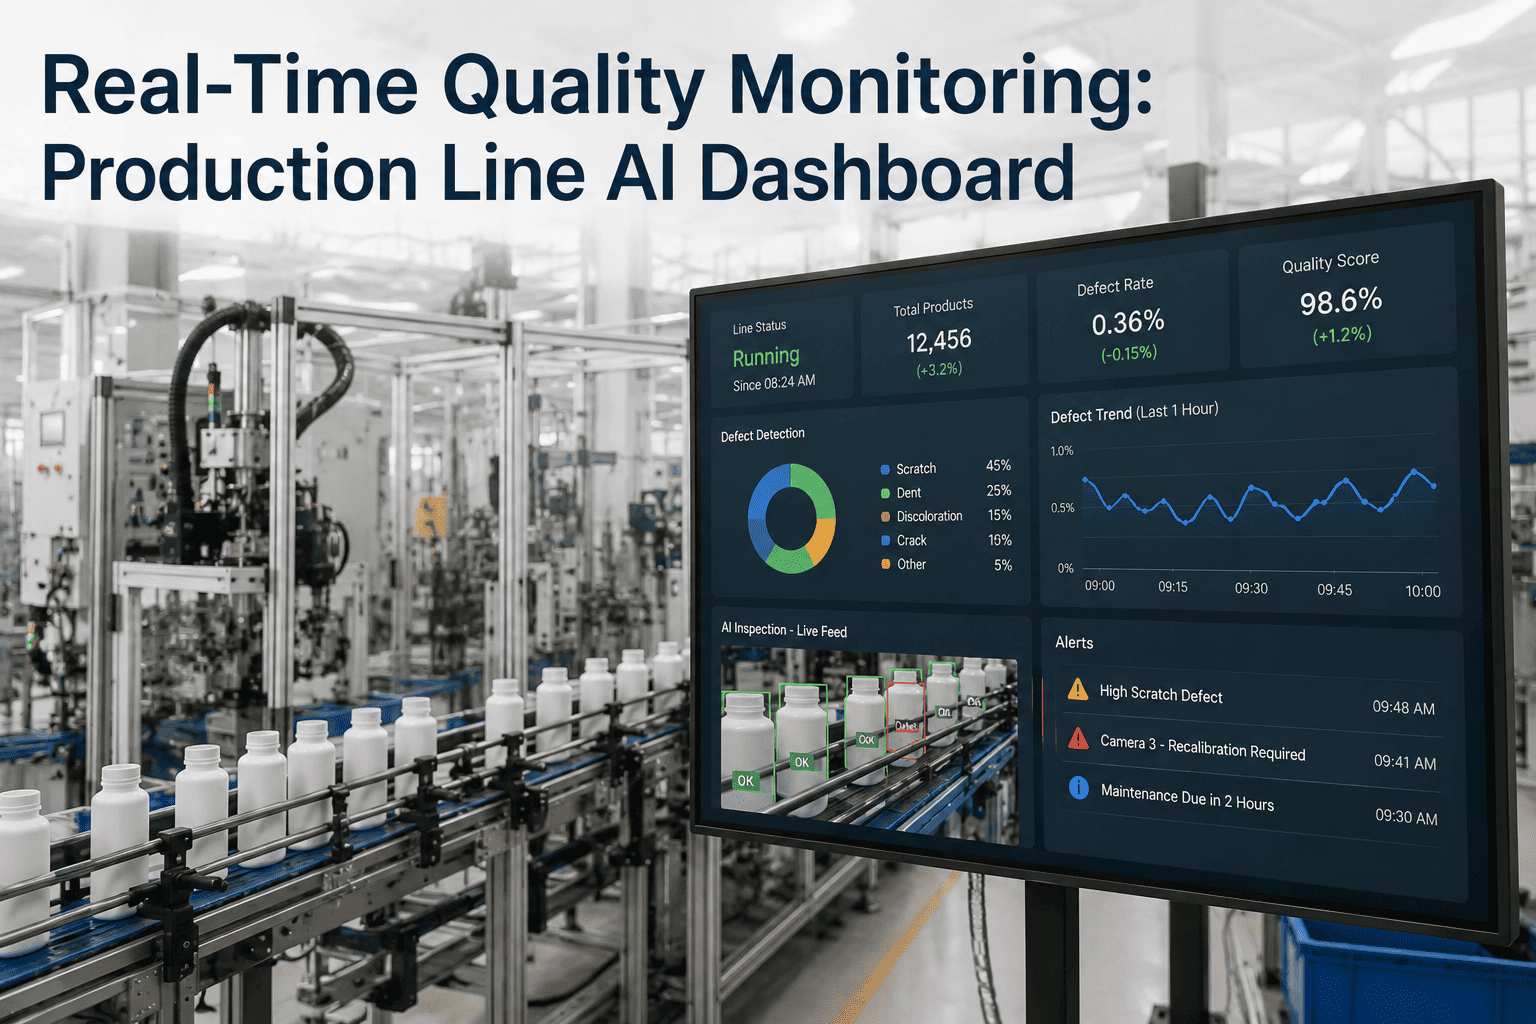
Quality defects flagged and correlated instantly
Predictive alerts before failures occurred
Root cause visible with two clicks
See what real-time OEE looks like on your own data.
We will walk through a live dashboard built for an automotive production floor.
How iFactory AI Closed the Gap: A Three-Phase Deployment
The implementation followed a structured three-phase rollout designed to deliver quick wins while building toward full plant-wide coverage. Each phase addressed a specific layer of the OEE equation.
Phase 1
Connect & Visualize (Weeks 1–4)
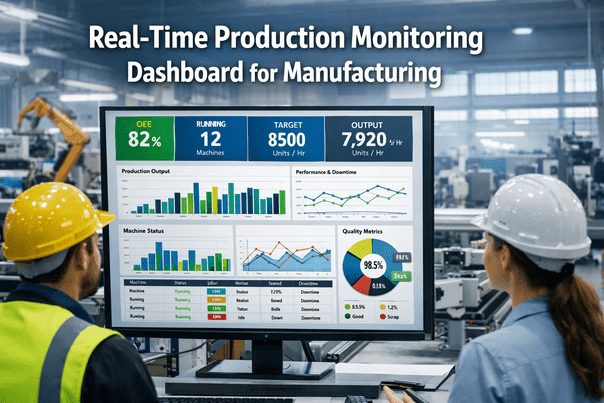
iFactory AI connected to existing PLCs and sensors across all twelve lines. The real-time OEE dashboard went live with zero additional hardware — just a data layer on top of the control architecture already on the floor. Every operator station displayed live availability, performance, and quality metrics for the first time.
Phase 2
Classify & Predict (Weeks 5–10)
With baseline data flowing, the system's AI models learned the signature of each line's normal operation — cycle times, vibration patterns, temperature bands — and began flagging anomalies before they became failures. Minor stops that had been written off as "operator error" were traced to a worn guide rail on press line 4 and a misconfigured sensor on line 7.
Phase 3
Optimize & Sustain (Weeks 10–24)
Cross-functional teams used the dashboard to run weekly OEE reviews with actual data instead of estimates. Standard operating procedures were updated based on the patterns the system revealed. By week 24, the improvement had stabilized and the plant was sustaining 80–82% OEE without additional intervention.
What Changed: The 24-Point Breakdown
The gain from 58% to 82% did not come from any single fix. It was the cumulative effect of seeing the floor clearly and responding faster. Here is how the three OEE components moved:
72% → 88%
Availability
Unplanned downtime dropped from 47 to 14 minutes per shift. Predictive alerts caught bearing wear on two transfer presses and a hydraulic leak on an assembly station before any of them caused a line stop. The minor-stop category — sensor faults, feed jams, misaligned blanks — was cut in half once operators could see the cumulative time those events consumed.
80% → 93%
Performance
With real-time speed monitoring, line supervisors could see exactly when a line was running below target rate and intervene immediately. The root cause turned out to be a mismatch between line speed settings and actual material feed rates on two older presses — a problem that had been hiding in plain sight for years.
90% → 96%
First-Pass Yield
Quality defects were correlated to machine parameters at the time of occurrence. The system identified that a specific temperature drift on press line 3 was responsible for a recurring dimensional deviation. Adjusting the preheat cycle reclaimed 5 points of first-pass yield in two weeks.
Expert Review: Why This Case Study Matters
Mark Delaney
Director of Manufacturing Engineering — 22 years in automotive production
"An OEE jump of 24 points in under six months is the kind of result I have seen in theory but rarely in practice. What makes this case study credible is the structured three-phase approach — connecting the data first, then applying prediction, then using the insights to change how the team operates. Too many plants buy a dashboard and expect improvement to follow automatically. This plant treated the tool as the foundation for a new operating rhythm, and that is what made the number move. The 82% OEE is sustainable because the process changed, not just the software."
Conclusion: The Real ROI Was Not Just OEE
By the end of month six, the plant was running at 82% OEE — a 41% improvement in effective capacity from the same assets. The capital avoided by not buying additional presses or adding a shift was significant, but the operations director pointed to a different metric: the confidence the team now had in its own data. Shift handoffs no longer started with guesswork about what happened on the previous watch. Maintenance no longer waited for a breakdown to act. Quality issues were caught at the machine instead of the customer dock.
Every manufacturing plant has hidden capacity. The question is whether you have the visibility to find it before it finds you. Book a demo and see how much OEE your floor is leaving on the table.
Stop Guessing. Start Seeing.
Recover Your Hidden Capacity
We will build a live OEE dashboard against your plant's data in a short working session. No hardware to buy, no long implementation — just the real picture of what your lines are actually delivering and where the gap is.
How quickly can a plant see OEE improvement after deploying iFactory AI?
Most plants see measurable improvement within the first 60 days. Phase 1 (connect and visualize) typically takes four weeks and immediately reveals the biggest downtime and performance gaps. By the end of month three, predictive alerts and root-cause correlations begin reducing unplanned stops. The full 24-point gain documented in this case study stabilized by month six.
Do we need new hardware or sensors to use iFactory AI for OEE tracking?
No. iFactory AI connects to your existing PLCs, sensors, and control architecture. The platform is designed as a data layer that sits on top of what you already have. In cases where older equipment lacks digital outputs, we can integrate through low-cost edge devices, but the majority of automotive plants already have the infrastructure in place.
What makes this different from the OEE module built into our ERP or CMMS?
ERP and CMMS platforms calculate OEE from data entered after the fact — operator logs, end-of-batch entries, manually reconciled downtime records. iFactory AI calculates OEE in real time from machine signals captured at the cycle level. The difference is not just speed; it is accuracy. Real-time data eliminates the rounding, estimates, and delayed entries that make traditional OEE numbers a rough approximation rather than a reliable metric.
How does iFactory AI handle the quality component of OEE?
First-pass yield and defect data can be ingested directly from vision inspection systems, gauging stations, or PLC-based pass-fail signals. If manual inspections are part of the process, the platform supports tablet or scan-gun entry at the point of inspection. The key advantage is correlation: once quality data flows in real time, iFactory AI links every defect to the machine state, operator, and batch parameters that were active when the defect occurred.
Can this work in a plant with mixed automation — some robotic lines and some manual assembly?
Yes. iFactory AI is designed for mixed-mode production environments. Automated lines stream data via PLC; manual stations can be instrumented with cycle-count buttons, barcode scanners, or vision-based activity detection. The platform normalizes all sources into a single OEE calculation so you get a consistent metric across the entire plant floor regardless of automation level.