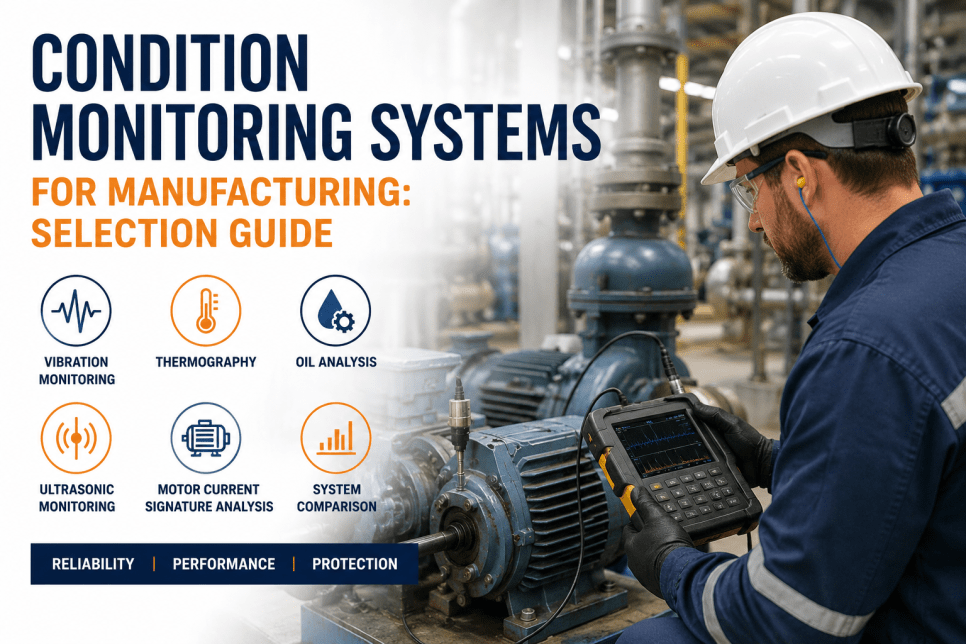
Most manufacturing plants do not fail at condition monitoring because the sensors are wrong. They fail because nobody decided, in writing, which of the four hundred motors, pumps, gearboxes, and compressors on the floor actually deserve a sensor in the first place. A condition monitoring program built without a criticality tier collapses within a year under alert fatigue, orphaned data, and a maintenance team that has quietly gone back to run-to-failure. This guide walks through the exact sequence — asset selection, technology matching, route design, and analyst readiness — that separates a program still running five years later from one that got shelved after the pilot. If your plant is scoping its first program or trying to rescue a stalled one, book a program design session with iFactory before you buy another sensor.
Build a Condition Monitoring Program That Survives Past the Pilot
Critical asset tiering, technology selection, monitoring routes, and analyst training — sequenced the way reliability leaders who actually scale their programs do it, not the way a sensor catalog sells it.
Why Most Condition Monitoring Programs Stall After Year One
A program that starts with a sensor purchase order instead of an asset criticality study almost always ends the same way: dashboards nobody checks, alarms nobody trusts, and a budget line item that gets questioned at the next capital review. The numbers below explain why sequencing matters more than any individual sensor spec.
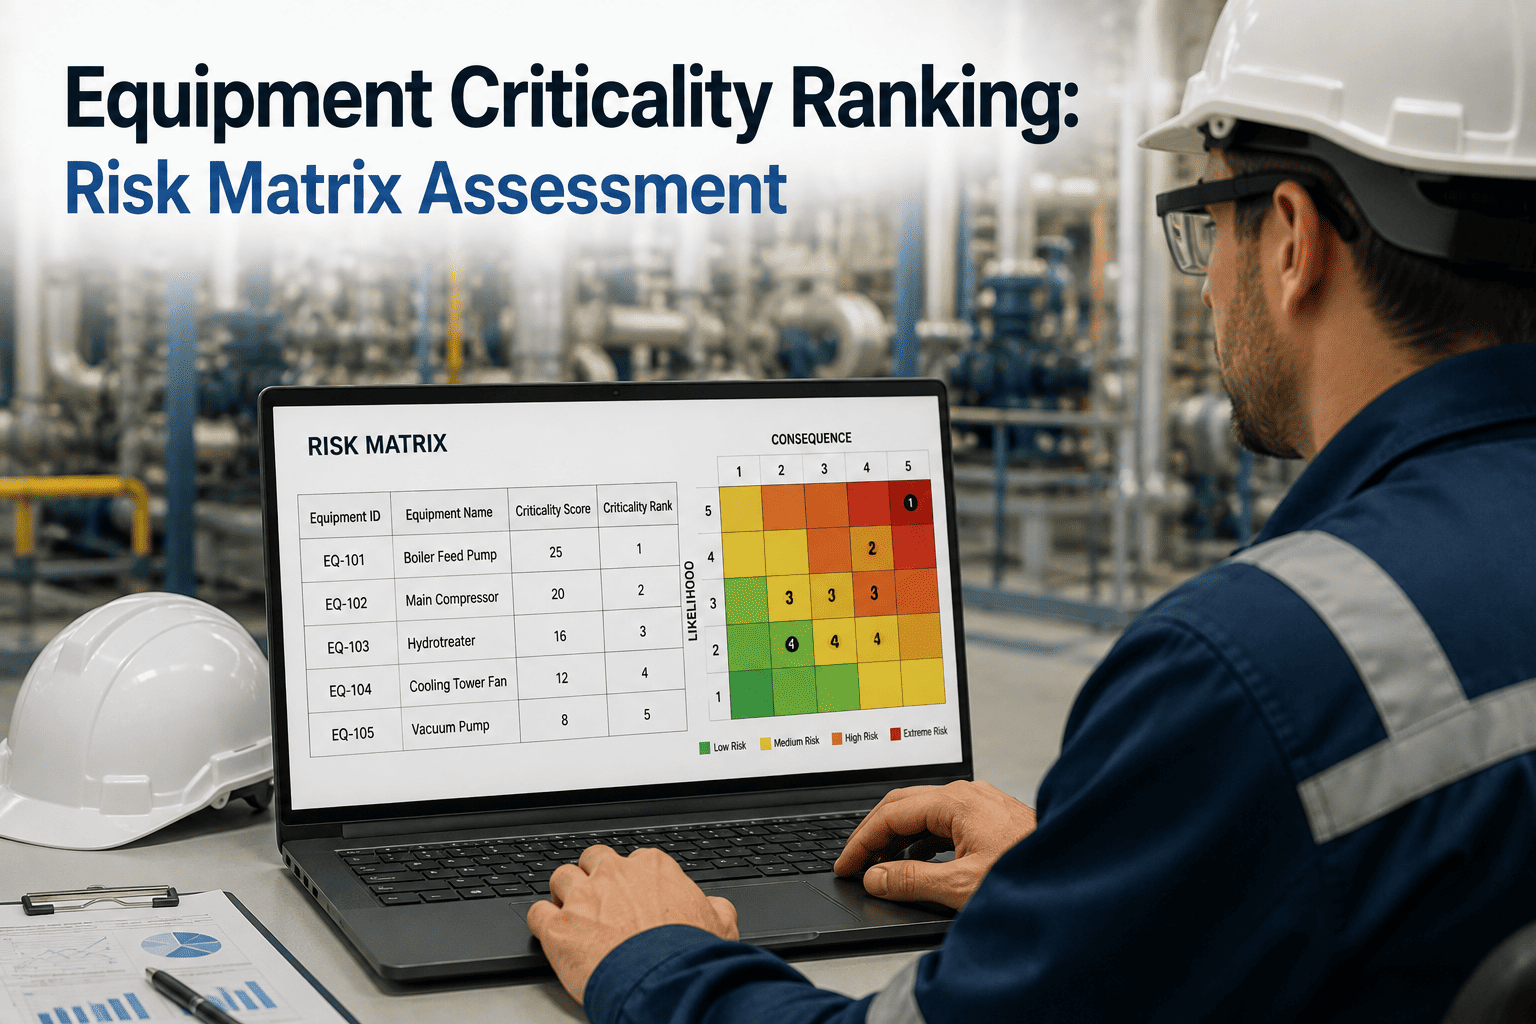
Step One: Build the Asset Criticality Tier Before Anything Else
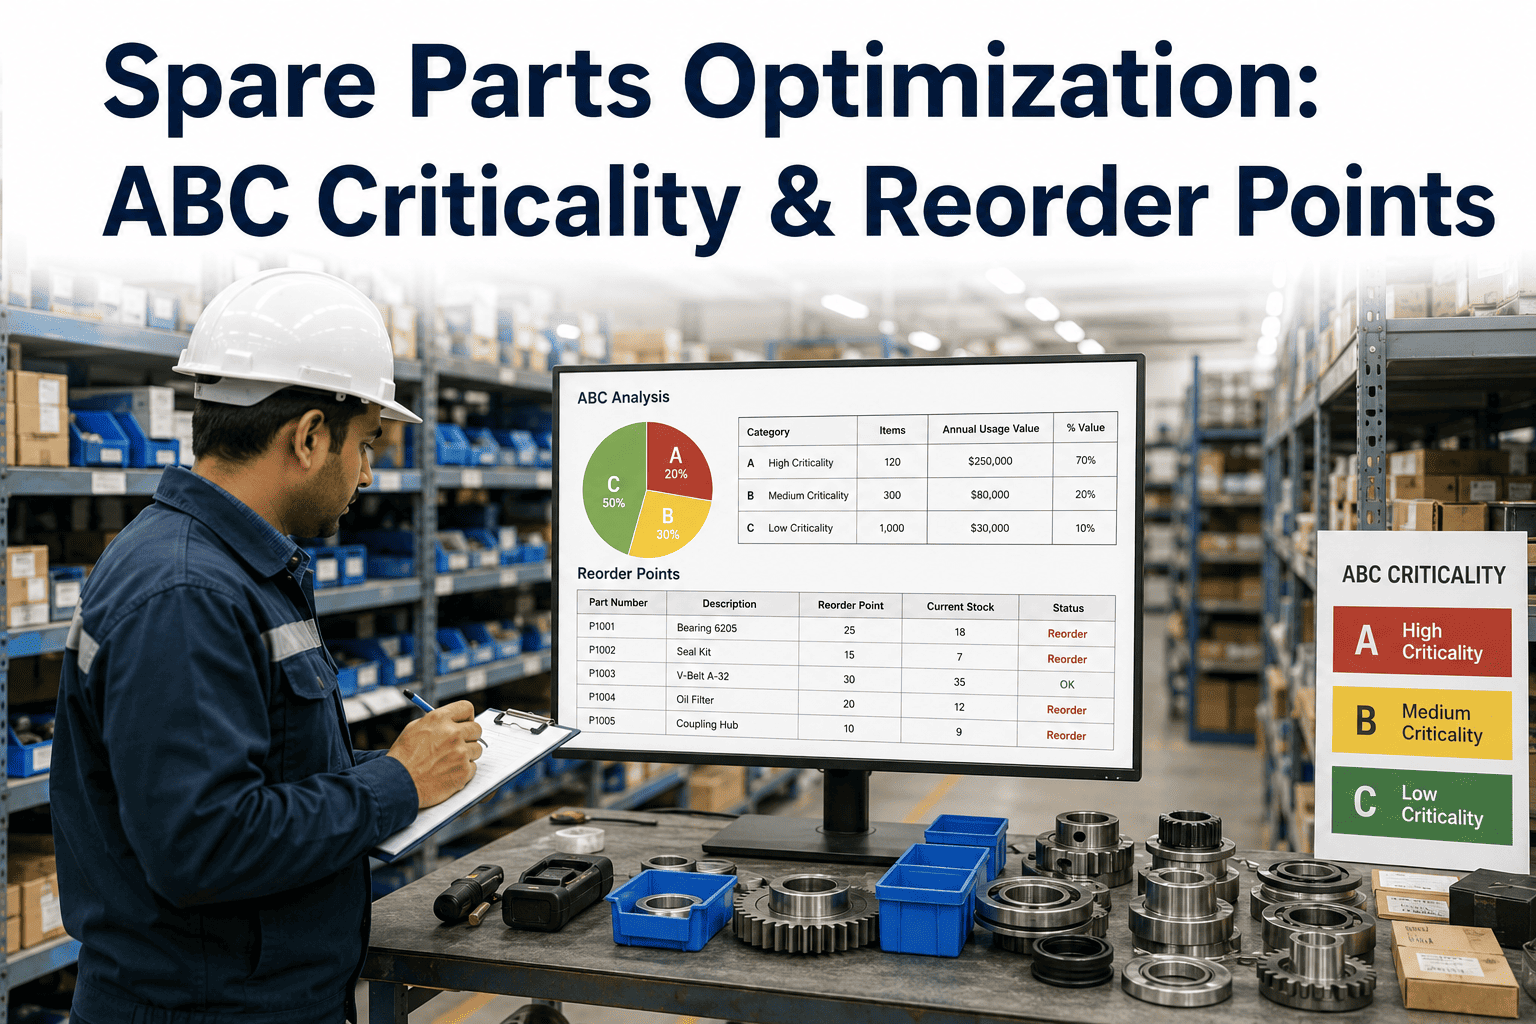
Every asset in your plant belongs in one of three tiers, and the tier — not the equipment type — decides the monitoring investment. Skipping this step is the single most common reason programs run out of budget before they run out of assets to cover.
Single points of failure, safety-critical rotating equipment, and assets where an unplanned stop halts the whole line. Permanent sensors stream data around the clock and feed AI models trained on the specific degradation curve of that machine class.
Important but redundant or slower-degrading equipment. A technician walks a defined route on a handheld device on a monthly or quarterly cadence, trading real-time visibility for a dramatically lower cost per asset.
Low-cost, low-consequence, easily-replaced equipment where monitoring investment would exceed the cost of an occasional failure. Covered by operator rounds and periodic visual checks rather than instrumented monitoring.
Rule of thumb: score every asset on production impact, safety consequence, repair cost, and mean time to repair. Anything scoring in the top quartile is a Tier 1 candidate regardless of how simple the machine looks on paper.
Step Two: Match Monitoring Technology to Failure Mode, Not to Habit
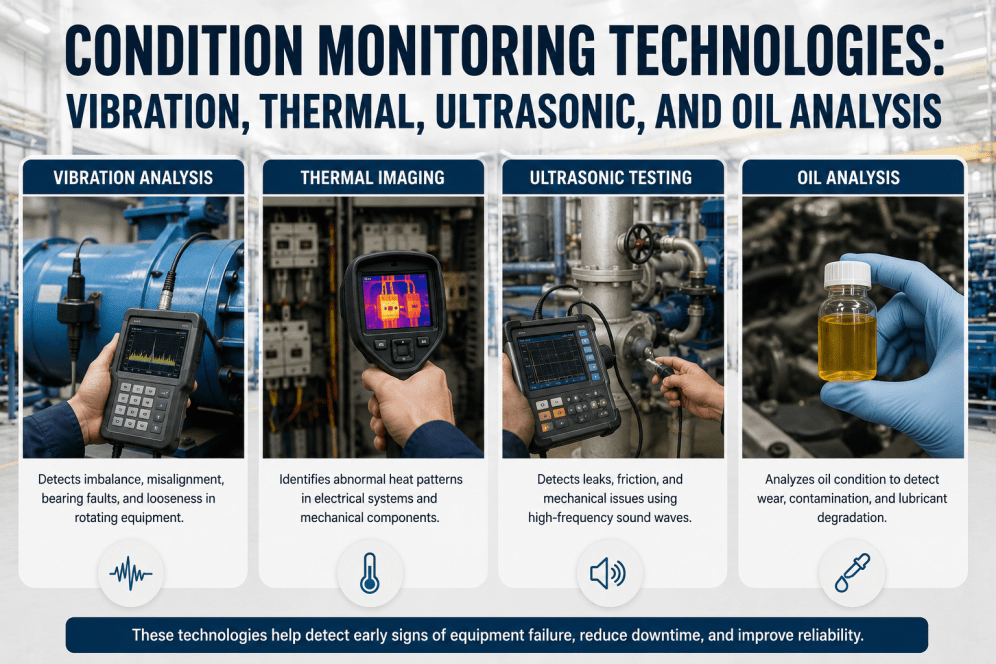
Plants that default to vibration analysis for every asset class miss electrical faults, lubrication breakdown, and slow-speed bearing wear that vibration alone cannot see clearly. The table below is the starting matrix iFactory uses on every new program scope.
Combining two or three technologies matched to the dominant failure mode of each asset class covers the large majority of failures a typical plant experiences. Start with vibration as the baseline for rotating equipment, then layer in thermography for electrical assets before expanding further.
Not Sure Which Assets Belong in Tier 1?
iFactory's reliability engineers run a criticality workshop against your actual asset register and failure history, then hand you a tiered monitoring plan with technology and budget attached to every asset. No generic sensor list, no guesswork.
Step Three: Design the Monitoring Architecture — Online vs. Route
The architecture decision is not either-or. Every mature program runs both models side by side, with the split determined entirely by the tiering work done in step one.
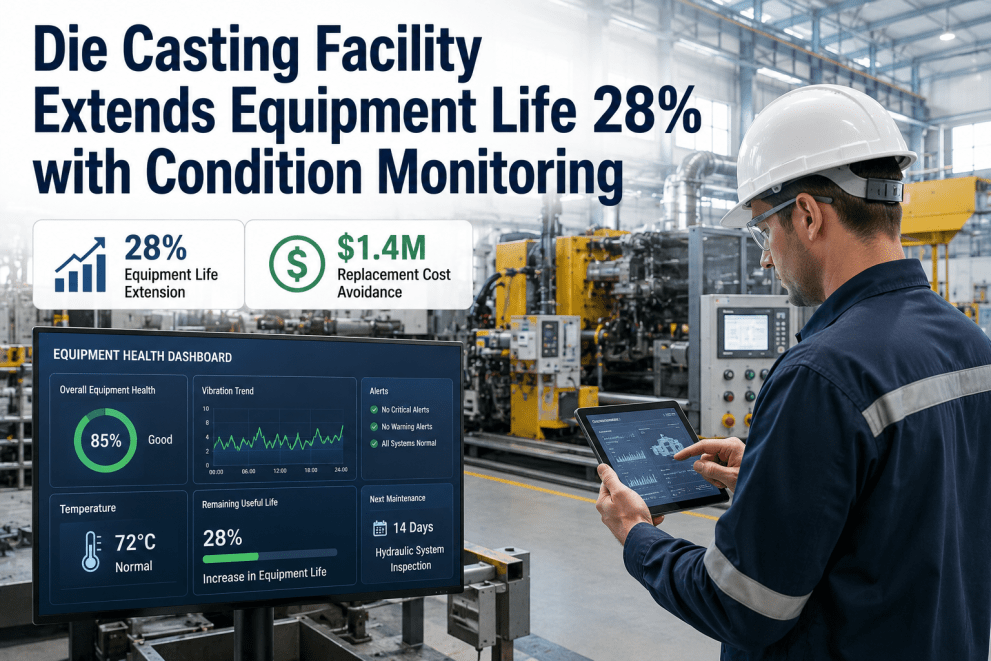
Permanent sensors on Tier 1 assets stream data every few seconds to a central platform. Anomalies surface within minutes, AI models track degradation trends, and work orders generate automatically in the CMMS the moment a threshold is crossed.
- Detection lag: minutes, not weeks
- Best for single points of failure and safety-critical equipment
- Highest cost per asset, highest value where downtime is expensive
- Scales with wireless battery-powered sensors on brownfield equipment
A trained technician walks a defined route with handheld vibration, thermal, or ultrasonic tools, capturing readings at scheduled measurement points. Data uploads to the same platform as the online sensors for a single unified view.
- Detection lag: weeks, bounded by route frequency
- Best fit for Tier 2 assets with redundancy or slower degradation
- Lower cost per asset, requires trained route technicians
- Gaps between measurements mean some fast-developing faults are missed
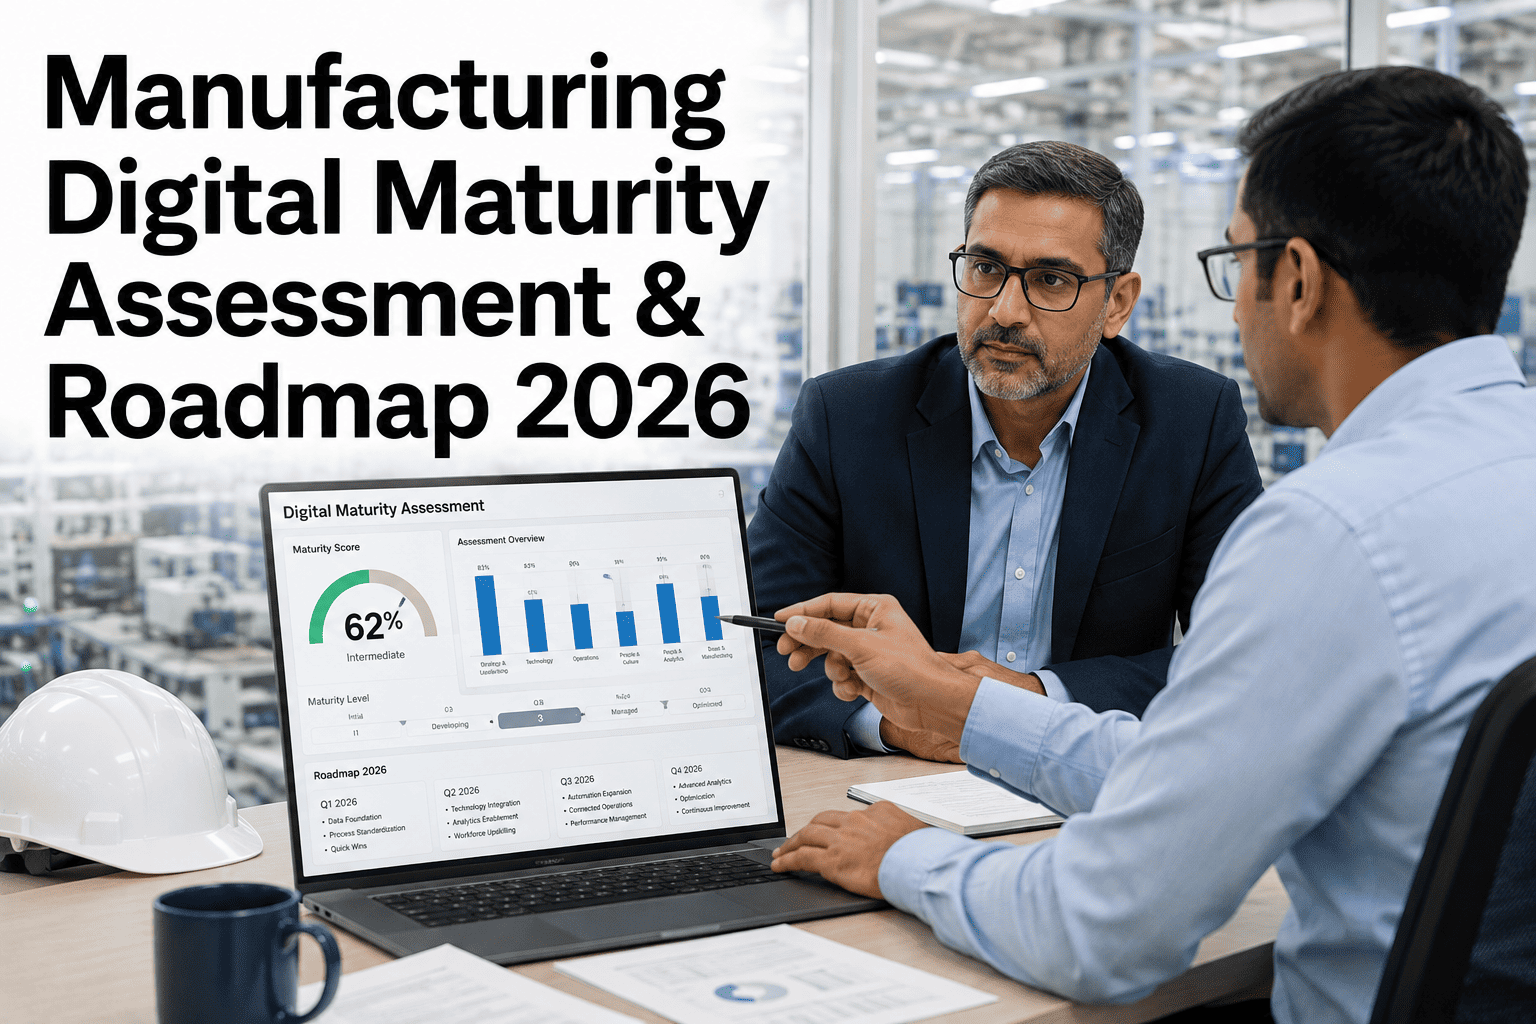
The Eight-Step Roadmap From Blank Sheet to Live Program
This is the sequence iFactory follows on every new condition monitoring engagement, refined across manufacturing, power, and process plants of every size.
Pull every rotating and electrical asset from the CMMS. Missing assets cannot be tiered, so this step is worth doing properly.
Rate each asset on production impact, safety consequence, repair cost, and mean time to repair to produce the Tier 1-2-3 split.
Match monitoring technology to the dominant failure mode of each asset class rather than defaulting to one method plant-wide.
Choose enough Tier 1 assets to prove financial value, few enough that the team can manage alert volume without burning out.
For Tier 2 assets, define measurement points, route sequence, and collection frequency that a technician can complete in a shift.
Establish baseline readings on healthy equipment first, then set alert and alarm levels off that baseline instead of generic defaults.
Vibration and thermography readings only create value when someone trained can interpret the spectrum, not just the alarm color.
Once Tier 1 assets show measurable downtime avoidance, expand tier coverage using the same criticality framework, not ad hoc requests.
Analyst Readiness: The Skill Gap That Sinks More Programs Than Bad Sensors
A vibration spectrum or a thermal image is only as useful as the person reading it. Programs that invest heavily in hardware but skip analyst development end up with alarms nobody trusts and a backlog of unreviewed data.
- Collects readings on a defined route using handheld instruments
- Follows measurement point procedures without deep spectral interpretation
- Flags obvious deviations for review by a senior analyst
- Typically ready to collect independently within four to six weeks
- Interprets spectra to diagnose imbalance, misalignment, and bearing defects
- Sets and adjusts alarm thresholds based on trend history
- Validates AI-generated fault calls before work orders are issued
- Category II vibration certification is the common baseline requirement
- Owns the criticality model and expands tier coverage over time
- Connects monitoring findings to root cause analysis and design fixes
- Reports downtime avoidance and program ROI to plant leadership
- Bridges the monitoring platform with the wider CMMS and MES stack
Five Mistakes That Derail a Condition Monitoring Program
These patterns show up across plants of every size and industry. Catching them during planning is far cheaper than fixing them after a year of unused dashboards.
Sensors before scoring
Buying sensors before completing a criticality study means budget gets spent on convenient assets rather than the ones that actually drive downtime cost. Score first, buy second.
One technology for every asset
Vibration alone misses electrical faults and lubrication breakdown. Matching technology to failure mode, not to what the team already owns, closes far more of the failure gap.
Default alarm thresholds
Generic vendor thresholds ignore the baseline behavior of your specific machine. Without a healthy-state baseline, alarms fire constantly or stay silent when it matters.
No trained analyst on staff
Raw data without interpretation is just noise. Programs that skip analyst certification end up outsourcing every diagnosis or ignoring the readings entirely.
Piloting on too many assets at once
A pilot covering fifty assets generates more alerts than any team can triage. Ten to fifteen well-chosen Tier 1 assets prove value faster and build internal confidence.
Building the Business Case Leadership Will Actually Fund
Capital committees rarely reject condition monitoring because the technology is unconvincing. They reject it because the request arrives without numbers tied to the plant's own downtime history. A business case built from the tiering exercise, rather than a vendor's generic ROI slide, gets approved far more often and survives the next budget review.
Pull twelve to twenty-four months of unplanned downtime events from the CMMS for the assets you plan to tier as Tier 1. Attach a dollar figure per hour of lost production, including scrap, overtime, and expedited parts freight, not just the line rate. This baseline becomes the number every future monitoring save is measured against.
Rather than promising a specific dollar return in month one, frame the pilot as reducing the probability of the worst-case failure on your highest-consequence assets. Leadership responds well to a framing that ties directly to safety incidents avoided and insurance or compliance exposure reduced, alongside the production numbers.
The first time a sensor or route reading catches a developing fault before it becomes a breakdown, document the avoided cost and circulate it internally. A single well-documented save early in the pilot does more to secure ongoing budget than months of clean dashboards with no story attached.
Alongside downtime avoided, track leading indicators such as percentage of Tier 1 assets with an established healthy baseline, route compliance rate, and average time from alarm to work order. These show the program is maturing even in months where no major failure was prevented.
Where the Data Lives: Platform Architecture That Scales With the Program
A program that starts on spreadsheets and a handful of point solutions eventually hits a wall where nobody can see the full plant picture in one place. Planning the data architecture early avoids a painful migration later.
Continuous sensors on Tier 1 assets and handheld route instruments on Tier 2 assets both feed raw readings — vibration spectra, temperature, oil particle counts — into a common ingestion layer rather than separate silos.
Raw readings convert into trends, baselines, and AI-driven fault scores. This is where a healthy-state baseline for each asset gets established and where alarm thresholds are calculated rather than guessed at.
When a fault score crosses a threshold, the platform should generate a prioritized alert and, ideally, a draft work order in the CMMS automatically, with the supporting spectrum or trend attached for the analyst to review.
A portfolio-level view rolls tier coverage, alert response time, and downtime avoidance up to a single dashboard reliability leaders can bring to the monthly operations review without manually compiling spreadsheets.
Plants that plan this four-layer architecture from the outset avoid the common failure pattern of ending up with five disconnected tools — one per monitoring technology — that nobody has time to cross-reference during an actual fault investigation.
Frequently Asked Questions
How many assets should a first condition monitoring pilot cover?
Most successful pilots start with ten to fifteen Tier 1 assets — enough to demonstrate measurable downtime avoidance to plant leadership but few enough that a single analyst can review every alert without falling behind. Expanding too fast in the first quarter is the most common reason programs generate alarm fatigue before they generate trust. Once the pilot assets show a clear pattern of early fault detection, coverage typically expands in waves of another ten to twenty assets. Book a scoping call to size a pilot against your specific asset register.
Do we need in-house vibration analysts, or can this be outsourced?
Both models work, and many plants run a hybrid. Outsourced analysis suits smaller sites or early-stage programs where hiring a certified analyst is not yet justified by asset volume. Larger plants with continuous online monitoring on dozens of Tier 1 assets generally benefit from an in-house Category II analyst who can validate AI-flagged faults same-day rather than waiting on a third-party turnaround. The right mix depends on alert volume and how quickly a fault needs a human decision.
How does condition monitoring data connect to our existing CMMS?
A well-designed program treats the monitoring platform and the CMMS as one workflow, not two separate systems. When a sensor or route reading crosses an alarm threshold, a work order should generate automatically with the fault type, severity, and recommended action attached, rather than requiring a technician to manually re-key findings. Our support team helps map the integration to your existing CMMS or ERP during onboarding.
What does a condition monitoring program typically cost for a mid-size plant?
Cost scales directly with the tier split rather than total asset count. A plant that tiers correctly and monitors only the top 15 to 20 percent of assets continuously, while route-monitoring the rest, spends a fraction of what a plant pays trying to instrument everything. Wireless battery-powered sensors have also brought down the cost of Tier 1 coverage significantly compared to hardwired systems from a few years ago, making brownfield retrofits far more affordable.
How long before a new condition monitoring program shows measurable ROI?
Most pilots surface at least one meaningful early catch — a bearing fault, a misalignment, or an electrical hotspot — within the first sixty to ninety days once sensors are installed and baselines are set. Full program ROI, measured against reduced unplanned downtime and lower emergency repair spend, typically becomes clear across the first two to three quarters as the Tier 1 asset base and analyst experience both mature together.
Ready to Build a Program That Actually Scales?
Book a 30-minute demo with iFactory. Bring your asset register, leave with a tiered monitoring plan, a technology map matched to your failure modes, and a pilot sized to your team's real capacity.