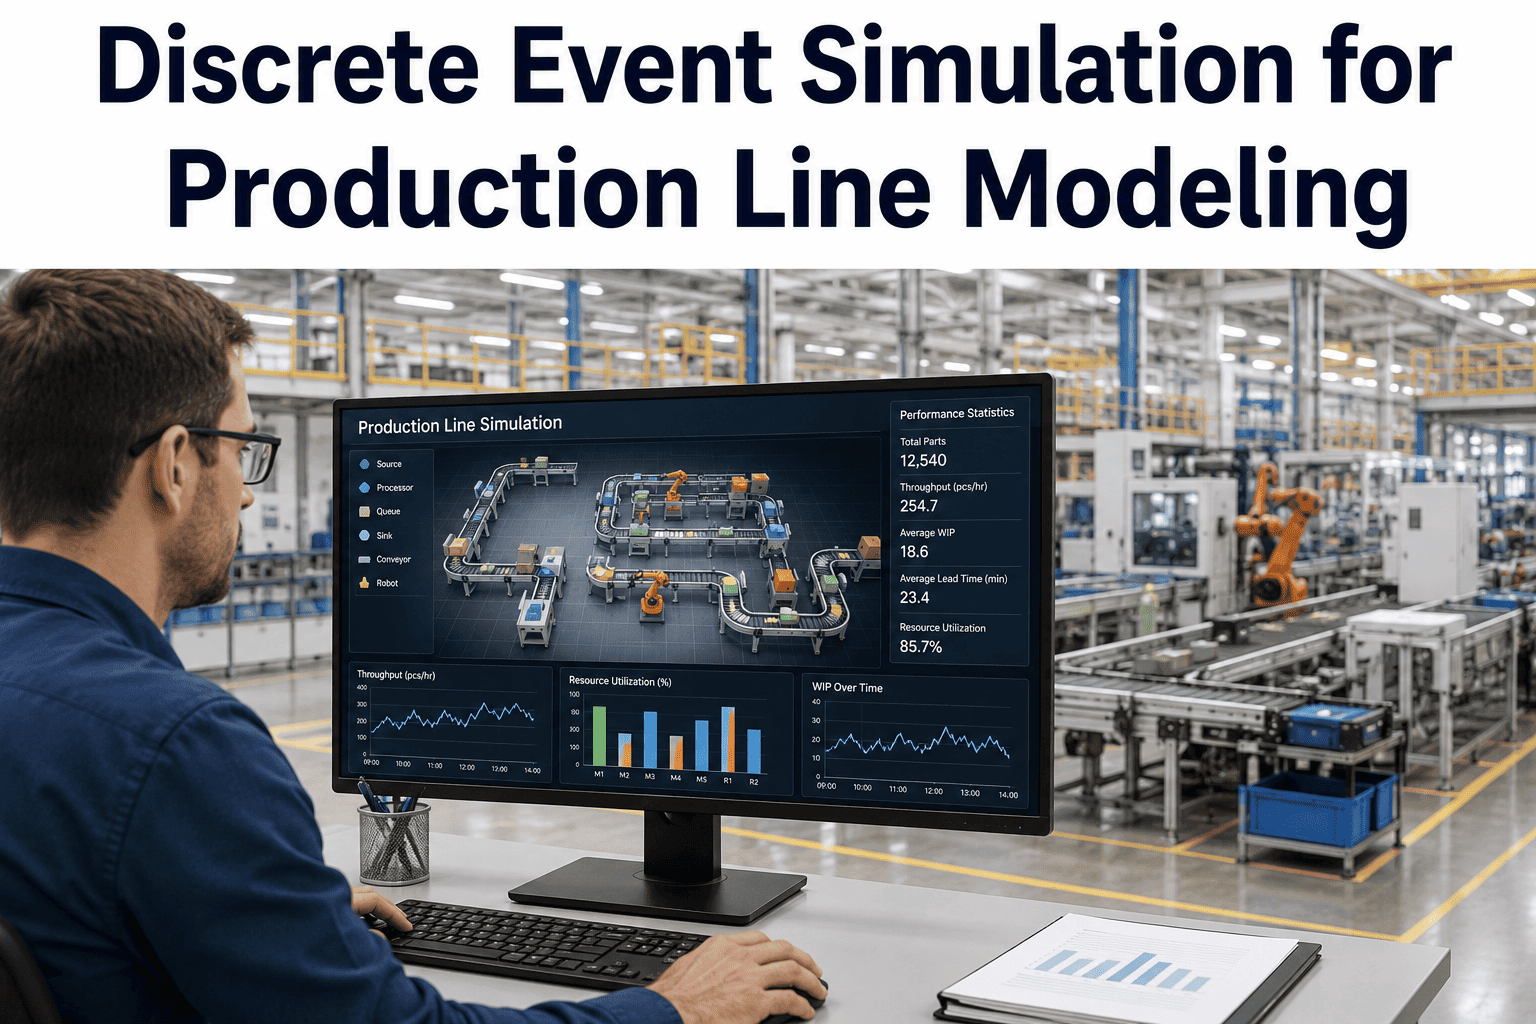
A production line rarely tells you where its real bottleneck is just by watching it run, because the station that looks the busiest is often not the one actually limiting total throughput, and the fix that seems obvious — adding another machine at the visibly congested step — sometimes makes overall output worse rather than better. Discrete event simulation exists precisely to answer this question with data instead of intuition, modeling the exact sequence of events on a line so engineers can test a change virtually before committing capital to it. Getting this analysis wrong is not a small mistake either, since one pharmaceutical manufacturer avoided a fifty million dollar investment after simulation revealed that a perceived bottleneck was actually caused by upstream batching misalignment rather than insufficient capacity at the suspected station. Our simulation modeling team can help you build a discrete event model of your specific production line before any capital decision is made.
Discrete Event Simulation
Find the Real Bottleneck Before You Spend on the Wrong Fix
Model your production line's actual event sequence, test capacity and layout changes virtually, and see the throughput impact before committing to equipment or floor space changes.
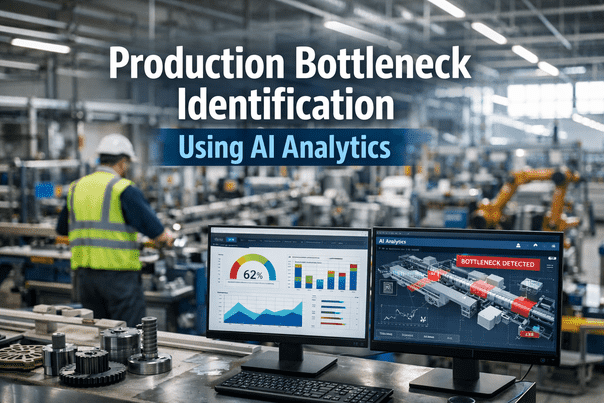
Station Utilization Snapshot
Darker shading indicates higher station utilization and queue buildup
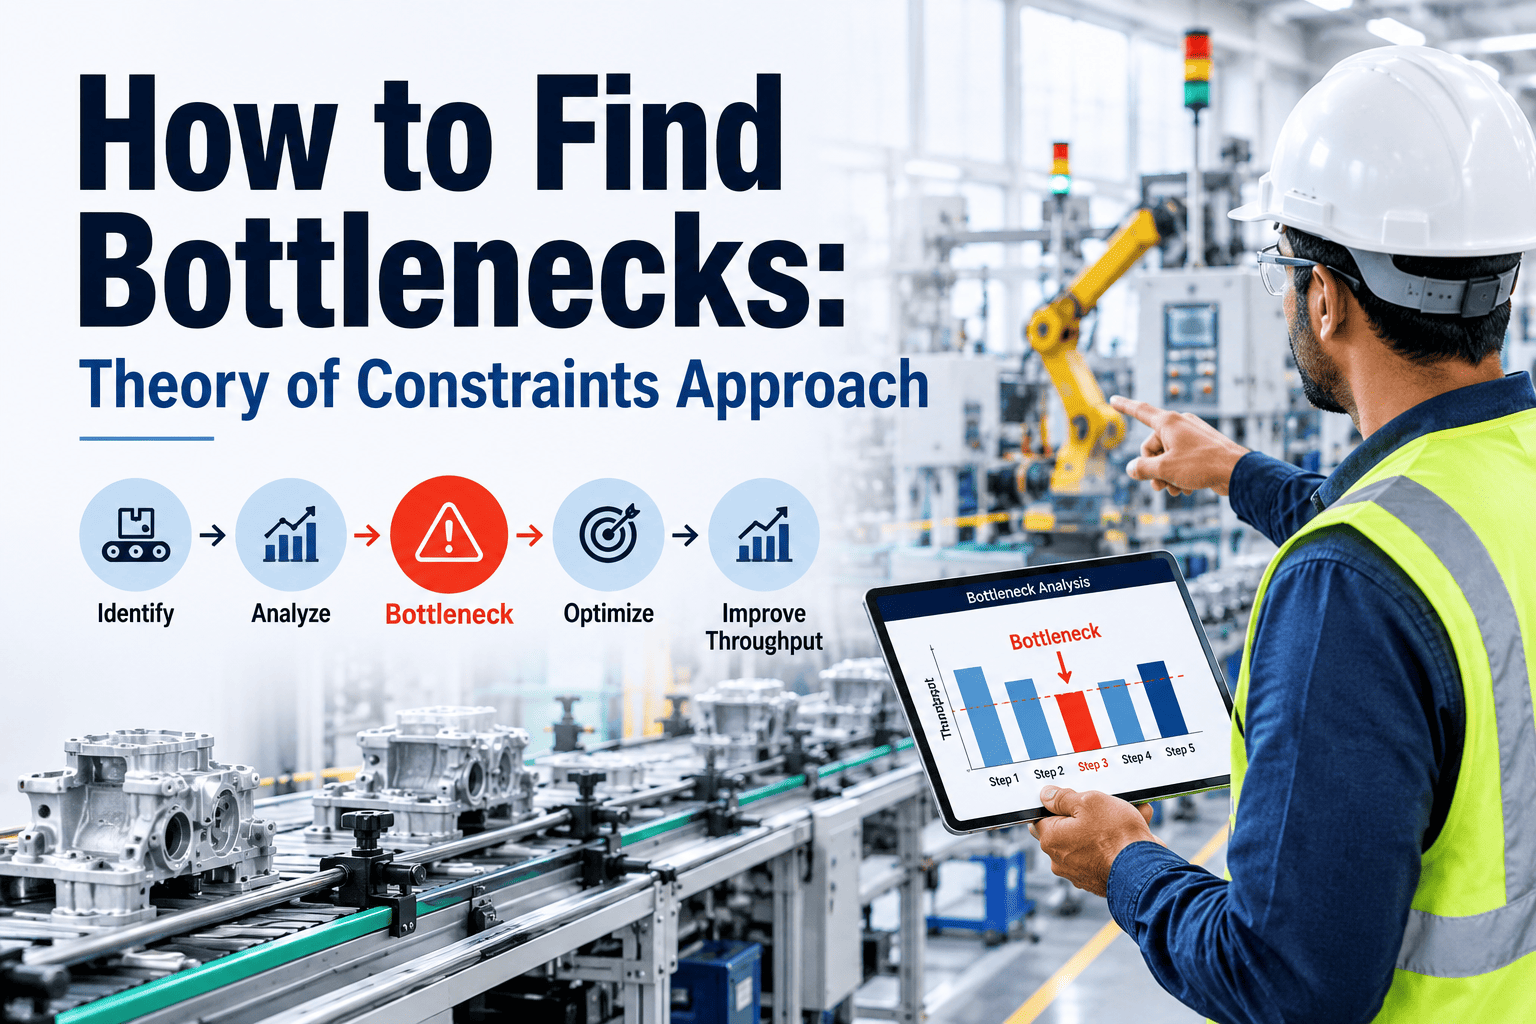
Why the Busiest-Looking Station Is Often Not the Real Bottleneck
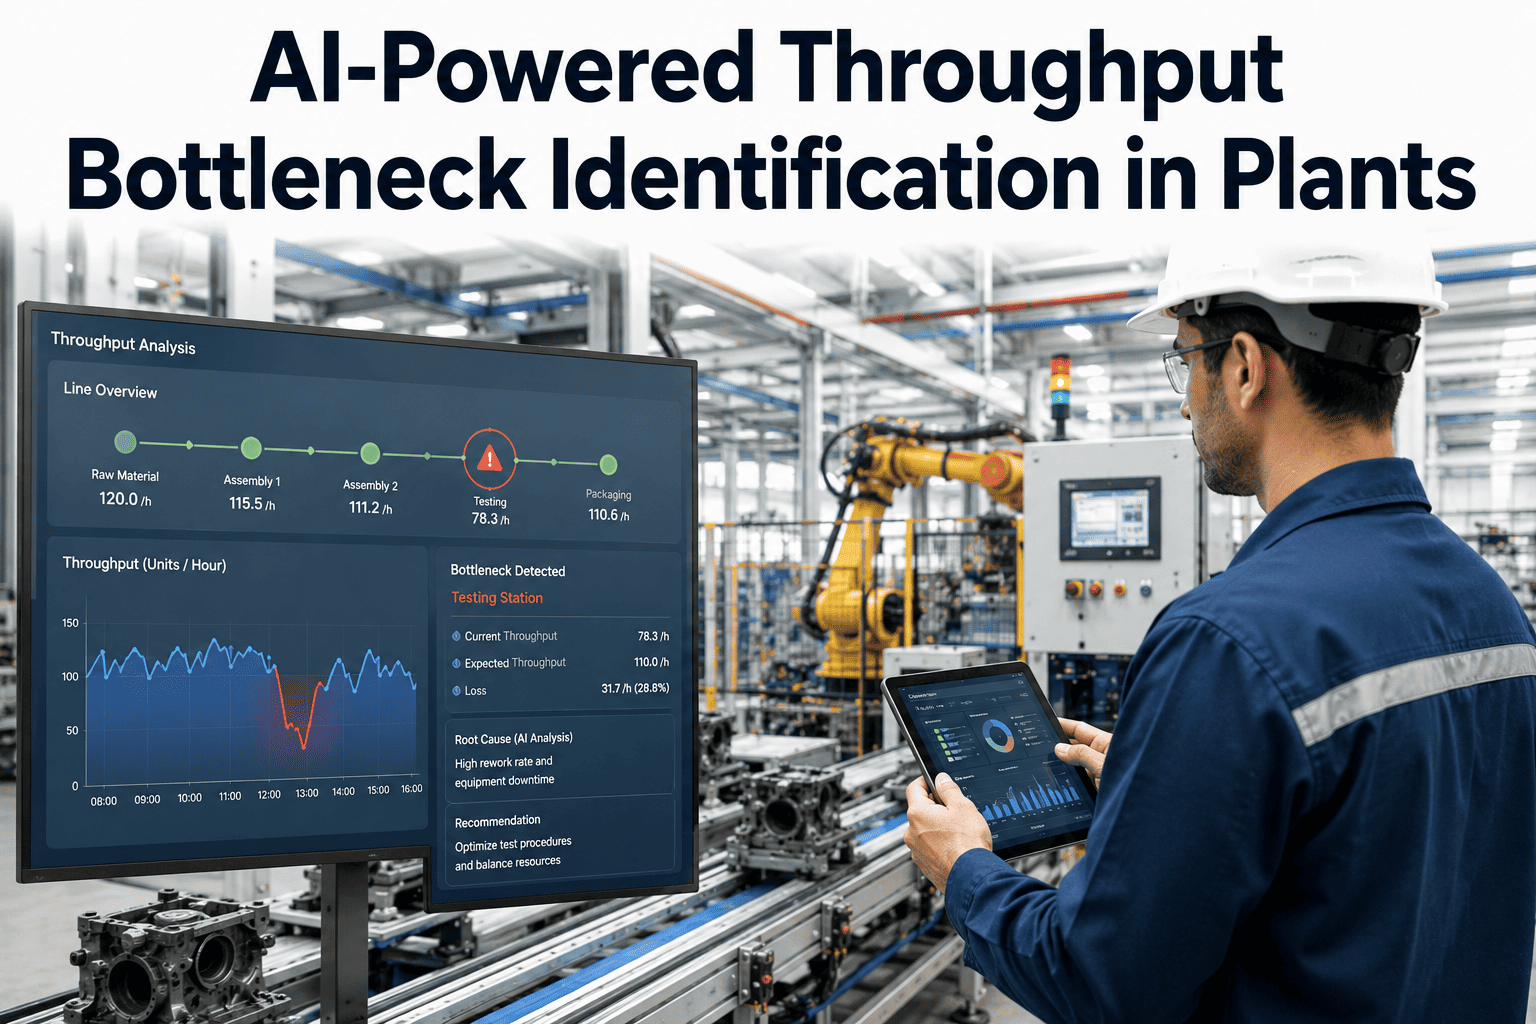
A station with a visibly long queue in front of it is easy to blame for slow throughput, but queue length reflects the rate at which work arrives just as much as the rate at which the station processes it. A station further upstream releasing work in uneven batches can create the appearance of congestion two or three steps downstream, while the true constraint sits somewhere the naked eye would never suspect. Discrete event simulation resolves this by modeling every station's cycle time, failure rate, and interdependency together, so the actual limiting constraint on total line throughput becomes a calculated result rather than a guess based on which queue looks longest on any given day.
This matters because the wrong fix is not merely wasted spend, it can actively reduce output. Adding capacity at a station that was never the actual constraint sometimes shifts the bottleneck further downstream to a station that now receives work faster than it can process, creating a new congestion point that did not exist before the change.
30%
efficiency deficit eliminated in a documented packaging-station bottleneck case
12%
throughput increase achieved during a plant expansion without new machines
$50M
investment avoided after simulation revealed the true root cause
95%+
accuracy achieved by leading bottleneck-prediction models in recent studies
What a Discrete Event Model Actually Captures
Unlike a simple spreadsheet capacity calculation, a discrete event model captures the stochastic, event-driven nature of a real production line, where cycle times vary, equipment occasionally fails, and buffers between stations have finite capacity that can starve or block adjacent stations.
Cycle Time Variability
Real stations do not process every unit in exactly the same time. The model uses probability distributions fitted from actual historical data rather than a single average cycle time.
Buffer and Blocking Behavior
Finite buffers between stations mean a slow downstream station can block an upstream one from releasing work, a dynamic a static calculation cannot represent.
Failure and Repair Events
Equipment breakdowns and repair durations are modeled as random events with realistic frequency and duration, capturing their downstream ripple effect on the whole line.
Want to see what a model of your specific line would reveal?
Book a demo and we will walk through a sample bottleneck analysis.
Building the Model: From Data Collection to Validated Simulation
A useful simulation depends entirely on the quality of the data feeding it, which is why the modeling process starts well before any software is opened.
1
Data Collection
Cycle times, failure rates, repair durations, and buffer capacities are gathered from real historical production data rather than nominal equipment specifications.
2
Distribution Fitting
Statistical distributions are fitted to each variable process time, capturing the natural variability rather than reducing every station to a single average value.
3
Model Construction
The line's actual layout, routing logic, and buffer sizes are built into the simulation software, replicating the real physical and logical flow of material.
4
Validation Against Reality
The model is run against a known historical period and its output throughput is compared against actual recorded output to confirm the model reflects reality before being trusted for scenario testing.
5
Scenario Testing
Only once validated does the model get used to test proposed changes, such as added capacity, revised scheduling, or a layout change, each compared against the validated baseline.
Common Scenarios Worth Testing Before Committing Capital
Reading the Result: Median Throughput Is Not the Whole Story
A simulation's most valuable output is often not the single average throughput number, but the spread of results across many simulated runs. A configuration with a slightly lower median throughput but a much narrower range of outcomes can be the better real-world choice, since it behaves more predictably and is less likely to swing into a bad-week scenario than a configuration with a higher average but wider variability driven by unstable bottleneck behavior.
Narrower
Output Variability
Configurations validated through simulation tend to show tighter interquartile ranges in throughput and OEE, indicating more stable operation.
Shorter
Lead Time
Resolving the true bottleneck rather than a perceived one reduces work-in-process buildup and shortens overall lead time through the line.
Lower
Capital Risk
Testing a capacity investment virtually before committing capital avoids the cost of a change that does not deliver the expected throughput gain.
Considering a capacity investment or layout change on one of your lines?
Talk to our team before committing capital, and we will model it first.
Frequently Asked Questions
How much historical data do we need to build an accurate simulation model?
A useful starting point is typically several months of cycle time, failure, and repair data per station, enough to capture normal variation across different shifts, product mixes, and seasonal patterns rather than a single snapshot that might reflect an unusually good or bad period. Stations with highly variable cycle times or infrequent but impactful failure events generally need a longer data collection window to fit a reliable statistical distribution, while more consistent, high-frequency stations can often be modeled accurately with a shorter data set. If detailed historical data genuinely is not available for certain stations, the model can still be built using engineering estimates for those stations while prioritizing real data collection for the areas most likely to be the actual constraint.
Reach out to our team to assess what data is available for your specific line.
How do we know if the simulation model is actually accurate before trusting its recommendations?
The validation step is not optional, and it works by running the model against a known historical period and comparing its predicted throughput, utilization, and queue behavior against what actually happened during that same period. A model that matches historical reality reasonably closely can be trusted for scenario testing going forward, while a model that diverges significantly from known outcomes needs its underlying assumptions revisited before any of its recommendations are acted upon. This validation step is frequently skipped under time pressure, which is precisely how a simulation-based recommendation can end up being no more reliable than the gut-feel guess it was meant to replace.
Book a demo to see how model validation works in practice against a real data set.
Is discrete event simulation worth the investment for a smaller production line?
The value of simulation scales with the cost of getting a capacity or layout decision wrong, not strictly with the size of the line itself. A small line facing a genuinely expensive capital decision, such as a new piece of automated equipment or a significant layout change, can still justify the modeling investment if the potential cost of a wrong decision meaningfully exceeds the cost of building the model. For smaller, lower-stakes changes on a small line, a simpler capacity calculation may be sufficient, and the full discrete event approach is better reserved for decisions carrying real financial or operational risk if the wrong bottleneck gets targeted.
Talk to our team about whether your specific decision warrants a full simulation model.
Can simulation account for a completely new product being introduced to an existing line?
Yes, this is one of the more common and valuable applications, since introducing a new product or product variant changes the routing, cycle times, and resource demands across the line in ways that are difficult to predict from experience alone. The model can be extended with estimated or pilot-run cycle time data for the new product, then run alongside the existing product mix to see how the combined demand affects overall throughput, station utilization, and whether the previously identified bottleneck remains the constraint once the new product is added. This lets engineering teams stress-test a product launch plan against the existing line's real capacity before committing to a production schedule that assumes capacity the line may not actually have.
Book a walkthrough to see how a new product introduction would be modeled against your current line.
How often should an existing simulation model be updated once it is built?
A simulation model should be treated as a living asset rather than a one-time deliverable, since the cycle times, failure rates, and product mix it was built around will drift over time as equipment ages, maintenance practices evolve, and the product portfolio changes. Refreshing the underlying data and re-validating the model at least annually, or immediately after any significant equipment change, keeps its recommendations trustworthy rather than reflecting conditions that no longer match the actual line. Facilities that build a model once for a single capital decision and then never touch it again tend to lose confidence in it over subsequent years, precisely because nobody updated it to reflect how the line has actually changed since the original analysis.
Reach out to discuss keeping your simulation model current as your line evolves.
Stop Guessing Where Your Line's Real Constraint Is
Model Your Production Line Before You Spend on the Wrong Fix
Share your current line layout and cycle time data and we will build a validated discrete event model to identify your true bottleneck and test proposed changes before any capital is committed.
12%
Throughput gain example
$50M
Investment avoided example