Most plants find out their energy bill is going to spike after it already has. A compressor left running through a shift change, a furnace ramped up earlier than the schedule required, a peak demand charge triggered by three pieces of equipment starting at once — these are decisions made in the dark, because nobody had a way to see the energy consequence before it happened. A digital twin of your energy system changes that by letting you simulate a schedule before you commit to it. Book a demo with iFactory's energy analytics team to see consumption prediction running against your own equipment.
Digital Twin · Energy Management 2026
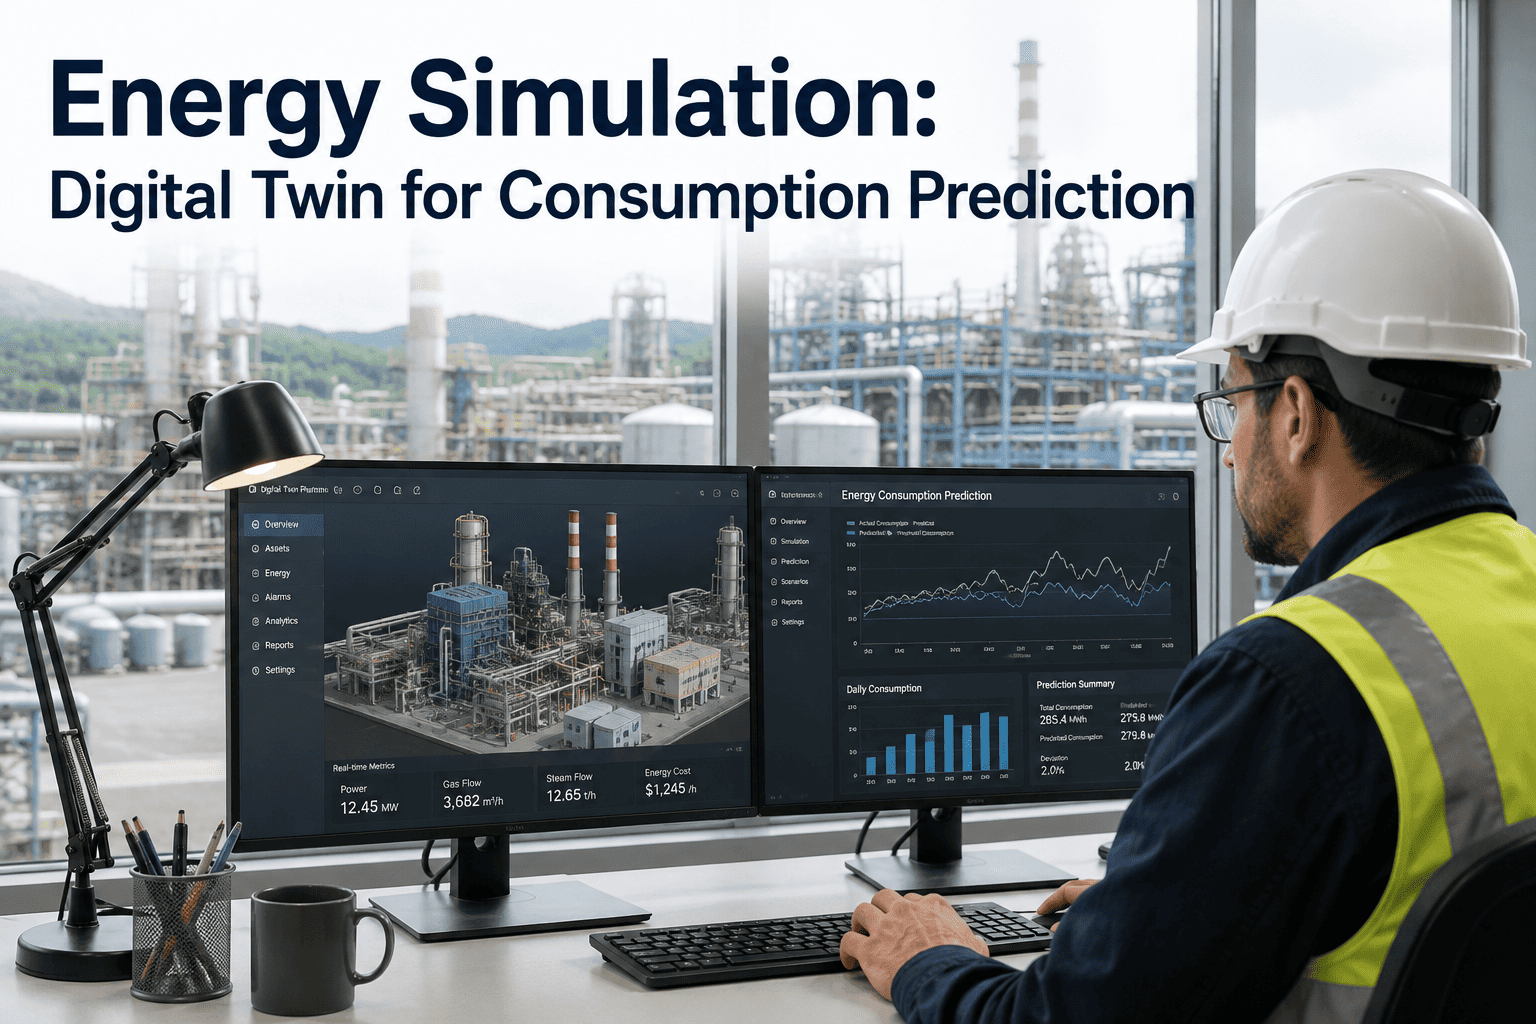
Energy Simulation: Predicting Consumption Before It Hits Your Bill
A digital twin of your plant's energy behavior lets you test equipment scheduling changes, forecast demand, and catch peak charge triggers in simulation — before they show up as an unplanned cost on next month's utility invoice.
How the Simulation Works
From Real Equipment Data to a Predictive Energy Model
Step 1
Build the Baseline
Historical consumption data from meters, drives, and equipment controllers establishes each asset's typical energy profile under different load and operating conditions.
Step 2
Model Equipment Behavior
Each significant energy consumer — compressors, ovens, chillers, motors — gets modeled individually, capturing how its consumption changes with load, ambient conditions, and duty cycle.
Step 3
Simulate a Scenario
A proposed production schedule, a new startup sequence, or a shift pattern change gets run through the model before it's implemented, producing a predicted consumption and demand curve.
Step 4
Compare and Decide
The simulated result is compared against current baseline and against utility rate structure, including demand charges, so a scheduling decision can be evaluated on cost impact before it's locked in.
What Gets Tested
Common Scenarios Worth Simulating Before Committing
Staggered Equipment Startup
Simulating whether spreading compressor and oven startups across ten minutes instead of starting them simultaneously avoids triggering a peak demand charge for the billing period.
Shift Schedule Changes
Testing whether moving a high-energy process to an off-peak utility rate window reduces cost enough to offset any production scheduling friction it introduces.
Equipment Replacement ROI
Modeling the consumption difference between an aging motor and a proposed high-efficiency replacement under actual plant load profiles, rather than relying on generic manufacturer specifications.
Seasonal Demand Planning
Forecasting how ambient temperature swings will affect HVAC and process cooling loads months in advance, giving procurement time to plan around anticipated rate structure changes.
Test Before You Commit
iFactory Simulates Energy Impact Before a Schedule Change Goes Live
Instead of finding out a scheduling decision was expensive after the utility bill arrives, iFactory's digital twin models the consumption and demand impact of a proposed change in advance, connected directly to your actual equipment data.
Where the Savings Come From
Three Cost Levers a Digital Twin Actually Moves
| Lever | How Simulation Helps | Typical Owner |
|---|---|---|
| Peak Demand Charges | Identifies equipment start sequences that trigger avoidable demand spikes | Plant Operations |
| Time-of-Use Rate Exposure | Shows the cost delta of shifting flexible loads to off-peak windows | Production Scheduling |
| Equipment Efficiency Loss | Flags assets consuming more than their modeled baseline, signaling maintenance need | Maintenance |
Getting Started
A Phased Rollout That Doesn't Require Metering Everything at Once
Phase 1
Model the Top Consumers
Start with the handful of assets responsible for the majority of the plant's energy spend, where existing submetering usually already provides enough data to build a first working model.
Phase 2
Validate Against Real Bills
Compare the model's predicted consumption against actual utility invoices over a few billing cycles, refining the model until it tracks reality closely enough to trust for scenario testing.
Phase 3
Run the First Scenario Tests
Simulate a scheduling change already under consideration and compare the predicted outcome to what actually happens after implementation, building confidence in the model's accuracy.
Phase 4
Expand Coverage
Add metering and modeling for additional equipment over time, widening the set of decisions that can be tested in simulation before they're committed to on the floor.
What to Watch For
Mistakes That Undermine an Otherwise Good Energy Model
Modeling Equipment in Isolation
Interactions between assets, such as a chiller responding to heat generated by a nearby oven, get missed if each piece of equipment is modeled without accounting for how it affects its neighbors.
Ignoring Rate Structure Changes
A model built against last year's utility tariff produces misleading cost projections the moment the rate structure changes, so the tariff assumptions need to stay current.
Treating the Model as Set-and-Forget
Equipment degrades and gets replaced over time; a model that isn't periodically revalidated against current performance will drift from reality without anyone noticing until predictions stop matching bills.
Energy teams usually get pulled in after a cost problem already happened — the utility bill spiked, and now everyone's trying to figure out why. Simulation flips that timeline. Instead of explaining last month's bill, you're testing next month's schedule before it runs. The plants that get real value out of this aren't the ones chasing a single big efficiency project, they're the ones that build simulation into the routine of planning every schedule change, so avoiding an avoidable demand charge becomes as normal as checking a production capacity constraint before committing to an order.
Odalys Fennimore-Achterberg
Industrial Energy Management Consultant · 13 years building energy models for multi-site manufacturers across food, metals, and plastics
Energy Simulation Questions
Digital Twin Energy Prediction — Frequently Asked
How much historical data is needed before a reliable energy model can be built?
Most models produce usefully accurate baselines with three to six months of consumption data per asset, provided that period captures a representative range of load conditions and, ideally, at least one seasonal transition. Equipment with highly variable duty cycles benefits from a longer data window to capture the full range of operating states, while steady-state equipment like a continuously running process pump can often be modeled reliably with less history. The model continues improving as more data accumulates, so accuracy is never fixed at the initial build — it refines over the first several months of live operation.
Does this require installing new metering hardware on every piece of equipment?
Not necessarily for every asset, though metering coverage does directly affect model precision. Many facilities already have submetering on their largest energy consumers, and a useful model can start there, treating smaller loads in aggregate rather than individually. Expanding metering to additional equipment over time improves the granularity of what can be simulated, but a phased approach starting with the highest-consumption assets typically captures the majority of the cost-saving opportunity without requiring a full metering retrofit up front.
Can the simulation account for utility rate structures that change seasonally or by time of day?
Yes, and this is one of the more valuable capabilities, since energy cost isn't just a function of total consumption but of when that consumption occurs relative to time-of-use rates and demand charge windows. A properly built model incorporates the actual utility tariff structure, so a simulated schedule doesn't just report kilowatt-hours consumed, it reports the projected dollar cost under the specific rate plan the facility is billed on. Contact our support team to confirm compatibility with your utility's specific rate structure.
How is this different from a basic energy dashboard that just reports historical usage?
A historical dashboard tells you what already happened, which is useful for tracking trends but offers no way to test a decision before committing to it. A digital twin simulation is forward-looking — it lets you input a proposed change, whether that's a new startup sequence or a shift schedule adjustment, and see the predicted consumption and cost outcome before it happens in reality. The two are complementary: historical data trains and validates the model, while the simulation capability is what actually changes planning behavior rather than just reporting on it after the fact.
What's a realistic timeframe to see measurable energy cost savings after implementation?
Many facilities identify their first avoidable peak demand trigger or scheduling inefficiency within the first few weeks of having a working model, since these tend to be visible as soon as the baseline is established and equipment behavior is properly characterized. Realizing the savings depends on how quickly the operations team acts on the simulation's recommendations, which is typically faster for straightforward scheduling adjustments than for larger capital decisions like equipment replacement. Book a demo to see a projected savings estimate based on your own equipment and rate structure.
Stop Reacting to the Utility Bill
Simulate Energy Impact Before You Commit to a Schedule
iFactory's energy digital twin models your equipment's real consumption behavior, letting you test scheduling and equipment decisions in simulation before they show up as an unplanned cost.