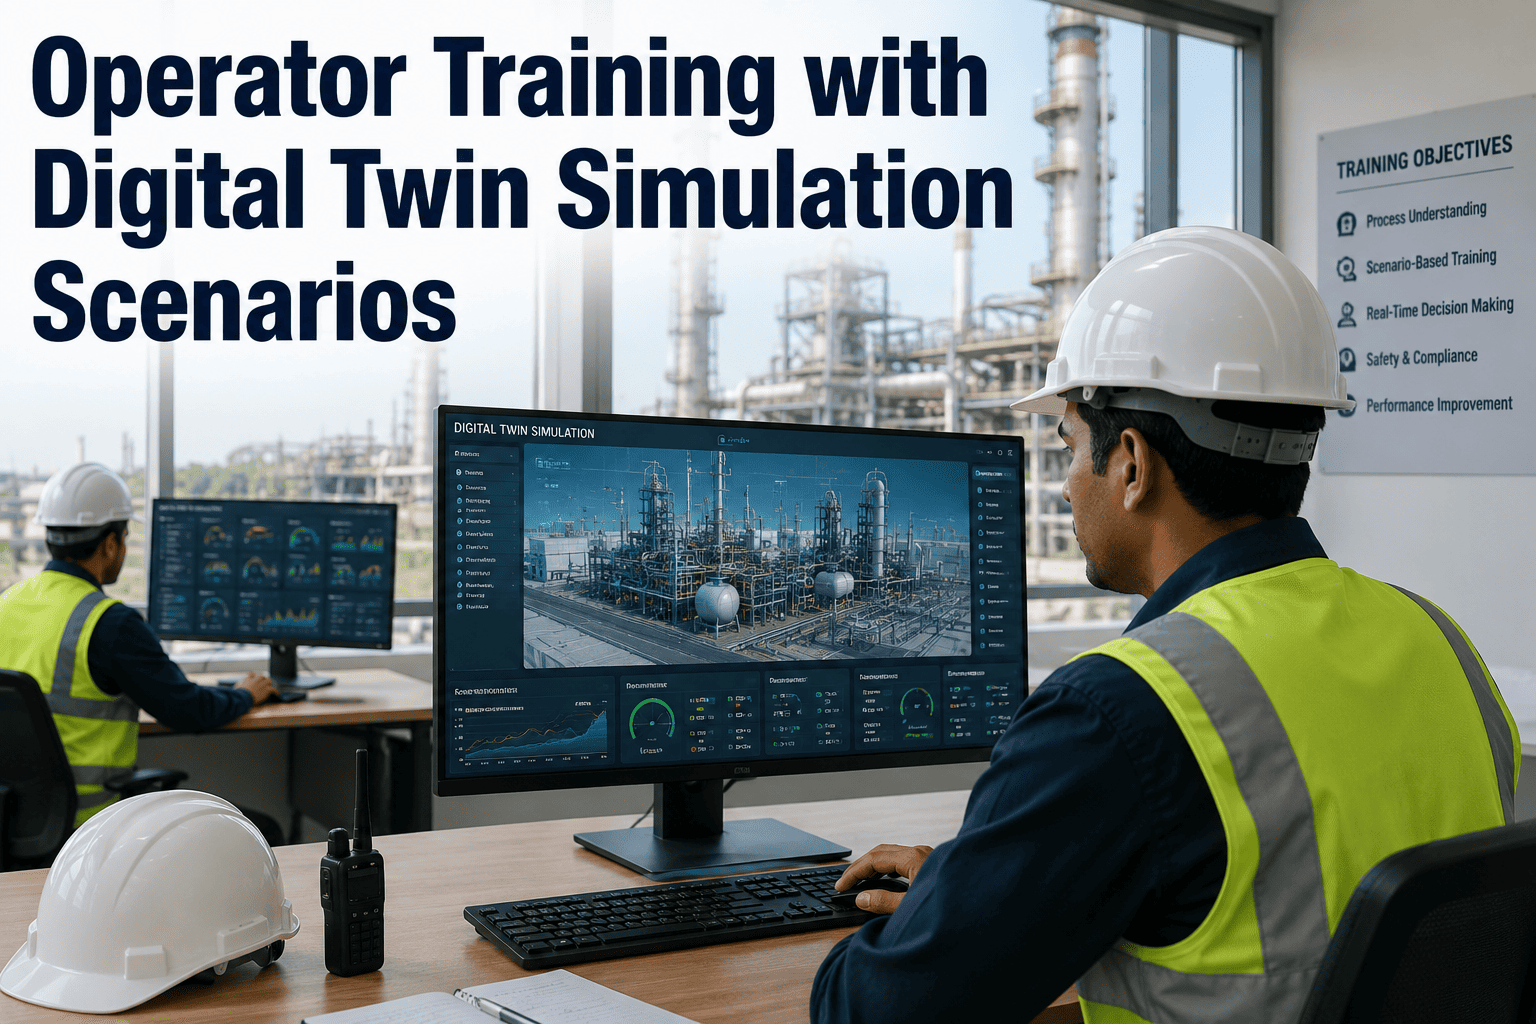
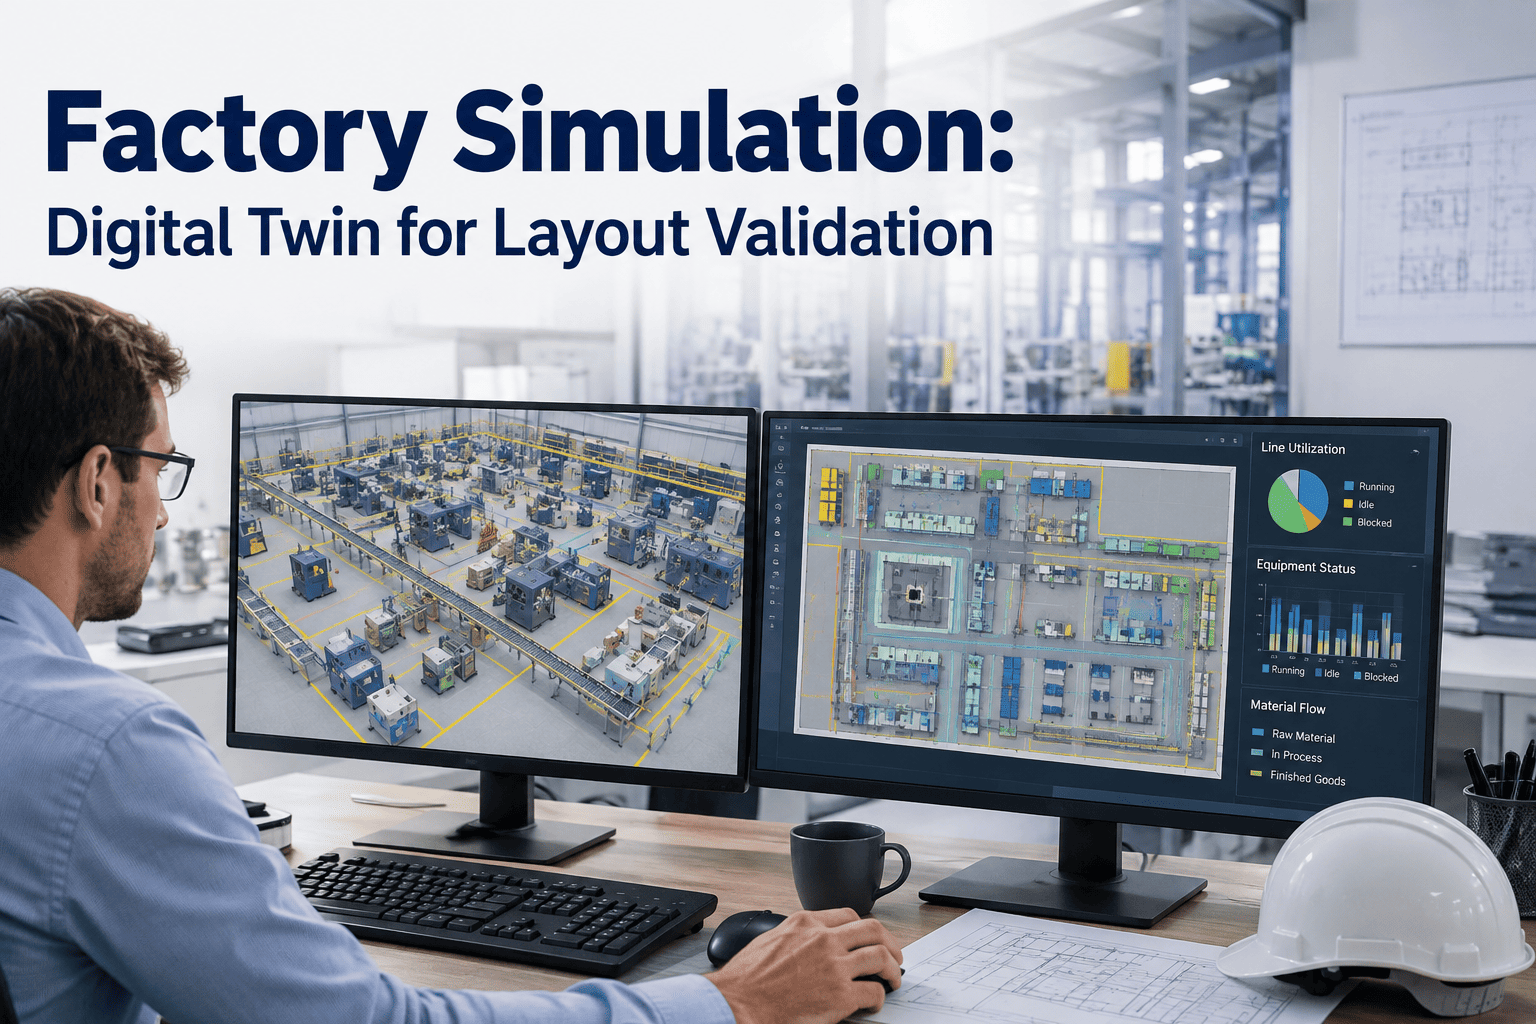
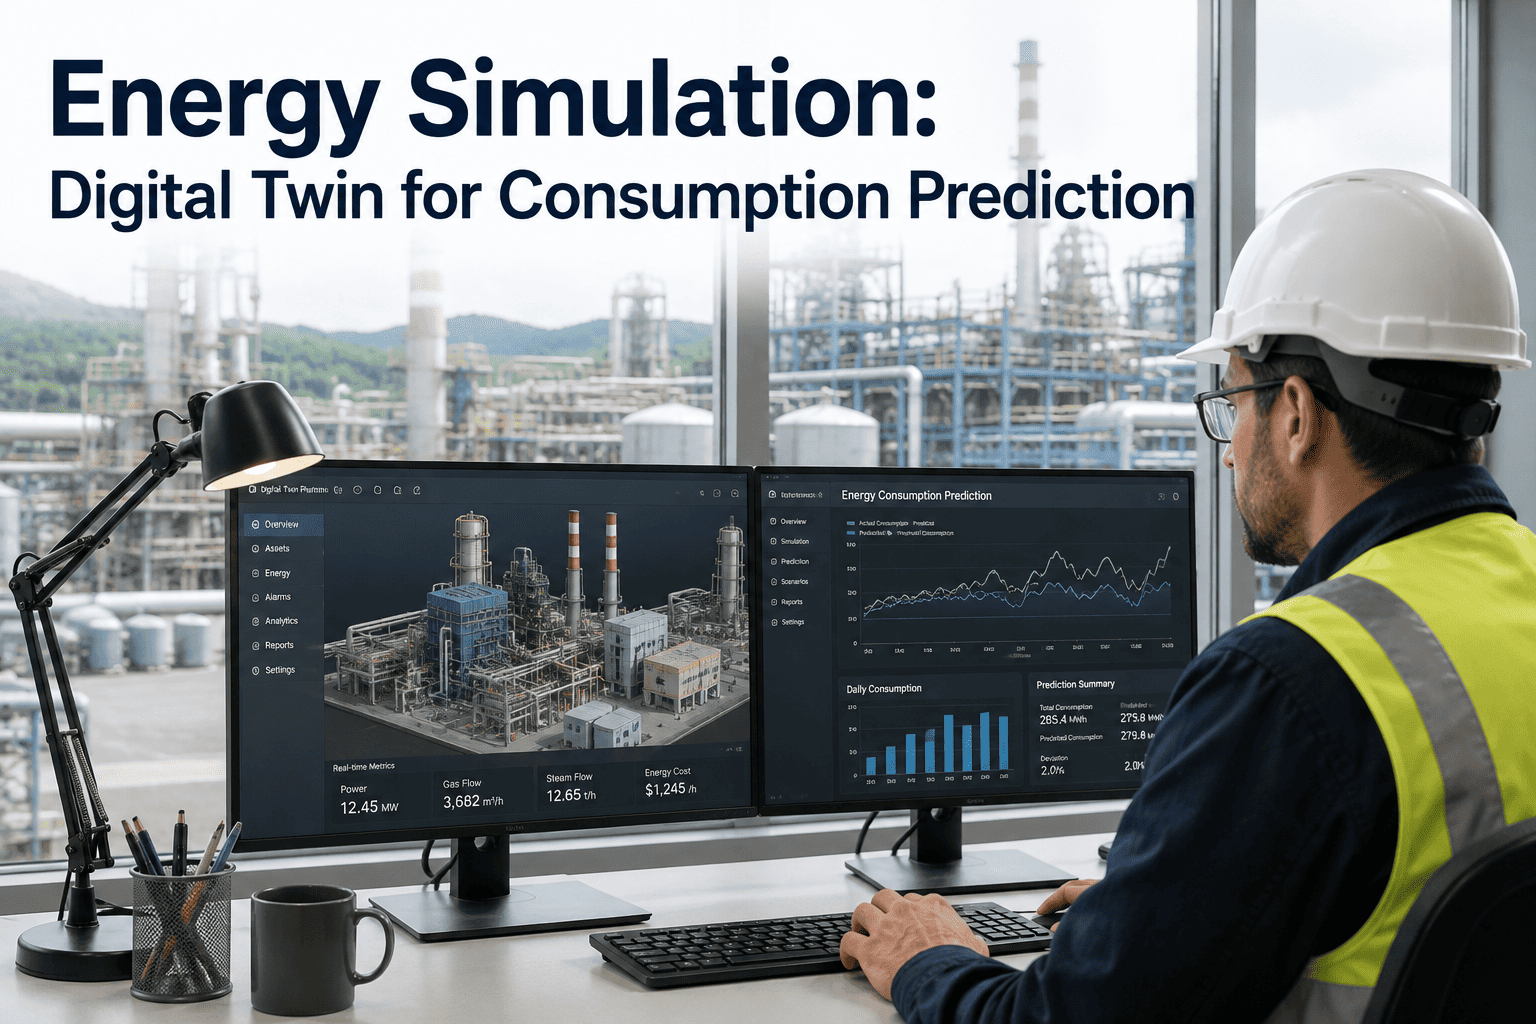
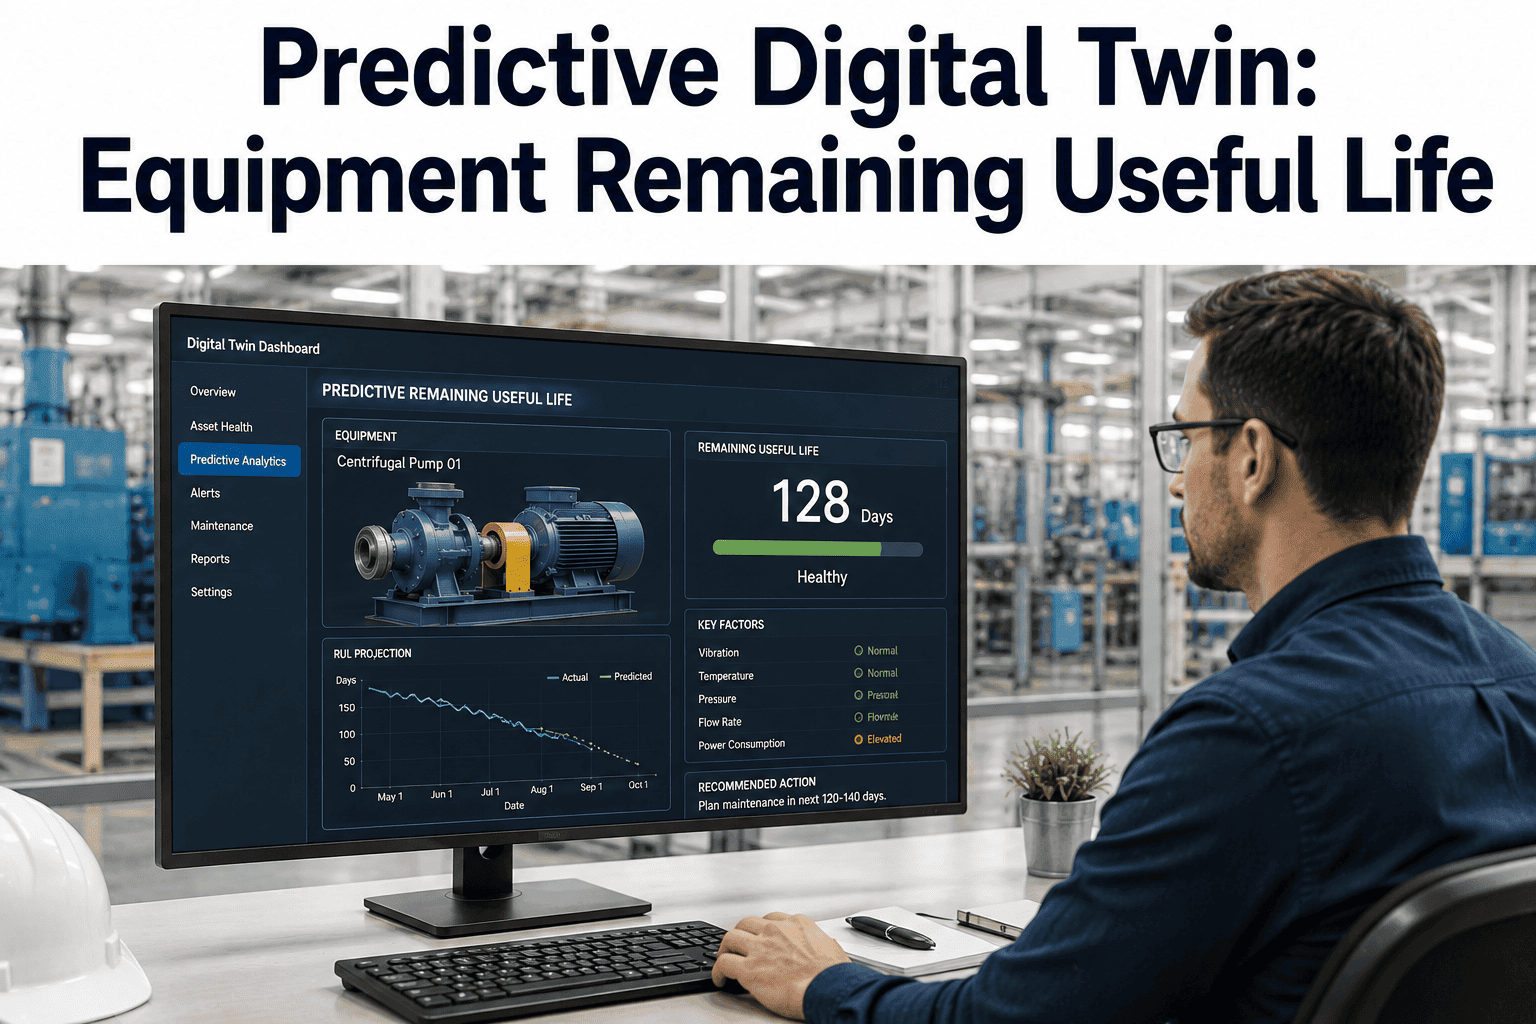
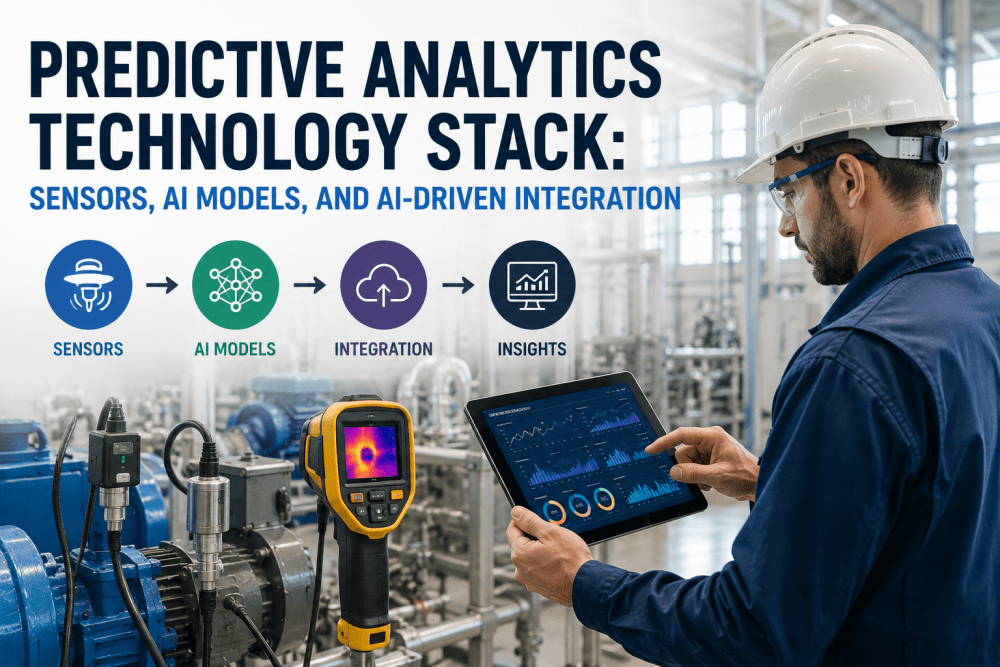
Walking a maintenance floor with AR smart glasses on, looking at a compressor or a pump that has been running for twelve years, and seeing the same equipment rendered as its digital twin floating in the same physical space — with today's temperatures, vibrations, and pressures painted directly onto the geometry, and with the simulation's prediction of where those numbers should be for a healthy machine at this operating point — is a fundamentally different way to do predictive maintenance. It is not a video wall in the control room. It is not a work order on a tablet. It is the physical asset and its digital twin occupying the same visual field, at the same time, with any divergence between them appearing exactly where the technician is already looking. Teams exploring AR digital twin overlay for their assets can Book a Demo to see how iFactory pairs live sensor data with 3D twin models for in-field visualization.
AR SMART GLASSES · DIGITAL TWIN OVERLAY · IN-FIELD VISUALIZATION
AR Digital Twin Overlay: Bringing the Simulation Onto the Real Equipment
A working guide to overlaying digital twin models on physical industrial equipment through AR smart glasses — with real-time simulation comparison, virtual sensor placement, predictive maintenance visualization, and the operator workflows that turn a 3D model in a computer into a diagnostic instrument you wear on your face.
32%
Faster repair completion when technicians use AR-guided workflows
47 min
Average time lost per repair searching for documentation without AR
9 – 18 mo
Typical payback period for industrial AR smart glasses programs
What "Digital Twin Overlay" Actually Means — And Why It Matters
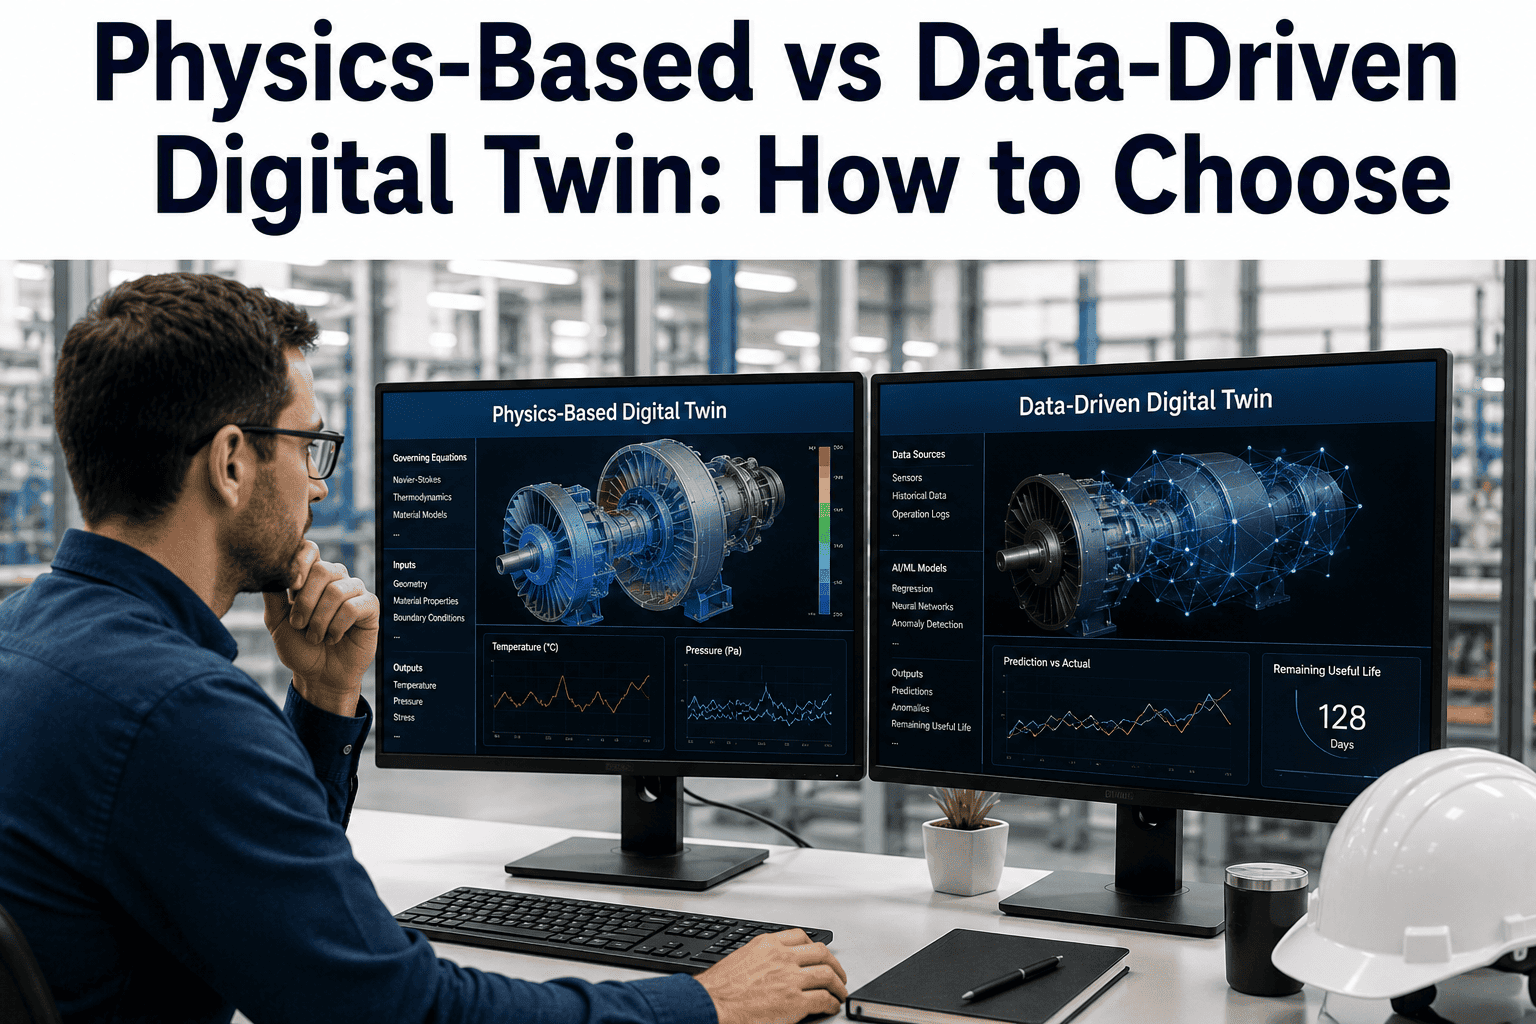
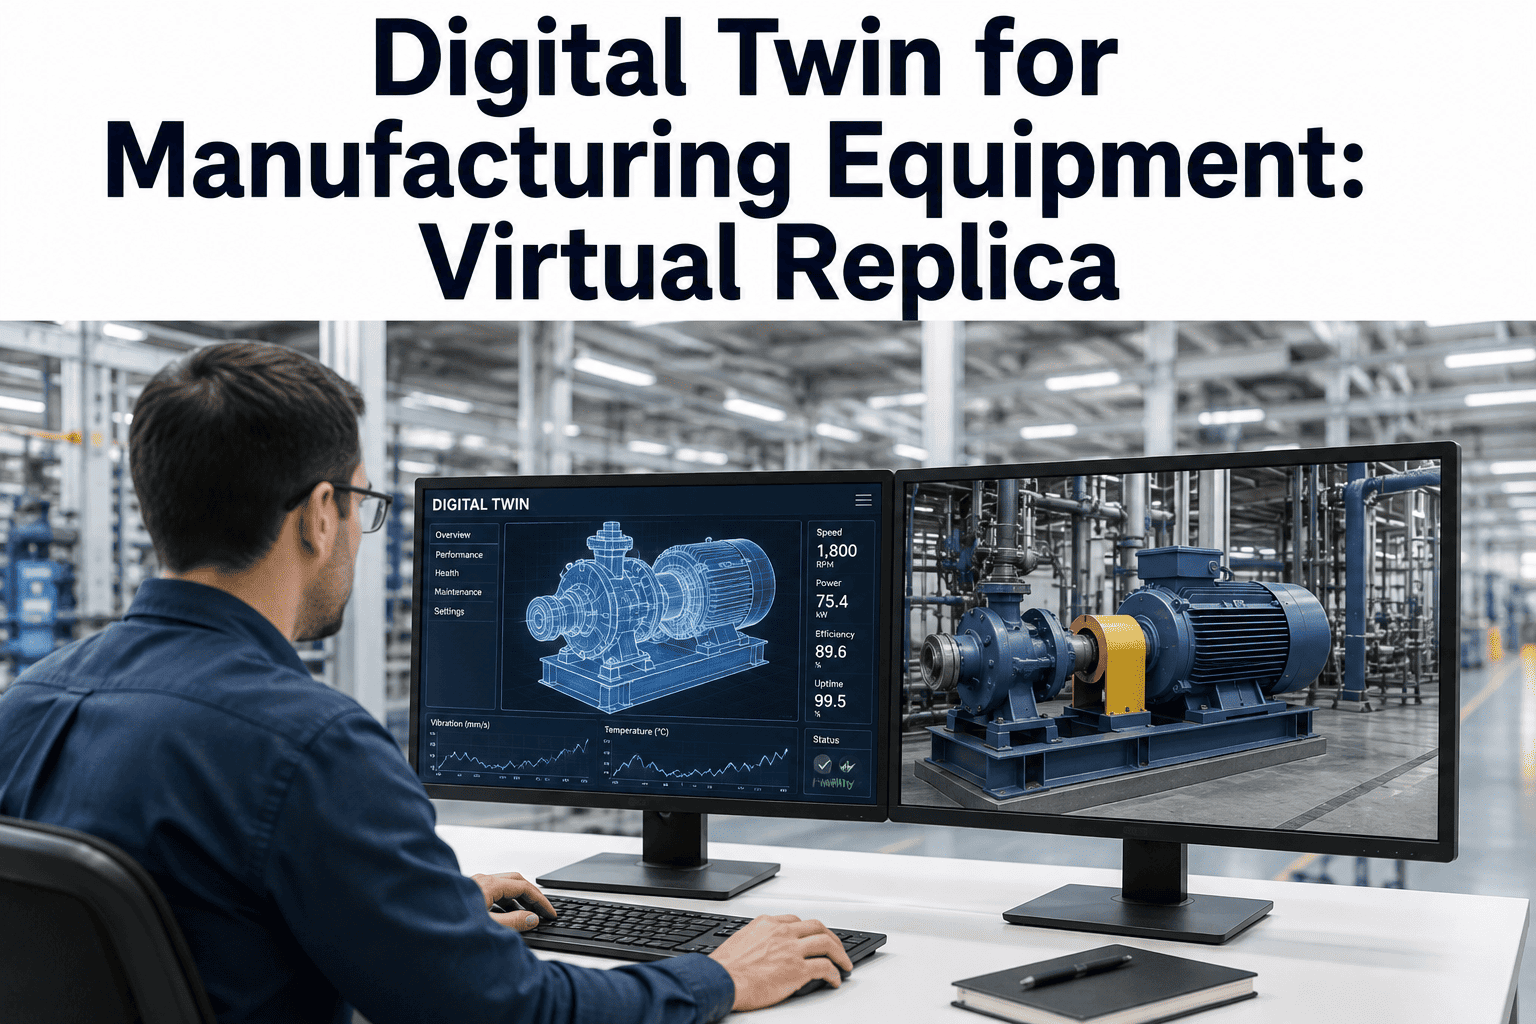
A digital twin, in the practical Industry 4.0 sense, is a 3D geometric and behavioral model of a physical asset that is fed by live sensor data and by simulation logic. It runs alongside the physical asset, taking the same inputs the real machine sees, and it predicts what the real machine should be doing — pressures, temperatures, vibrations, flow rates, thermal profiles. Twins have existed as software constructs for years. What is new is the ability to render the twin into a technician's field of view, spatially anchored to the actual physical machine, so the twin and the reality can be compared visually and instantly.
AR overlay changes the twin from a control-room screen into a diagnostic instrument that lives at the asset. When a technician approaches a piece of equipment wearing AR glasses, the glasses recognize the machine, retrieve the corresponding twin model, and render it aligned to the physical equipment. Live sensor readings appear as floating labels next to the components they measure. The twin's simulated values appear alongside as a reference — this is what a healthy pump would be reading right now, given the current operating point. Divergences highlight visually. Where the physical asset is warmer, cooler, more vibratory, or flowing differently than the twin predicts, the AR display shows exactly where and by how much. The diagnostic conversation between operator and machine happens at the machine, not in a report reviewed later.
The Capability Layer Stack: How AR Twin Overlay Actually Works
AR digital twin overlay is not a single technology — it is a stack of capabilities that have to work together for the visualization to be useful and reliable in the field. Understanding the stack helps set realistic expectations for what a specific deployment can actually deliver, and it helps identify where a pilot program is bottlenecked when it does not deliver what the vendor demonstrations promised. Each layer below has its own maturity curve, its own vendor ecosystem, and its own integration work.
L5
Interaction & Workflow Layer
Voice commands, gesture recognition, or gaze-based selection that let the technician query specific components, drill into sensor history, or launch a work-order-guided procedure — all without taking their hands off the equipment or their eyes off what they are working on.
L4
Twin Comparison & Divergence Highlighting
The simulation engine computes what each measured parameter should be at the current operating point. The AR display renders divergences visually — components running hotter than twin prediction glow red, components running cooler glow blue, and the deltas appear as numerical overlays.
L3
Live Sensor Data Streaming
Real-time sensor readings from the OT infrastructure — SCADA, historian, IoT platform — streamed to the AR device with low enough latency that the values feel live rather than lagging. Sensor identity mapping ties each stream to its position on the twin model.
L2
Spatial Anchoring & Object Recognition
Computer vision that recognizes the physical machine from cameras on the AR device, locks the twin model to it in six degrees of freedom, and holds the alignment stable as the technician walks around and views from different angles. This is where most AR programs succeed or fail on user experience.
L1
3D Twin Model & Component Metadata
The 3D geometric model of the asset — CAD-derived or captured from photogrammetry or laser scan — with every component tagged with metadata, part numbers, sensor locations, maintenance history, and behavioral parameters. This is the foundation everything else renders against.
A working deployment needs all five layers, but the diagnostic value is unlocked at L4. L1 through L3 by themselves produce a nice visualization — the twin floating in space with live values — but the technician still has to interpret whether those values are good or bad. L4 is where the twin actually earns its keep, because the simulation is answering "is this normal?" continuously and highlighting exactly where the answer is no. Programs that deliver L1 through L3 and stop there produce impressive demos and disappointing operational outcomes; programs that deliver through L4 and L5 change how maintenance actually works.
FIVE-LAYER STACK · SIMULATION AWARE · FIELD-DEPLOYED
Deploy the Full AR Digital Twin Stack, Not Just the Visualization Layer
iFactory integrates the full capability stack — 3D twin models, spatial anchoring, live sensor streams, simulation comparison, and voice or gesture interaction — so AR glasses in the field become genuine diagnostic instruments rather than in-view PDF viewers.
Six High-Value Use Cases: Where AR Twin Overlay Pays Back Fastest
AR digital twin overlay is not equally valuable everywhere. Some maintenance and operational tasks benefit dramatically; others get little more than a nice visualization. Understanding the use cases where the technology actually pays back is essential for scoping a program that delivers return within the 9-to-18-month window that industrial AR deployments typically target. The six use cases below cover the majority of high-value AR twin overlay deployments in industrial facilities, each with its own value driver and its own scoping considerations.
CASE 01
Predictive Maintenance Diagnosis at the Asset
Technician approaches a machine flagged with a predictive maintenance alert, and AR shows the specific component where the twin diverges from actual — a bearing running 8 °C hotter than expected, a pump discharge 12% below simulated flow, a valve stem seeing higher-than-expected torque. The diagnosis time drops from hours of drill-down to seconds of visual comparison.
CASE 02
Complex Repair Guidance With Live State Awareness
During disassembly, AR overlays sequence the removal steps, shows torque values on fasteners as they are engaged, and flags safety states — is the equipment de-energized, is the valve isolated, is the pressure vented. The twin's current-state model gates each procedural step against the actual asset condition, catching missed lockouts before the technician creates a hazard.
CASE 03
Virtual Sensor Placement & Simulation Preview
Reliability engineer walks the machine and virtually places a proposed new sensor — a vibration transmitter, a thermocouple, a strain gauge — on the AR view of the equipment. The twin immediately simulates what that sensor would have shown for the past week of operating history, giving the engineer visual evidence of whether the sensor location would actually catch the fault mode of interest.
CASE 04
Simulation-Backed Operational Walkdowns
Operator on a shift walkdown sees each critical asset annotated with twin-vs-actual comparison. Rather than reading gauges and mentally comparing to remembered normal values, the AR display shows the actual, the expected, and any divergence directly on the equipment — a walkdown becomes a systematic health scan rather than a memory-based check.
CASE 05
Remote Expert Collaboration With Shared Twin View
Field technician and remote expert see the same twin overlay simultaneously, with the expert able to annotate directly onto the twin geometry that both people are seeing. Expert draws an arrow at the specific coupling that needs the alignment check, technician follows the annotation on the physical asset with no ambiguity about which coupling was meant.
CASE 06
New Technician Training at the Real Equipment
Trainee wears AR glasses while walking the plant with an experienced operator. Each asset shows its twin, its component labels, its critical safety points, and its typical fault modes with visualization of what a fault would look like. The training curriculum runs in place at the real machines rather than in a classroom with slides.
Physical Reading vs Twin Prediction: The Diagnostic Comparison Table
The heart of AR digital twin overlay's diagnostic value is the moment-to-moment comparison between what the physical asset is doing and what the twin predicts it should be doing. When that comparison is rendered visually in the operator's field of view, patterns that would have taken hours of analyst investigation to surface become immediately obvious. The examples below show the kinds of comparisons a well-integrated AR twin overlay presents, and what each divergence pattern typically signals.
| Component |
Physical Reading |
Twin Prediction |
Divergence Signal |
| Pump Discharge Pressure |
4.2 bar |
4.8 bar |
Impeller wear or partial cavitation — pressure below expected for operating point |
| Motor Winding Temperature |
82 °C |
68 °C |
Bearing drag or cooling fan degradation — motor working harder than model predicts |
| Gearbox Vibration (rms) |
6.8 mm/s |
4.1 mm/s |
Developing bearing or gear defect — vibration above simulated healthy baseline |
| Compressor Discharge Temp |
92 °C |
105 °C |
Reduced compression ratio, valve leakage, or lower actual pressure than measured |
| Heat Exchanger Approach Temp |
8 °C |
3 °C |
Fouling on tube side, reduced heat transfer coefficient over time |
| Valve Actuator Torque |
82 Nm |
55 Nm |
Stem binding, packing tightening, or process condition beyond model envelope |
The diagnostic power of this comparison is not that the numbers themselves are new — SCADA and historians have shown them for decades. It is that the twin's context makes each number interpretable at the moment of observation. A discharge pressure of 4.2 bar means nothing without knowing whether 4.2 bar is normal at this speed, at this flow, at this suction pressure. The twin computes what 4.2 bar means right now, and the AR overlay presents the answer where the technician is already looking. This is the difference between "there is data" and "there is a diagnosis," and it is what makes AR twin overlay a workflow change rather than a display upgrade.
Hardware Reality: What AR Actually Runs On In Industrial Environments
One of the most common misconceptions about industrial AR is that it requires exotic hardware. In practice, most AR maintenance deployments in 2026 run on hardware that fits into three practical categories, each with its own strengths and trade-offs. Understanding the hardware landscape helps ground the AR discussion — the technology is available today at multiple price points, and the choice depends on the operational context far more than on any theoretical hardware ideal.
CATEGORY A
Enterprise AR Smart Glasses
Purpose-built industrial AR glasses — HoloLens, RealWear, Vuzix and similar — with hands-free operation, ruggedized construction, and integration with enterprise management platforms. Typical price range $2,000 to $3,500 per unit, with battery life sized for shift-length operation.
Best fitField maintenance work requiring both hands free, high-precision tasks, and integration with CMMS workflows
CATEGORY B
Ruggedized Tablets & Smartphones
Standard iOS or Android tablets and phones the team already carries, running AR through the device camera. Lower cost, wider familiarity, but requires holding the device to view the overlay. Modern mobile AR frameworks (ARKit, ARCore) deliver production-quality spatial anchoring.
Best fitBroad deployment across many users, quick inspection tasks, environments where head-mounted hardware is impractical
CATEGORY C
Assisted Reality Wearables
Monocular wearable displays that present information in the peripheral field of view rather than overlaying on the equipment. Lighter and less expensive than full AR headsets, but less spatially immersive. Suitable for procedure display, remote-expert video calls, and hands-free reference.
Best fitStructured work instructions, remote-expert collaboration, environments where full AR overlay is not required
The right hardware for a specific program depends on the tasks, the operating environment, and the existing device ecosystem. Programs that require true digital twin overlay with spatial anchoring on complex geometry generally justify Category A hardware. Programs focused on work-instruction delivery and remote-expert calling often start with Category B or C and expand from there. The hardware choice is much less important than the software and integration layers behind it — a well-integrated program on tablets will out-perform a poorly-integrated program on premium AR glasses every time.
SIMULATION + LIVE DATA + AR OVERLAY · FIELD READY
Turn Your Existing Twin Model Into an In-Field Diagnostic Instrument
iFactory extends your existing digital twin models with AR overlay capability — deployed on the AR hardware you already use or on the tablets and phones your teams already carry — so field diagnosis happens at the equipment with full simulation context.
A Scenario: The Compressor That Announced Its Valve Failure Visually
Consider a chemical plant with a reciprocating compressor running as a critical part of a synthesis loop. The compressor has been instrumented for years — suction pressure, discharge pressure, cylinder temperatures, vibration on the crosshead — feeding SCADA and the plant historian. A digital twin has been running for the past two years, modeling the compressor's expected behavior based on gas composition, operating point, and known component condition. AR overlay was rolled out to the reliability team six months ago.
During a routine walkdown, a reliability engineer wearing AR glasses approaches the compressor. The AR overlay renders the twin on the physical machine. Most components show green — actual matches twin prediction within tolerance. But cylinder number three shows a red highlight on the discharge valve area, and a numerical overlay reports "discharge temp 8.5 °C below twin prediction." The engineer walks around to view the same cylinder from the opposite side; the divergence highlight stays locked to the discharge valve as the perspective changes. The twin's simulation logic is telling the engineer that discharge temperature is lower than physics would predict for the measured pressure ratio — the classic signature of a leaking discharge valve that is bleeding compressed gas back into the cylinder on the reverse stroke.
The engineer opens a work order directly from the AR interface, tagging the specific valve, and the diagnosis is captured with a screenshot of the twin divergence at the time of observation. The compressor is scheduled for a valve replacement at the next planned maintenance window, five weeks later. Without the AR overlay, the same divergence would have been detectable in the historian — but only if someone thought to compare discharge temperature against a physics model of expected temperature for the current pressure ratio, which is exactly the kind of analysis that gets deferred when the team is busy with other work. The AR overlay makes the divergence visible passively, during a walkdown that was going to happen anyway.
The Adoption Reality: What Actually Determines Whether AR Programs Succeed
Industry data on AR maintenance program outcomes is now robust enough to see the patterns that separate successful deployments from stalled ones. The pattern is not primarily about the AR technology itself — the hardware and software are mature enough that they work reliably in the field. The pattern is about how the AR program is integrated with the rest of the operational technology stack, how it aligns with actual maintenance workflows, and how the team is brought along.
Programs That Succeed
Have a working digital twin before adding the AR layer
Integrate directly with the existing CMMS and historian
Start with 2 or 3 focused use cases and prove value before expanding
Involve maintenance technicians in scoping and pilot from day one
Have a clear owner accountable for the program's operational outcomes
Match hardware choice to actual task requirements, not vendor demos
Programs That Stall
Deploy AR without a twin behind it — nothing to overlay meaningfully
Treat AR as a standalone system disconnected from CMMS and OT data
Try to cover the whole plant on day one instead of proving a use case
Push the technology top-down without technician engagement
Have no clear operational metric that the AR program is targeting
Buy premium hardware for a use case that tablets would handle
The pattern above is not unique to AR — it is the same pattern that separates successful and unsuccessful adoption of any operational technology, from CMMS rollouts to IoT platforms to predictive maintenance programs. What is specific to AR is the temptation to treat the technology as inherently transformative regardless of context. It is not. AR digital twin overlay delivers real value when the underlying twin, sensor data, and workflow integration are already working; it delivers a nice demo when those foundations are missing.
Frequently Asked Questions
Do we need a working digital twin before deploying AR overlay, or can we start with AR and build the twin later?
A working twin is a prerequisite for meaningful AR overlay of the kind described here. Without a twin doing simulation and prediction behind the scenes, AR reduces to displaying live sensor values and static instructions on the equipment — useful for work-instruction delivery and remote-expert collaboration, but not the diagnostic instrument the twin-overlay approach enables. Programs that want the full value should scope the twin foundation first, get it delivering value in the control room, and then extend the visualization into AR as the second phase. Alternatively, teams can start with AR work-instruction use cases that do not require a twin, prove the operational workflow, and add twin overlay to the same platform when the twin is ready.
What is the difference between AR overlay and just showing sensor data on a tablet?
The difference is spatial anchoring. On a tablet or a control-room screen, the technician has to mentally map from the numerical reading to the physical location on the equipment — which sensor, which component, which side of the machine. AR overlay eliminates the mapping step by rendering the data in place, spatially anchored to the specific component. Combined with twin comparison, the technician does not just see "vibration 6.8 mm/s" as an abstract number; they see the specific bearing that is vibrating, with the number floating next to it, and with a color indicator that says whether 6.8 mm/s is normal for that bearing at this operating point. This shift from data-out-of-context to data-in-context is where the workflow productivity gains actually come from. Teams evaluating this shift can
Book a Demo to compare workflows directly.
What does the twin overlay actually look like — is it a full 3D model or something simpler?
Both approaches are used, and the right choice depends on the use case. For predictive maintenance diagnosis, a full 3D twin overlaid on the equipment with divergence highlighting delivers the most value — the technician sees the machine and its digital counterpart aligned, with visual cues for anything anomalous. For work-instruction delivery, a simpler overlay with component labels, safety indicators, and step-by-step instructions is often more effective — a full 3D model can be visually noisy for a task that only needs specific callouts. Mature deployments typically support both modes and let the technician switch between them based on the current task, rather than forcing one visualization style on every scenario.
How does AR twin overlay handle equipment that has been modified from its original design?
This is a real operational challenge. Twins based on original CAD models diverge from reality when equipment is modified — retrofit sensors, replacement components with different geometry, field modifications for maintenance access. The response is periodic twin updating from either laser scan or photogrammetry capture of the actual current state, or from a maintained twin-as-built record that gets updated when modifications happen. Some AR platforms include capture tooling that lets a technician add or move a component in the twin while looking at the physical modification, so the twin stays current with the asset rather than diverging over time. Support engineers at
iFactory Support can advise on twin-maintenance workflows for equipment that changes over its operating life.
Are there safety concerns with technicians wearing AR devices around operating industrial equipment?
The safety considerations depend on the specific hardware and the specific work environment. Enterprise AR glasses used in industrial deployments are typically certified for hazardous locations equivalent to the environment they will operate in, with intrinsic safety ratings where appropriate. The visual overlay is designed to enhance rather than obstruct the user's view — well-designed AR keeps the real world dominant and adds information peripherally or on demand rather than blocking central vision. Programs should still evaluate the specific tasks and work environments and apply the same PPE and situational-awareness protocols that would apply to any other technology on the maintenance floor. The safety argument for AR generally goes the other way — by keeping technicians informed in their field of view, AR reduces the need to look away at a tablet or manual, which improves attention to what the technician is actually working on.
DIGITAL TWIN · AR OVERLAY · IN-FIELD DIAGNOSIS · WORKFLOW-INTEGRATED
Bring the Twin Out of the Control Room and Onto the Equipment
iFactory delivers integrated digital twin, live sensor streaming, and AR overlay — proven across manufacturing, energy, and process industries — with CMMS and historian integration built in. Book a walkthrough tailored to your asset portfolio, existing twin work, and AR hardware strategy.