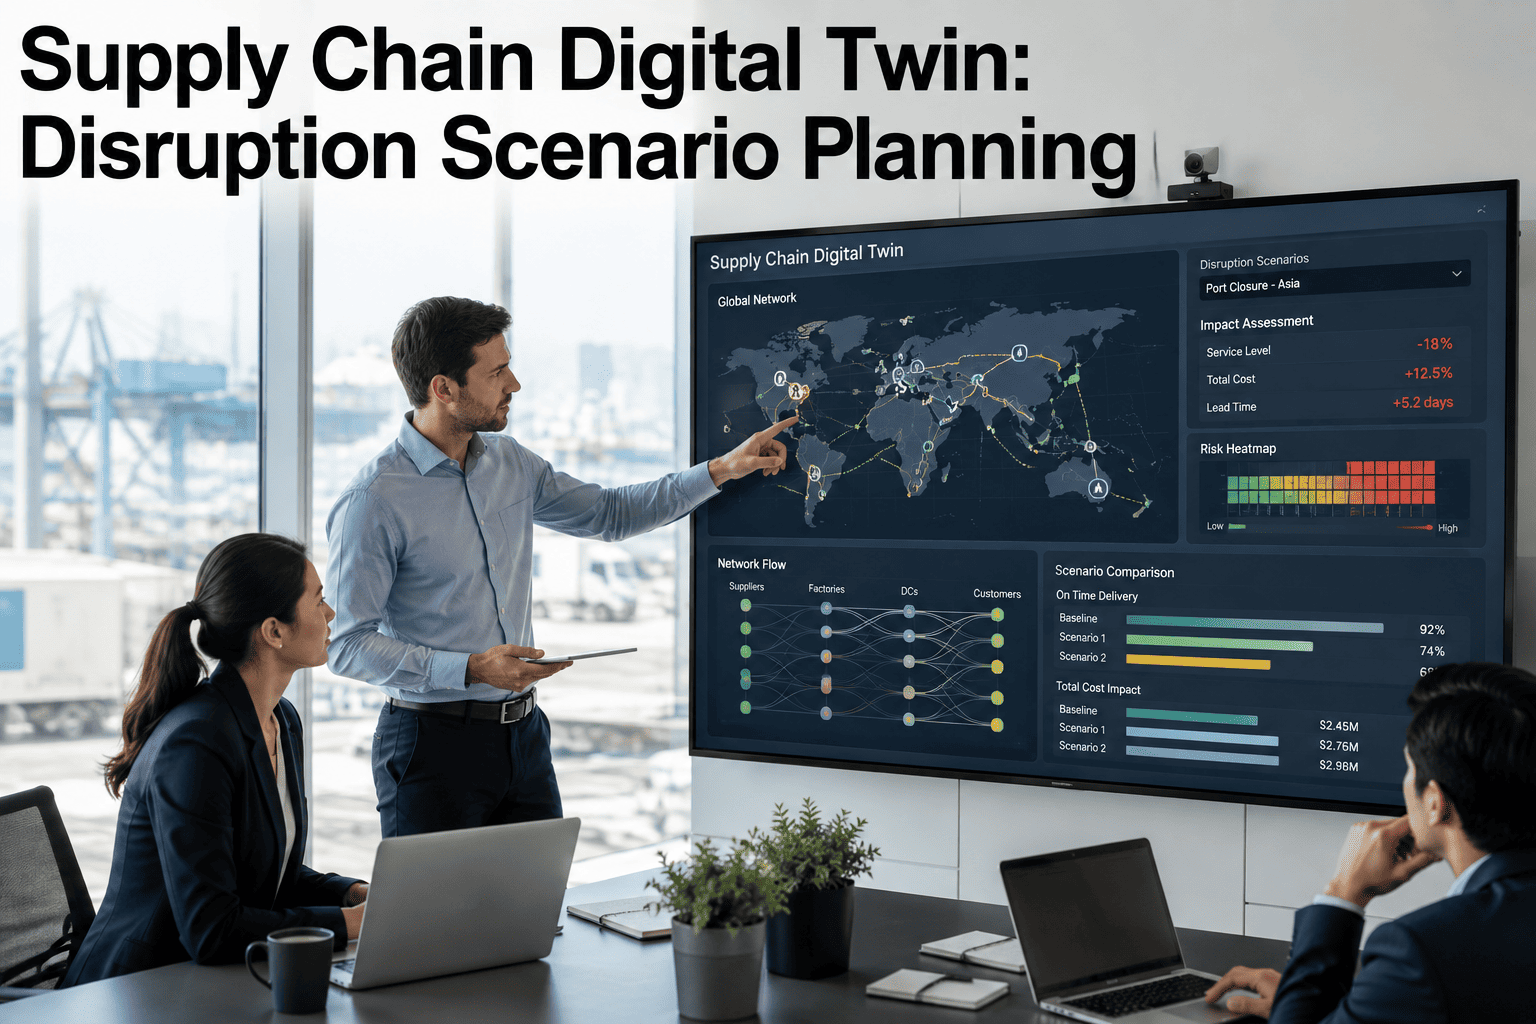
Ask any supply chain leader what actually keeps them awake at night and the answer is rarely a slow quarter — it is the call that comes without warning. A key supplier declares bankruptcy, a port shuts down overnight, or demand for one SKU jumps forty percent while the network is still built around last year's assumptions. Traditional planning responds to moments like these with spreadsheets, instinct, and a scramble that can take days to resolve, days a lean network rarely has to spare. A supply chain digital twin flips that sequence entirely: instead of discovering the damage after a disruption hits, teams simulate it first, on a living virtual replica that behaves like the real network. iFactory builds that replica directly from your existing ERP, transportation, and inventory data, and the support team can walk you through connecting your first data feed in a single working session.
Supply Chain Digital Twin: Stress-Test Disruptions Before They Happen
Model supplier failures, port closures, and demand shocks against a live virtual replica of your network — then compare mitigation options side by side before you commit a single truck, dollar, or unit of inventory.
A Scenario Library Built From What Actually Breaks Networks
Most planning teams only discover their weak points after they fail in production. A digital twin inverts that by letting you load a disruption as structured data — a start date, an affected node, a severity level — and watch how the ripple spreads through cost, service, and capacity before the real event ever occurs. Below are the scenario types that show up most often in production networks, and each one can be run in isolation or combined with others to model compounding failures rather than treating every disruption as an independent event.
Disruptions Are No Longer Rare Enough to Ignore
A decade ago, a network-wide disruption was treated as a once-in-a-generation event — the kind of thing a hurricane or a tsunami caused, not something planners built a permanent process around. That assumption no longer holds. Port blockages, regional lockdowns, sudden tariff shifts, and single-supplier failures now arrive with enough frequency that treating each one as a surprise is itself the risk. Networks that survived the last disruption reasonably well are not necessarily built to survive the next one, because the next one rarely repeats the same failure pattern.
The organizations that come through these events with the least damage share one habit: they had already asked the question before it became urgent. What happens if this supplier goes dark for three weeks. What happens if this port closes for a month. What happens if demand for this product line doubles overnight. Answering those questions in the middle of a live crisis, with a spreadsheet and a conference call, produces worse decisions than answering them calmly, in advance, against a model that already reflects the real network. That gap — between planning under pressure and planning ahead of it — is exactly what a digital twin closes.
There is also a quieter cost to not simulating that rarely shows up on a balance sheet until much later: the slow accumulation of blanket safety stock, redundant supplier contracts, and overly conservative lead time assumptions that planners add simply because nobody could prove a smaller buffer was safe. Simulation replaces that accumulated caution with evidence, which is often how a digital twin pays for itself well before it prevents a single real disruption.
How a Disruption Scenario Actually Runs
A digital twin is only useful if the simulation loop is fast enough to run continuously, not just once a year during an annual planning offsite. iFactory's engine turns each scenario into a repeatable, six-step process that any planner can run without writing a line of code.
Continuous Scenario Testing Beats the Annual Offsite
Most organizations still treat disruption planning as a once-a-year exercise that goes stale within weeks. iFactory runs scenarios continuously against live data, so the network you tested last Tuesday still reflects the network you are actually running today.
How Much Buffer Do You Actually Need?
Over-buffering ties up working capital in inventory that mostly sits still. Under-buffering leaves a network exposed the moment one supplier goes quiet. A digital twin replaces the guesswork by running the same SKU through every severity level and showing the exact number of buffer days each scenario actually requires.
The value of running this exercise per SKU rather than as a blanket policy is what makes it worth doing at all. A commodity part with five qualified suppliers rarely needs more than baseline coverage, while a single-source component feeding a bottleneck line can justify weeks of buffer — and the twin tells you which is which instead of applying the same rule everywhere.
This kind of per-SKU precision is nearly impossible to maintain manually once a catalog crosses a few hundred active items, which is exactly why so many networks default to a single blanket buffer policy in the first place. Running the same disruption scenario across the full catalog automatically, on a recurring schedule, turns buffer sizing from a project someone revisits once a year into a number that stays current as suppliers, lead times, and demand patterns shift.
Operational Continuity and Structural Change Run in Parallel
Digital twin programs that stall usually try to solve everything with a single initiative. The ones that stick separate the work into two tracks that run at the same time, each with its own pace and its own definition of success.
Running both tracks off the same underlying twin, rather than two separate tools maintained by two separate teams, is what keeps them aligned. A reroute decision made this week under Track One should be informed by the same network constraints a sourcing team is weighing for next year under Track Two, and vice versa — otherwise short-term fixes and long-term strategy quietly start working against each other.
A Twin Is Only As Good As the Data Feeding It
The most common reason a digital twin underdelivers has nothing to do with the simulation engine itself — it comes down to data quality. A model built on stale inventory counts or disconnected spreadsheets will produce confident-looking numbers that are quietly wrong. iFactory connects directly to the systems that already run daily operations so the twin reflects the real network, not a snapshot from three weeks ago.
This is also why phased rollout matters more than raw ambition when a program first gets underway. A twin built on a single, well-connected product line delivers more trustworthy scenarios than one stretched thin across the entire enterprise on partial, inconsistent data. Accuracy compounds as coverage expands, but only if each new data feed added actually improves the picture rather than introducing another silo the model has to guess around.
What Changes Once Scenario Planning Runs Continuously
Digital twin programs are worth the rollout effort only if they measurably change how fast and how well the organization responds to real disruptions. These are the indicators worth tracking before and after go-live.
| Indicator | Manual Planning | With Digital Twin |
|---|---|---|
| Time to evaluate a disruption response | Two to five days, spreadsheet-driven | Minutes, run against live data |
| Scenarios tested per quarter | One or two, usually reactive | Dozens, run continuously and on demand |
| Inventory tied up in blanket buffer stock | Applied uniformly across all SKUs | Right-sized per SKU based on actual exposure |
| Visibility into single-source cascade risk | Discovered after a shortage occurs | Flagged before it becomes a production stop |
A Practical Path to Your First Working Twin
Building a full digital twin does not require a two-year data cleanup project before the first useful scenario runs. The programs that deliver value early follow a phased build that produces something usable within weeks, then expands scope from there.
Frequently Asked Questions
See Your Network's Breaking Points Before Reality Finds Them For You
iFactory's supply chain digital twin turns every what-if into a tested, ranked, ready-to-execute plan — built from your real data, run as often as you need it.