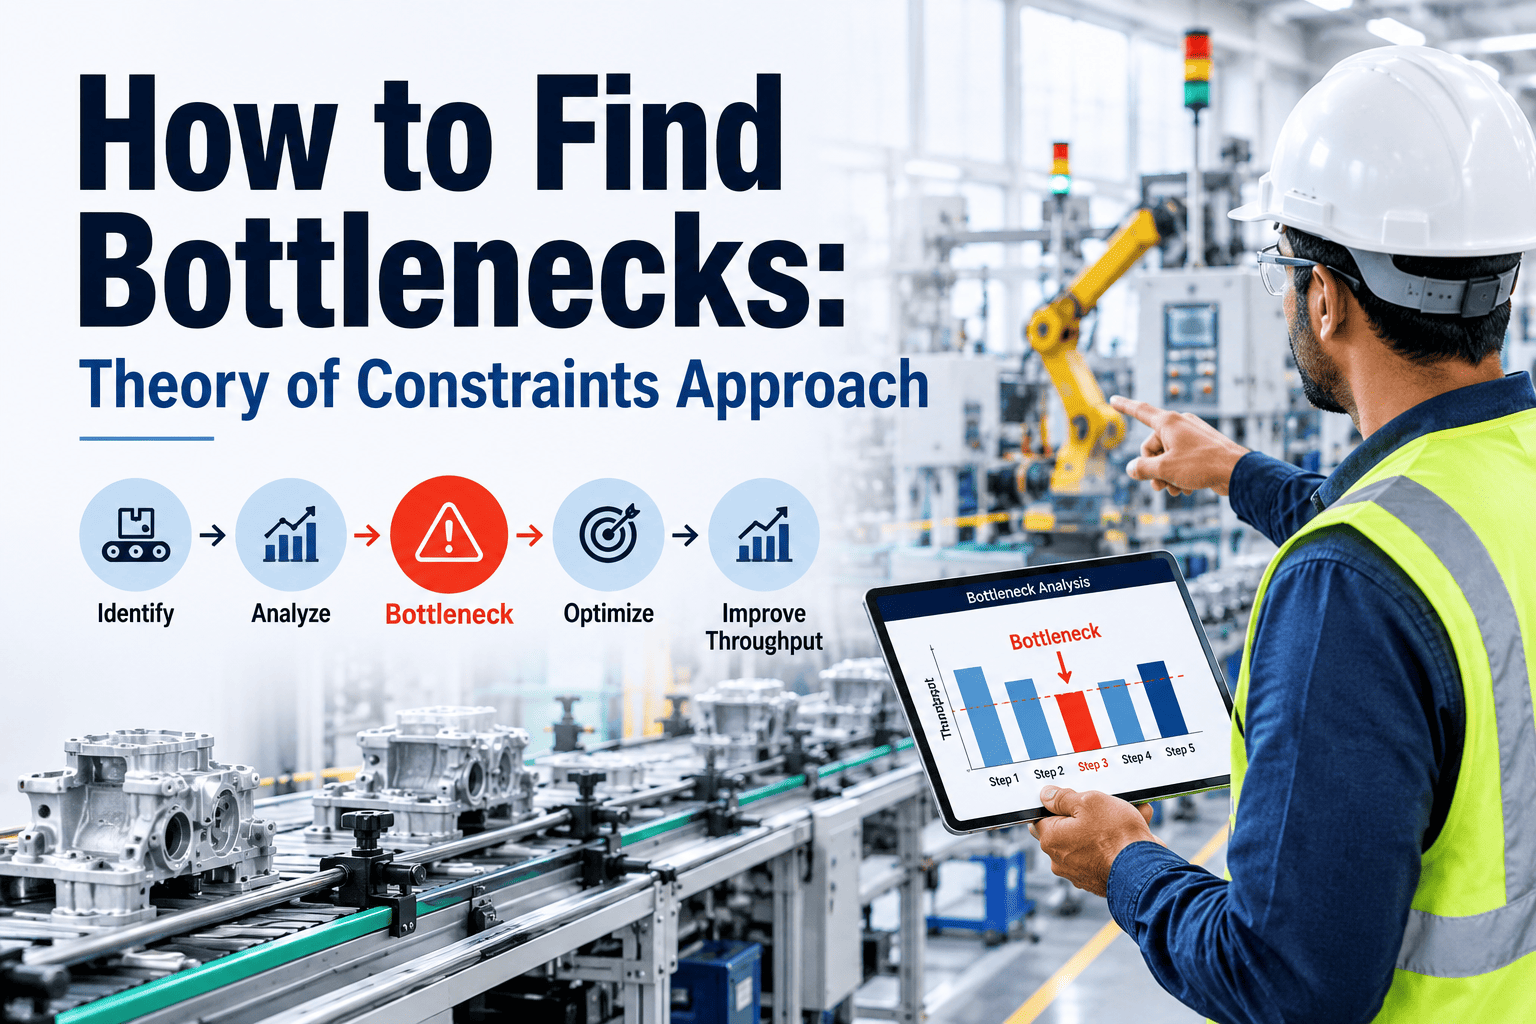
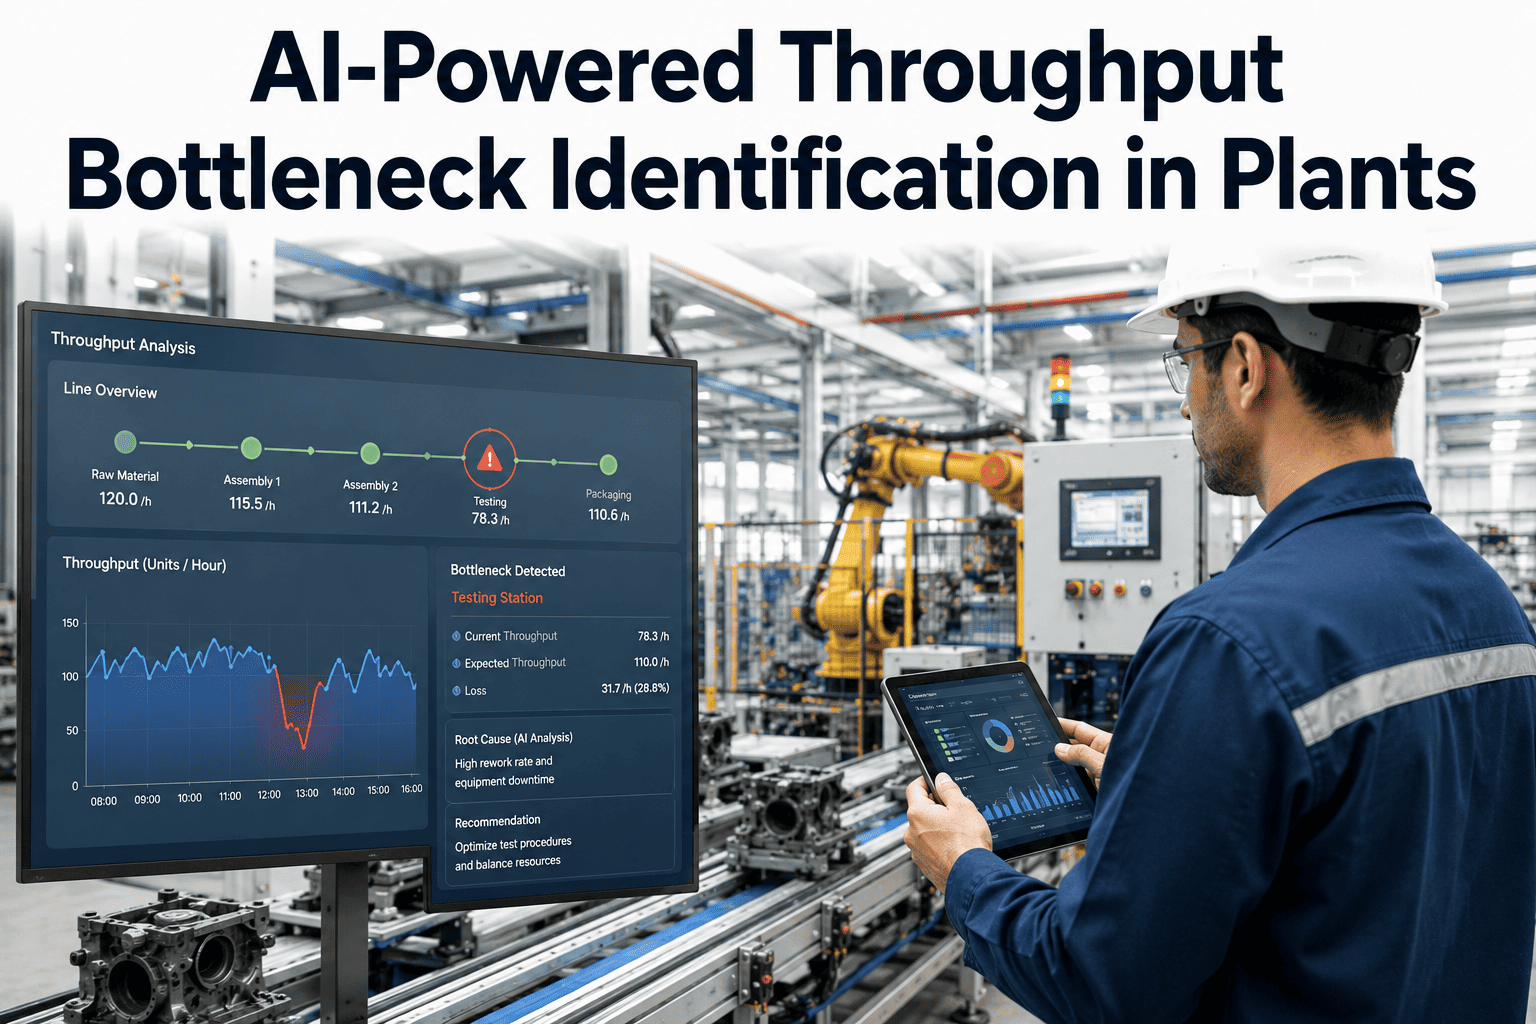
Every manufacturing line has one constraint that dictates the maximum throughput the entire plant can achieve, and it is almost never the constraint that operators and supervisors think it is. The machine with the longest queue is not always the bottleneck. The station with the highest utilization is not always the constraint. Theory of Constraints provides a rigorous method for identifying the true bottleneck, exploiting its capacity, and subordinating every other decision on the floor to that single point, and you can book a demo to see how iFactory applies this methodology using real-time production data.
THEORY OF CONSTRAINTS · BOTTLENECK IDENTIFICATION · THROUGHPUT · DBR SCHEDULING
Your Plant Runs at the Speed of Its Slowest Step — The Question Is Whether You Know Which Step That Actually Is
Theory of Constraints strips away the complexity of multi-station production and reveals the single point that limits your entire throughput. Finding it changes every scheduling, maintenance, and investment decision you make.
Downstream stations cannot exceed 97% utilization because the constraint feeds them at that rate. Upgrading Station D or E without addressing Station C adds zero throughput.
THE CORE INSIGHT
Why Optimizing Non-Constraint Stations Is the Most Expensive Mistake in Manufacturing
The fundamental insight of Theory of Constraints is counterintuitive to most manufacturing managers who have spent their careers trying to improve efficiency at every station. The logic is simple once you see it drawn out: a chain of dependent events can only move as fast as its weakest link, which means any improvement made anywhere except the weakest link produces zero increase in total output. The visualization below shows exactly how this works with real production numbers.
Station
Capacity/Hr
Actual/Hr
Wasted Capacity
Throughput Impact
Machining
120 units
85 units
35 units idle
None (not constraint)
Heat Treat
85 units
85 units
0 units idle
Limits entire line
Finishing
110 units
85 units
25 units idle
None (not constraint)
Assembly
100 units
85 units
15 units idle
None (not constraint)
75 units/hr
Total wasted capacity across non-constraint stations that cannot be recovered because the constraint at Heat Treat caps the entire line at 85 units per hour regardless of what the other stations could produce
FIVE FOCUSING STEPS
The Five Steps of Theory of Constraints That Turn Any Constraint Into a Managed Lever
Eliyahu Goldratt defined five sequential steps that form the complete cycle of constraint management. Most plants attempt step one, skip steps two and three entirely, jump to step four by buying equipment, and never reach step five. The result is capital spent on the wrong problem. Each step below explains what it means in practical terms on a real production floor rather than as an academic concept.
1
Identify the System Constraint
Find the single station or resource that limits the throughput of the entire production line. This is not the station with the most complaints or the oldest equipment. It is the station where work-in-progress consistently accumulates and where the available capacity is closest to or at the demand rate placed on it by current orders.
2
Exploit the Constraint
Squeeze every possible unit of throughput from the constraint without spending money. Eliminate setup time at the constraint station, reduce scrap and rework that wastes constraint capacity, ensure the constraint is never idle during a scheduled shift due to lack of material, breaks, or meetings that could be moved elsewhere.
3
Subordinate Everything Else to the Constraint
Change the scheduling rules, batch sizes, and release rates at every non-constraint station so they feed the constraint exactly what it needs, when it needs it, in the quantity it can process. This often means deliberately slowing down non-constraint stations to prevent them from overproducing and creating WIP pileups ahead of the constraint.
4
Elevate the Constraint If Needed
Add capacity to the constraint only after steps two and three have been fully exhausted. This is where capital investment happens, whether that means adding a shift, buying parallel equipment, outsourcing overflow, or redesigning the process to reduce the constraint time per part. Most plants start here and skip the previous steps entirely.
5
Repeat the Process
Once the current constraint is elevated sufficiently that it is no longer the limiting factor, a new constraint will appear elsewhere in the system. The five-step cycle begins again at step one with the new constraint, which is why constraint management is an ongoing discipline rather than a one-time project with a fixed endpoint.
DRUM-BUFFER-ROPE
How Drum-Buffer-Rope Scheduling Keeps the Constraint Fed Without Flooding the Floor
Drum-Buffer-Rope is the scheduling mechanism that makes Theory of Constraints operational rather than theoretical. The drum sets the pace based on the constraint capacity. The buffer protects the constraint from disruptions upstream. The rope limits the rate at which work is released into the system so that WIP does not accumulate beyond what the buffer needs. The diagram below shows how these three elements interact in a real production environment.
Release Gate
Work released at the rate the constraint can consume it, not at the rate upstream stations can produce it
ROPE
Time Buffer
WIP queue sized to absorb normal upstream disruptions without starving the constraint
BUFFER
Constraint Station
Sets the pace for the entire line. Every schedule decision references this station's capacity
DRUM
Shipping
Output rate matches constraint rate. No advantage to running downstream stations faster
OUTPUT
40-60%
Reduction in WIP on the floor because the rope prevents over-release of material into the system
15-30%
Increase in constraint throughput because the buffer protects it from starvation during upstream disruptions
90%+
On-time delivery rate after DBR implementation because the schedule is built around actual constraint capacity
HIDDEN BOTTLENECKS
Bottleneck Symptoms That Point to the Wrong Cause Until You Dig Deeper
The most dangerous bottlenecks are the ones that disguise themselves as other problems. Operators blame the wrong machine. Supervisors blame the schedule. Managers blame the workforce. The table below maps the most common misdiagnosed bottleneck symptoms to their actual root causes so you can stop treating the symptom and start addressing the constraint.
What You See on the Floor
Operators at Station F are constantly waiting for parts from Station E, and the queue at Station E is always empty by mid-shift while Station D is buried in WIP
Is Actually
The Actual Constraint
Station D is the constraint but its WIP pileup hides the problem because it never starves. Station E runs out of work because Station D cannot feed it fast enough, making Station E appear to be the problem when it is actually the victim
What You See on the Floor
Quality rejects spike at a specific downstream station and the quality team adds inspection capacity there to catch defects earlier, but overall throughput does not improve
Is Actually
The Actual Constraint
The constraint station is producing parts with marginal quality that pass go-no-go checks but fail at tighter downstream specs. Adding inspection downstream catches the symptom but the real fix is improving process control at the constraint where the defect originates
What You See on the Floor
Overtime hours are concentrated at the final assembly station and management assumes assembly is the bottleneck because that is where the delays become visible to the customer
Is Actually
The Actual Constraint
An upstream operation is the true constraint but its capacity shortage shows up as late kits arriving at assembly rather than as a visible queue. Assembly works overtime to compensate for an upstream starvation problem that no one has traced back to its source
Let Your Production Data Reveal the Real Constraint Instead of Guessing
iFactory's platform analyzes station utilization, WIP accumulation patterns, and throughput rates across your entire line to identify the true constraint and calculate the throughput gain from exploiting it.
CONSTRAINT TYPES
Four Categories of Production Constraints and How Each One Behaves Differently
Not all constraints are machines running at full capacity. Some are policies that limit output without any visible queue. Some are resource shortages that appear only during specific product mixes. Some are market-driven constraints that behave differently from internal capacity constraints. Understanding which type you are dealing with determines which of the five focusing steps will actually produce results.
Capacity Constraint
A physical resource whose available time is fully consumed by current demand
Signature Pattern
Persistent WIP queue in front of the station, zero idle time during scheduled shifts, and downstream stations that are never fully utilized because they cannot get enough input from this point.
Exploitation Path
Reduce changeover time, eliminate scrap, eliminate breaks and meetings at this station, then consider adding capacity through overtime, parallel equipment, or outsourcing.
Policy Constraint
A rule or procedure that artificially limits throughput below what physical capacity allows
Signature Pattern
Stations with available capacity that are prohibited from running by batch size rules, quality hold policies, shift schedules, or approval processes that create idle time that has nothing to do with equipment capability.
Exploitation Path
Challenge every policy that creates idle time at or around the constraint. Reduce batch sizes to increase flow, streamline approval steps, and adjust shift coverage to eliminate gaps.
Material Constraint
A raw material, component, or subassembly whose supply rate is lower than the production line can consume
Signature Pattern
The line stops not because any station lacks capacity but because a specific component is not available. The constraint is external to the line but internal to the supply chain that feeds it.
Exploitation Path
Increase safety stock for the constrained component, qualify alternative suppliers, redesign the product to use a more available material, or adjust the production schedule to sequence around supply availability.
Market Constraint
Customer demand is lower than the production line's capacity, meaning the constraint exists outside the plant
Signature Pattern
All stations have idle time, WIP is low across the line, and the plant could produce significantly more than it is selling. The constraint is not internal capacity but the ability to convert capacity into orders.
Exploitation Path
Reduce lead times to win competitive business, lower prices to stimulate demand from price-sensitive segments, or redirect excess capacity to new products or markets that can absorb the output.
EXPLOITATION VS ELEVATION
Why Most Plants Skip Exploitation and Go Straight to Spending Money on the Wrong Solution
The single most common failure mode in Theory of Constraints implementation is jumping from identification directly to elevation. A consultant or engineer identifies the constraint, presents the finding to management, and the immediate response is to approve a capital request for additional equipment. The problem is that exploitation, which costs nothing, typically recovers 20-40% of the lost capacity before a single dollar is spent. The comparison below shows what exploitation captures that elevation leaves on the table.
Jumping to Elevation Without Exploitation
Approach
Purchase additional capacity at the constraint station to increase output
Cost
Capital equipment purchase, installation, commissioning, and training
Timeline
Months from approval to full production on the new equipment
Capacity Gained
Based on the new equipment rating, but often lower due to integration issues
Risk
High. The new equipment may become the constraint or the old constraint may shift unpredictably
Full Exploitation Before Any Elevation Spend
Approach
Eliminate all avoidable losses at the constraint before considering new capacity
Cost
Near zero. Uses existing resources, changed procedures, and better scheduling
Timeline
Days to weeks. Changes to setup procedures, break schedules, and release rates can be implemented immediately
Capacity Gained
Typically 20-40% more throughput from the same physical equipment
Risk
Low. Every change is reversible and operates within existing equipment capabilities
MEASURED THROUGHPUT GAINS
Outcomes Reported From Theory of Constraints Implementation Projects
The figures below reflect results tracked across manufacturing facilities that completed a full five-step TOC implementation including exploitation, subordination, and selective elevation, compared against each facility's own throughput and WIP baseline measured over multiple production periods before and after the change.
34%
Average increase in plant throughput after identifying and exploiting the true constraint
52%
Reduction in total work-in-progress inventory after implementing Drum-Buffer-Rope scheduling
44%
Reduction in manufacturing lead time from raw material release to finished goods shipping
93%
On-time delivery rate achieved after aligning the production schedule to actual constraint capacity
FREQUENTLY ASKED QUESTIONS
Questions Production Engineers Ask About Theory of Constraints and Bottleneck Identification
How is the true constraint different from the station with the longest queue?
The station with the longest queue is often the constraint, but not always, because queue length is influenced by batch size, scheduling sequence, and upstream release rates as much as by capacity. A non-constraint station with very large batch sizes can develop a longer queue than the actual constraint if the scheduling system releases work in large chunks. The true constraint is identified by comparing the demand placed on each station against its available capacity over a sustained period, not by looking at a single snapshot of queue depth at one moment in time.
Book a demo to see how iFactory calculates constraint status from continuous utilization data.
What happens if there are multiple stations running at near-full capacity simultaneously?
True simultaneous constraints are rare in practice and usually indicate that the plant is being overdriven beyond its sustainable capacity, which means every station appears constrained because the demand rate exceeds what the system as a whole can deliver. In this situation the correct response is not to elevate multiple stations but to reduce the release rate to a level the system can actually sustain, identify which station is the most constrained among the group, and focus exploitation efforts there first. Adding capacity to multiple stations simultaneously is the most expensive and least effective response to this situation.
Contact support to discuss how to handle apparent multi-constraint scenarios.
Does Theory of Constraints work for job shops where every order has a different routing?
Yes, but the constraint may shift between orders depending on which work centers each order requires. In a job shop the constraint is often a specific work center rather than a specific machine, meaning any machine in that work center can become the constraint when a high-volume order routes through it. The identification process uses aggregate load analysis across the work center rather than tracking a single product flow, and the exploitation steps focus on reducing setup time and increasing availability across all machines in the constrained work center rather than optimizing one machine in isolation.
Book a demo to see work center level constraint analysis for job shop environments.
How does TOC relate to Lean Manufacturing and Six Sigma, and should we choose one over the others?
These methodologies address different layers of the same problem and are most effective when used together rather than in competition. Theory of Constraints identifies where to focus improvement efforts by finding the constraint that limits throughput. Lean Manufacturing provides the tools to eliminate waste and improve flow at and around that constraint. Six Sigma provides the statistical methods to reduce variation in the constraint process so its output is predictable and consistent. Choosing one methodology to the exclusion of the others means leaving valuable improvement leverage on the table, and most mature operations use all three in an integrated improvement system.
Contact support to discuss how iFactory supports integrated TOC and Lean analysis.
How do we measure whether our exploitation efforts are actually working before deciding to elevate?
The primary metric is constraint throughput measured in units per hour over a rolling average that smooths out shift-to-shift variation. If exploitation is working, this number will increase without any change in equipment or staffing at the constraint station. Secondary metrics include WIP levels in the buffer zone, which should decrease as upstream subordination improves, and on-time delivery, which should improve as the schedule becomes aligned with actual constraint capacity. If throughput at the constraint has not increased after a full exploitation cycle of two to four weeks, then elevation is justified because you have confirmed that the remaining gap cannot be closed through operational changes alone.
Book a demo to see how iFactory tracks constraint throughput in real time.
Stop Guessing Where Your Bottleneck Is and Let the Data Show You
iFactory's platform monitors every station on your line, calculates actual utilization against available capacity, and identifies the true constraint along with the throughput you can recover by exploiting it before spending a dollar on new equipment.