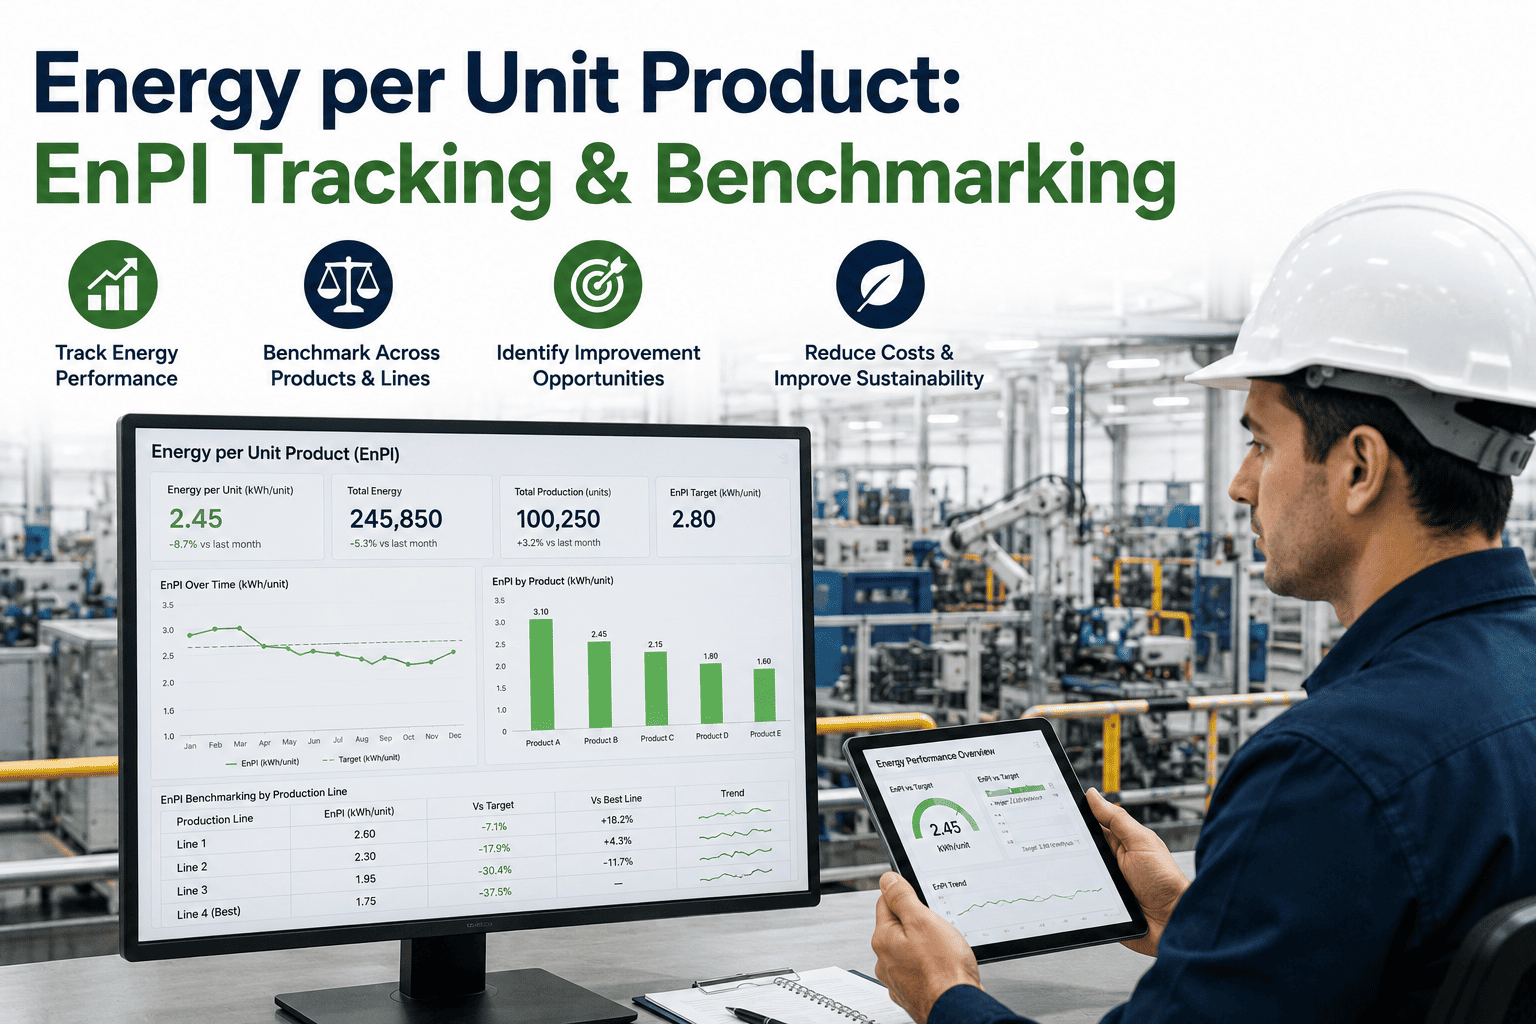
Total plant energy consumption going down looks like good news until you check whether production volume dropped by more. Raw kWh or GJ numbers on their own can't tell you whether a plant is getting genuinely more efficient or just running less product, and that ambiguity is exactly why energy per unit of output, normalized for volume, product mix, and weather, is the metric that actually holds up under scrutiny. iFactory calculates and tracks normalized EnPI continuously so efficiency claims are grounded in output-adjusted numbers rather than raw totals, and the normalization logic is worth understanding before you Book a Demo.
Raw Energy Totals Hide Whether You're Actually More Efficient
A plant that used less energy this month than last month isn't necessarily more efficient — it may simply have produced less. iFactory normalizes energy consumption per unit of output for production volume, product mix, and weather, so the trend line reflects real efficiency change, not a production swing dressed up as one.
Volume, Mix, And Weather All Distort The Raw Number
Energy Performance Indicators exist because absolute energy consumption is influenced by far more than how efficiently a plant is operating. A quiet production month drops total energy use even if every piece of equipment is running exactly as inefficiently as before. A shift toward a more energy-intensive product in the mix raises total consumption even if per-unit efficiency has actually improved. A hot summer raises cooling load independent of anything happening on the production floor. Without correcting for these three factors, a plant can report a misleading efficiency trend in either direction, either claiming credit for gains that were really just a slow month, or missing genuine improvement that got masked by a weather swing or a heavier product mix.
Volume Normalization
Energy consumed is divided by units produced in the same period, so a slower production month isn't mistaken for a genuine efficiency gain and a busy month isn't mistaken for a decline.
Product Mix Normalization
Different products carry different intrinsic energy intensity, so a shift in what's being produced is separated out from a shift in how efficiently any single product is being made.
Weather Normalization
Heating and cooling degree-day data is used to strip out the portion of energy use driven by outside conditions, isolating the portion that's actually under operational control.
A Trustworthy Number Only Matters If Someone Acts On It
Getting the normalization right solves the trust problem, but the real value of EnPI tracking shows up when the number is routed to the people who can act on it. A plant-wide figure reported once a month to a sustainability team rarely changes day-to-day operating behavior, while a per-line or per-shift figure available to production supervisors creates a feedback loop tight enough to actually influence decisions, such as staging equipment start-up sequences or flagging a line that's drifting away from its historical intensity before the monthly rollup even happens. The normalization work is what makes that faster feedback loop credible instead of noisy.
Shift And Line-Level Visibility
Normalized intensity broken down below the plant total gives supervisors a number they can actually influence during their own shift rather than a lagging plant-wide average.
Drift Alerts Ahead Of The Monthly Report
A line trending away from its normalized baseline generates an alert well before the figure would otherwise surface in a monthly energy report, shortening the gap between a problem starting and someone noticing it.
What Changes When Energy Is Measured Per Unit Of Output
| Aspect | Raw Energy Total | Normalized EnPI |
|---|---|---|
| Reflects true efficiency change | Only when volume and mix are stable | Consistently, regardless of volume swings |
| Comparable month to month | Distorted by production swings | Comparable on a like-for-like basis |
| Weather sensitivity | Embedded, unaccounted for | Stripped out through degree-day correction |
| Useful for ISO 50001 reporting | Limited on its own | Aligned with standard EnPI methodology |
What Goes Into A Defensible EnPI Baseline
A normalized number is only as useful as the baseline it's compared against. iFactory builds a rolling baseline period from historical production and energy data, then re-baselines when a structural change — a new line, a major equipment retrofit, a significant product mix shift — makes the old baseline no longer representative. Tracking against a stale baseline is one of the more common reasons EnPI programs lose credibility internally, since a target set against outdated operating conditions either looks trivially easy to hit or unfairly difficult, and either way stops being a useful management signal.
Rolling Baseline Period
A baseline built from a representative historical window, long enough to average out short-term noise but recent enough to reflect current equipment condition and product mix.
Structural Change Re-Baselining
When a line addition, retrofit, or major mix shift changes what "normal" energy intensity looks like, the baseline is updated rather than left to quietly become irrelevant.
Get An Energy Trend You Can Actually Trust
iFactory normalizes energy per unit output so efficiency reporting reflects real operational change.
Peer Benchmarking Across Sister Plants And Industry Averages
Once a plant has a defensible normalized figure for itself, the next useful step is comparing that figure against sister plants running similar processes, or against published industry averages for the sector. This kind of comparison only holds up if every site is normalized the same way, since comparing one plant's weather-corrected figure against another site's raw total produces a misleading gap that has nothing to do with actual operating performance. Multi-site manufacturers get the most value here, since a consistent normalization methodology applied across every location turns EnPI from a single-site management tool into a genuine cross-plant benchmarking and capital-prioritization tool.
Consistent Cross-Site Methodology
Every site is normalized using the same volume, mix, and weather correction approach, so a comparison across locations reflects real performance differences rather than methodology differences.
Capital Prioritization Signal
A reliable cross-site ranking helps prioritize where energy efficiency capital investment will have the greatest impact, rather than spreading budget evenly across sites regardless of actual normalized performance gaps.
We used to report month-over-month energy numbers to leadership and get asked every quarter whether the drop was real or just a slow production month, and we didn't always have a confident answer. Since we started tracking normalized energy per unit with iFactory, that question doesn't come up anymore because the number already accounts for volume and mix, and our ISO 50001 reporting has gotten noticeably easier to defend during audits.
What Plants Report After Adopting Normalized EnPI Tracking
Frequently Asked Questions
Q: What data do we need to have in place before this works?
The core requirement is metered energy data at a usable granularity alongside production output records for the same periods, ideally broken down by product or product family if mix normalization is a priority. Weather normalization uses standard degree-day data that doesn't require any additional plant instrumentation. Reach out through Support Contact to review what you currently have in place.
Q: How is this different from what our energy management software already reports?
Many energy dashboards report totals or simple ratios without correcting for weather or product mix, which leaves the same ambiguity this approach is meant to remove. The normalization methodology here follows standard EnPI practice used in ISO 50001 programs, applying volume, mix, and weather correction together rather than reporting a single uncorrected ratio.
Q: How often does the baseline get updated?
The baseline is reviewed on a regular cadence and updated whenever a structural change is detected, such as a new production line coming online, a major retrofit, or a sustained shift in product mix that would otherwise make historical comparisons misleading. Routine short-term fluctuations don't trigger a re-baseline, since the goal is a stable reference point, not one that moves with every month's noise.
Q: Can this support our sustainability or ESG reporting requirements?
Yes, normalized energy intensity per unit output is a commonly requested metric in sustainability disclosures and customer scorecards, since it demonstrates efficiency improvement independent of production volume changes, which raw energy totals alone cannot do. Discuss your specific reporting framework during a Book a Demo session.
Q: Does this work across multiple plants with different product lines?
Yes, each plant and product line is normalized against its own baseline and mix profile, and the resulting per-unit figures can then be compared across sites on a like-for-like basis, which raw totals or simple energy-per-revenue metrics generally can't support with the same reliability.
Track Efficiency, Not Just Volume-Driven Noise
iFactory delivers a normalized EnPI you can defend in front of leadership and auditors alike.