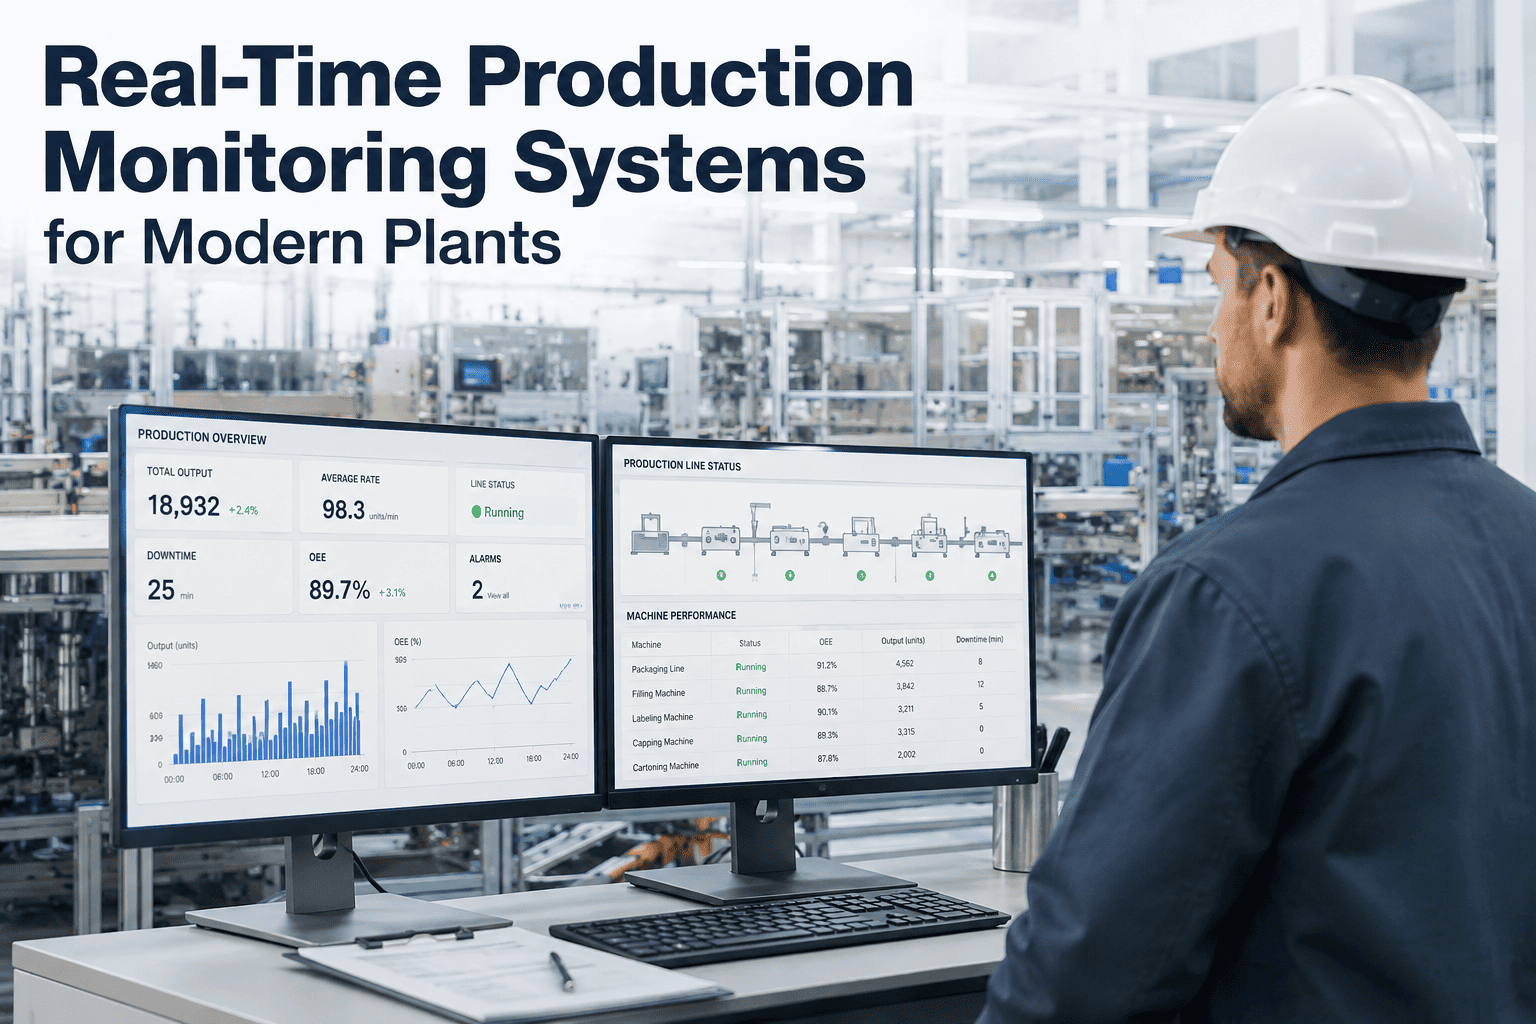
Most plants can tell you their OEE score to the decimal point and still have no idea how much money that score is costing them every month. The median manufacturing facility runs at roughly 60% Overall Equipment Effectiveness, while the top quartile reaches 75% and world-class operations sit near 85% — and the gap between those numbers isn't a capital problem, it's a visibility problem. Manual shift logs and hand-tracked downtime routinely overstate true OEE by 8 to 15 points, because short stops and small speed losses simply never make it onto a clipboard. This guide translates that visibility gap into dollars: what real-time OEE tracking typically recovers, how fast it pays for itself, and where the improvement actually comes from once a plant can see its own losses in real time, broken down by industry so the numbers are grounded in something closer to your own operation than a generic average. A short demo shows what that recovered capacity looks like against your own production data.
The Hidden Factory Inside Every Plant
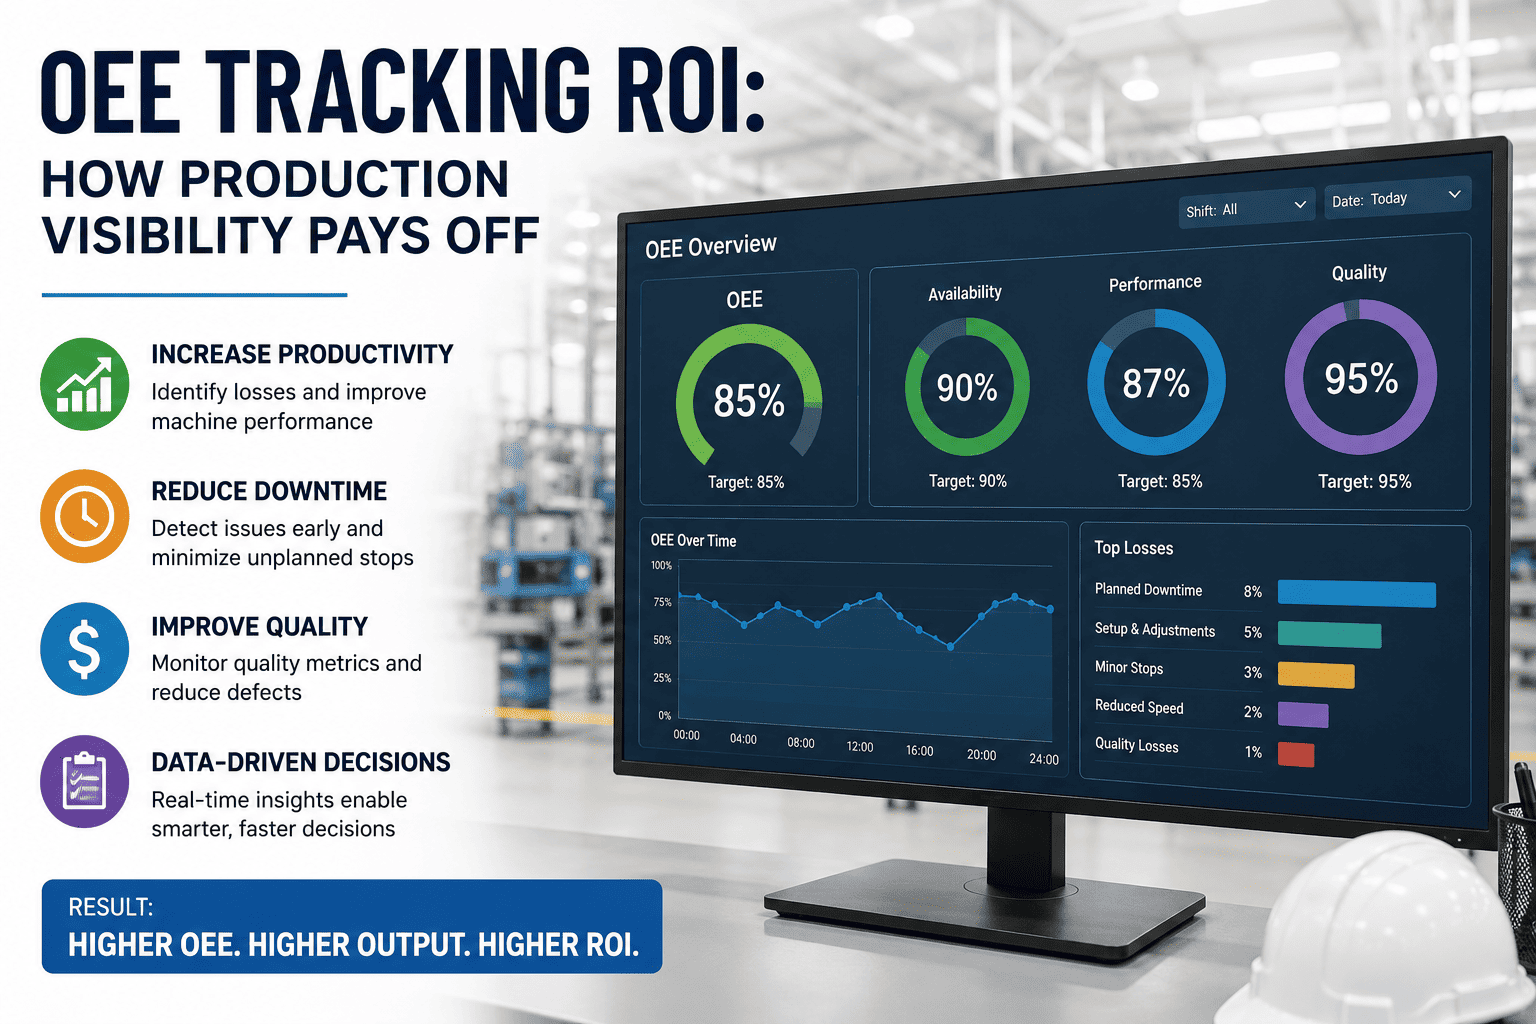
OEE is a deceptively simple metric built from three numbers multiplied together: Availability, the share of planned production time actually running; Performance, how close the line runs to its ideal cycle speed; and Quality, the share of output that's good on the first pass. Because the three factors multiply rather than average, a plant that looks acceptable on each one individually can still post a mediocre overall score — 90% availability, 90% performance, and 90% quality multiply to just 73% OEE, not the 90% intuition suggests. That compounding effect is exactly what creates the "hidden factory": the 30 to 45% of theoretical capacity that most plants are quietly not producing, spread invisibly across breakdowns, minor stops, slow cycles, and scrapped parts that never show up as a single line item anyone gets blamed for. Traditionally these losses are grouped into what's known as the Six Big Losses — breakdowns, setup and adjustment, idling and minor stops, reduced speed, startup rejects, and production rejects — and every one of them maps directly back to one of the three OEE factors below.
Where Your Plant Sits on the OEE Ladder
Knowing the industry ladder matters because it turns an abstract percentage into a concrete gap. Discrete manufacturers average 66 to 67% OEE, just above the broader median of about 60%, while the top quartile of measured facilities reaches 75% and true world-class operations — 90% availability, 95% performance, 99% quality, multiplied together — land near 84.6%. The distance between where a plant sits today and the next rung up is, in almost every documented case, worth pursuing before any capital equipment upgrade is even considered, since the gap is almost always a measurement and process problem rather than a machine capacity problem. A plant that has never measured OEE with real-time, automated data collection has no reliable way of knowing which rung it's actually standing on, which is itself the first thing worth fixing.
These benchmarks are most useful as a starting reference rather than a fixed target, since the right goal for any specific plant depends on its equipment age, product mix, and how much of its current gap is measurement error versus a genuine process loss. A facility currently reporting 70% OEE from manual logs may, once measured continuously, discover its real starting point is closer to 58%, which changes the entire conversation about what "improvement" even means. This is why the first real deliverable of an OEE program isn't a target — it's an accurate baseline, measured the same way every shift, every day, so that every future percentage point gained is one that would hold up under a finance team's own review. Once that baseline exists, moving up even one rung on the ladder — say from industry average to discrete manufacturing average, or from there to top quartile — becomes a specific, trackable project rather than an abstract aspiration.
Where The OEE Gap Actually Comes From
Not all lost capacity comes from the same place, and the ranking matters because it tells a plant where to point its first improvement effort. Across most manufacturing environments, availability losses — breakdowns, changeovers, and unplanned stops — make up 60 to 70% of the total OEE gap by themselves, which is why real-time downtime detection tends to deliver the fastest and largest return of any single OEE initiative. Performance and quality losses matter too, but they tend to become the higher-leverage target only after the availability gap has already been substantially closed. Prioritizing in this order also tends to match how quickly each loss category can be measured accurately: downtime events are the easiest to capture automatically, while subtle speed and quality drift often take a little longer to model reliably.
Documented OEE Improvement by Industry
Real-time monitoring deployments consistently show measurable OEE gains within the first 90 days, though the size of the gain varies by sector depending on how much of the existing loss was previously invisible to manual tracking. The figures below reflect anonymized results across hundreds of deployments rather than a single facility's best-case outcome, which makes them a reasonable planning baseline for a first-year target. Across the full dataset, the range runs from about 4 to 12 percentage points, with the sector-level averages below sitting comfortably in the middle of that range. It's worth noting that these figures represent the gain measured after real-time tracking replaced manual logging, not the gain from process changes alone — in most cases the first several points come simply from finally seeing losses that were always happening but never recorded, before any operational change is made at all.
| Industry | Typical 90-Day OEE Gain | Primary Driver |
|---|---|---|
| Food & Beverage | +6.2 points | Changeover time and micro-stop visibility |
| Pharmaceutical | +8.4 points | Batch record accuracy and validated-line downtime capture |
| Automotive Tier-1 | +7.1 points | Cycle-time variance and cell-level downtime detection |
| Metals & Fabrication | +5.8 points | Setup reduction and machine-level fault code capture |
From OEE Score to Action: Closing The Loop
A number on a dashboard has never fixed a bottleneck by itself — it's what happens after the score updates that determines whether an OEE program pays for itself. The plants that convert visibility into actual improvement share a common pattern: losses get reviewed at the shift level while the cause is still fresh, recurring stoppage codes get routed into a maintenance work order instead of being re-discovered the next week, and line-level OEE, not a single blended plant average, drives where the next improvement project gets funded. Facilities that skip this loop tend to see an initial jump in visibility followed by a plateau, since the team can now see the hidden factory but has no structured process for shrinking it. A short daily huddle built around the previous shift's top loss reasons, rather than a monthly report reviewed long after the context is gone, is consistently the cheapest and fastest way to close this loop.
This is also where the connection to predictive maintenance becomes valuable rather than optional. Availability loss and equipment condition are tightly linked, and a platform that can tell the difference between a wear-related stop and a purely operational one gives a plant a much sharper picture of which losses are mechanical and which are procedural — two categories that call for very different fixes and very different owners. Quality teams benefit from the same connection in reverse: a spike in first-pass rejects that lines up with a known changeover or a specific shift is far easier to root-cause when the OEE system and the quality data live in the same place instead of two separate spreadsheets. Over time, this shared view also makes it easier to justify the next round of investment, since the case for a new sensor or a wider rollout can point to a specific, already-documented loss rather than a general appeal to "better visibility."
Calculating What Your OEE Points Are Worth
The dollar value of an OEE point depends entirely on plant size and margin, but the pattern holds across facility sizes: the value of visibility compounds every month it's missing, and it compounds again once it's captured. A $20 million plant recovering 10 OEE points typically realizes $350,000 to $700,000 in annual value, which means every month without real-time measurement is leaving roughly $29,000 to $58,000 unaddressed. At the smaller end, even a single machine gaining 5 OEE points commonly recovers $3,000 to $5,000 a year in reclaimed production capacity, a number that scales quickly once applied across an entire line or plant. Mid-market OEE platforms typically run $90,000 to $220,000 a year for three to eight production lines, including sensor hardware, deployment, and operator training, which is why the payback window below matters as much as the raw savings figure. Facilities that avoid PLC-level integration work during deployment also tend to avoid the 30 to 50% cost overrun that traditional MES-style projects often add on top of the base subscription.
Mistakes That Undercut OEE Tracking ROI
An OEE tracking investment can still underperform even after the sensors and dashboards are installed, and almost every case of a disappointing result traces back to one of the same handful of avoidable mistakes. Recognizing these early is usually cheaper than discovering them a year into a program that isn't delivering the return it was funded on, and most of them are organizational habits rather than technology limitations, which means they're fixable without touching the platform itself.
Frequently Asked Questions
None of these figures require a leap of faith — they're the documented, repeatable outcome of simply being able to see losses that were always there but never measured. The plants that get the most out of an OEE program treat the first 90 days as a baseline-setting exercise rather than a finished result, then let line-level data, not an industry average, decide where the next improvement effort goes. A conservative target built this way tends to be the one that actually survives a full budget cycle, and it also tends to be the one that quietly keeps paying off long after the initial rollout, since every additional line added to the platform brings its own hidden factory along with it — capacity that was there all along, just waiting to be measured.