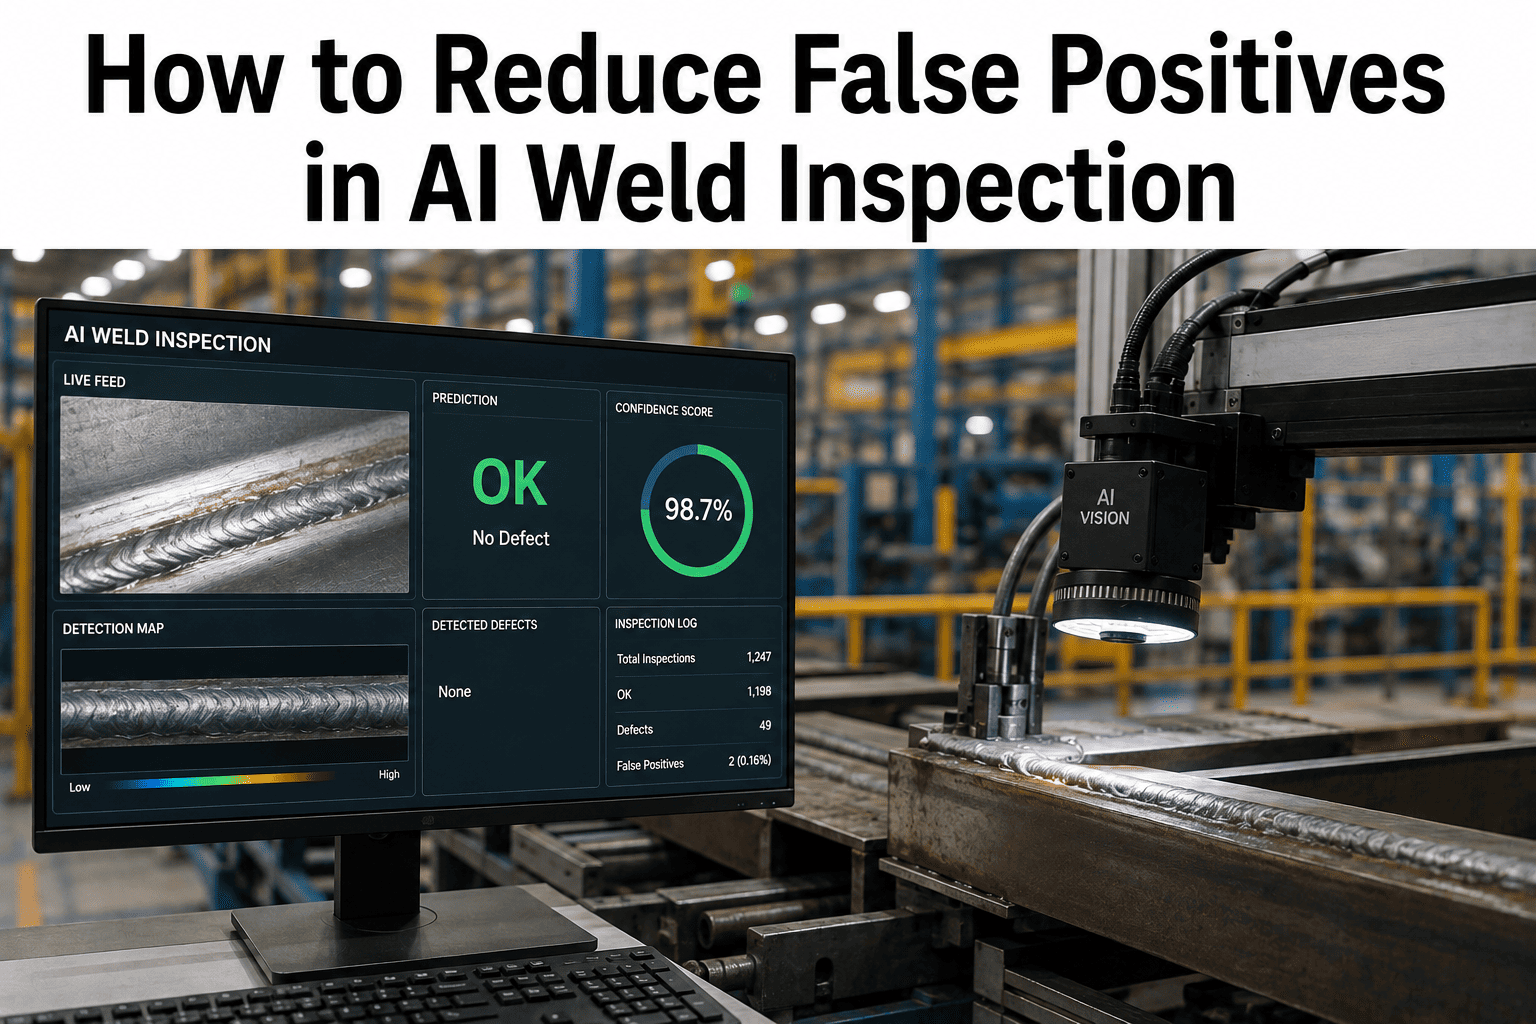
An AI weld inspection system does not fail the way people expect it to. It rarely misses a real defect outright in a dramatic way. It fails quietly, by crying wolf. A good weld gets flagged, then another, then a third, and within a few weeks the operators who were supposed to trust the system's alerts have started walking past them instead. This is documented as the single most common reason AI weld inspection deployments stall after go-live, and it has almost nothing to do with whether the underlying model can actually detect porosity or undercut. If your inspection system is generating alerts nobody responds to anymore, book a demo and we will walk through exactly how threshold tuning and confidence scoring fix it.
Every False Alarm Costs You More Than a Bad Weld Would Have
Threshold tuning, contextual classification, and confidence scoring bring false positive rates down to the level where operators trust every alert again, without opening the door back up to missed defects.
Alert Fatigue Is a Calibration Failure, Not an Operator Compliance Problem
It is tempting to read a rising rate of ignored alerts as an operator discipline issue and respond with a memo. That diagnosis is almost always wrong. Alert fatigue sets in predictably within weeks of go-live whenever the false-positive rate climbs past what a working person can reasonably act on, and the system keeps logging results and showing green on a management dashboard the entire time the human response chain underneath it has quietly broken.
The uncomfortable part of this failure mode is that it is invisible from the top. Uptime metrics look fine. The system is technically active. But quality engineers watching the escape rate at final inspection see the real story: a system operators have started routing around, either by dismissing alerts without review or by adjusting their own workflow to avoid triggering them, neither of which improves actual weld quality.
None of this shows up as a defect escape in a standard quality report, which is exactly why it survives so long inside an organization before anyone connects the dots between rising scrap, quiet operator disengagement, and a threshold that was never revisited after commissioning.
The Threshold That Was Correct on Day One Rarely Stays Correct
A false-positive rate is not a fixed property of a model, it is a property of the model matched against current production conditions, and production conditions move. Commissioning calibrates a threshold against the welds, consumables, and process settings present at that moment. Nothing about the physical process holds still afterward.
Consumable Aging
Wire diameter tolerance tightens and contact tips wear over their service life, gradually shifting the visual signature of an acceptable weld away from what the model was calibrated against.
Seasonal Shielding Gas Variation
Shielding gas flow characteristics can shift with ambient temperature across seasons, subtly changing weld bead appearance in ways a fixed threshold does not account for.
Silent Procedure Adjustments
Operators adjust welding parameters in the field to solve immediate problems, often without those changes being formally logged against the inspection system's baseline assumptions.
Lighting and Imaging Variance
A large share of inspection failures trace back to lighting inconsistency or imaging distance drift rather than an actual model weakness, which threshold tuning alone cannot fix without addressing the imaging setup.
This is the core argument for treating false-positive rate as a metric to monitor continuously rather than a box checked once at commissioning. A system that was accurate in month one and left untouched is, by month six, running against conditions it was never actually validated for.
Threshold Tuning, Contextual Classification, and Confidence Scoring, Working Together
Reducing false positives without quietly increasing missed defects requires more than turning one sensitivity dial down. It requires three distinct techniques operating together, each addressing a different part of the problem.
Threshold Tuning by Defect Class
Rather than one global sensitivity setting, separate thresholds are set per defect type based on severity. Critical defects like cracks receive conservative thresholds that minimize false rejection even at some cost to false-negative risk, while cosmetic variations get thresholds tuned for tolerance rather than alarm.
Contextual Classification
The model is trained to distinguish genuine defects from legitimate process variation — batch-to-batch material differences, texture variance, reflectance changes — rather than flagging any deviation from a narrow reference sample as a fault. Rule-based systems fail here specifically because a rule tuned to one defect feature often captures normal variation as well.
Confidence Scoring and Multi-Frame Confirmation
Only high-confidence detections trigger an immediate alert. Borderline calls require confirmation across multiple consecutive frames or route to an operator review queue instead of an automatic reject, filtering out the single-frame noise responsible for a large share of nuisance alerts.
Find Out Exactly Where Your Current System Is Drifting
Bring your inspection logs and a sample of recent false-positive flags. We will map where the drift is coming from — consumable wear, lighting variance, or a threshold that was never revisited — before recommending a single change.
You Cannot Talk About False Positives Without Talking About False Negatives
Every threshold adjustment moves along a tradeoff curve, and pretending otherwise is how systems get tuned into looking good on one metric while quietly getting worse on the one that actually protects the customer. Tightening a threshold to eliminate false alarms inevitably raises the risk of missing a genuine defect, and loosening it to catch every possible defect inevitably increases the noise operators have to filter through.
The empirical way to find the correct zone is to run the trained model against a labeled validation set, plot the false-accept and false-reject counts across multiple sensitivity levels, and record which specific defect types drive the errors at each point. That confusion-matrix exercise, not intuition, is what identifies the actual operating point for your specific parts and process rather than a generic default.
How Trust Gets Rebuilt Once It Has Already Been Lost
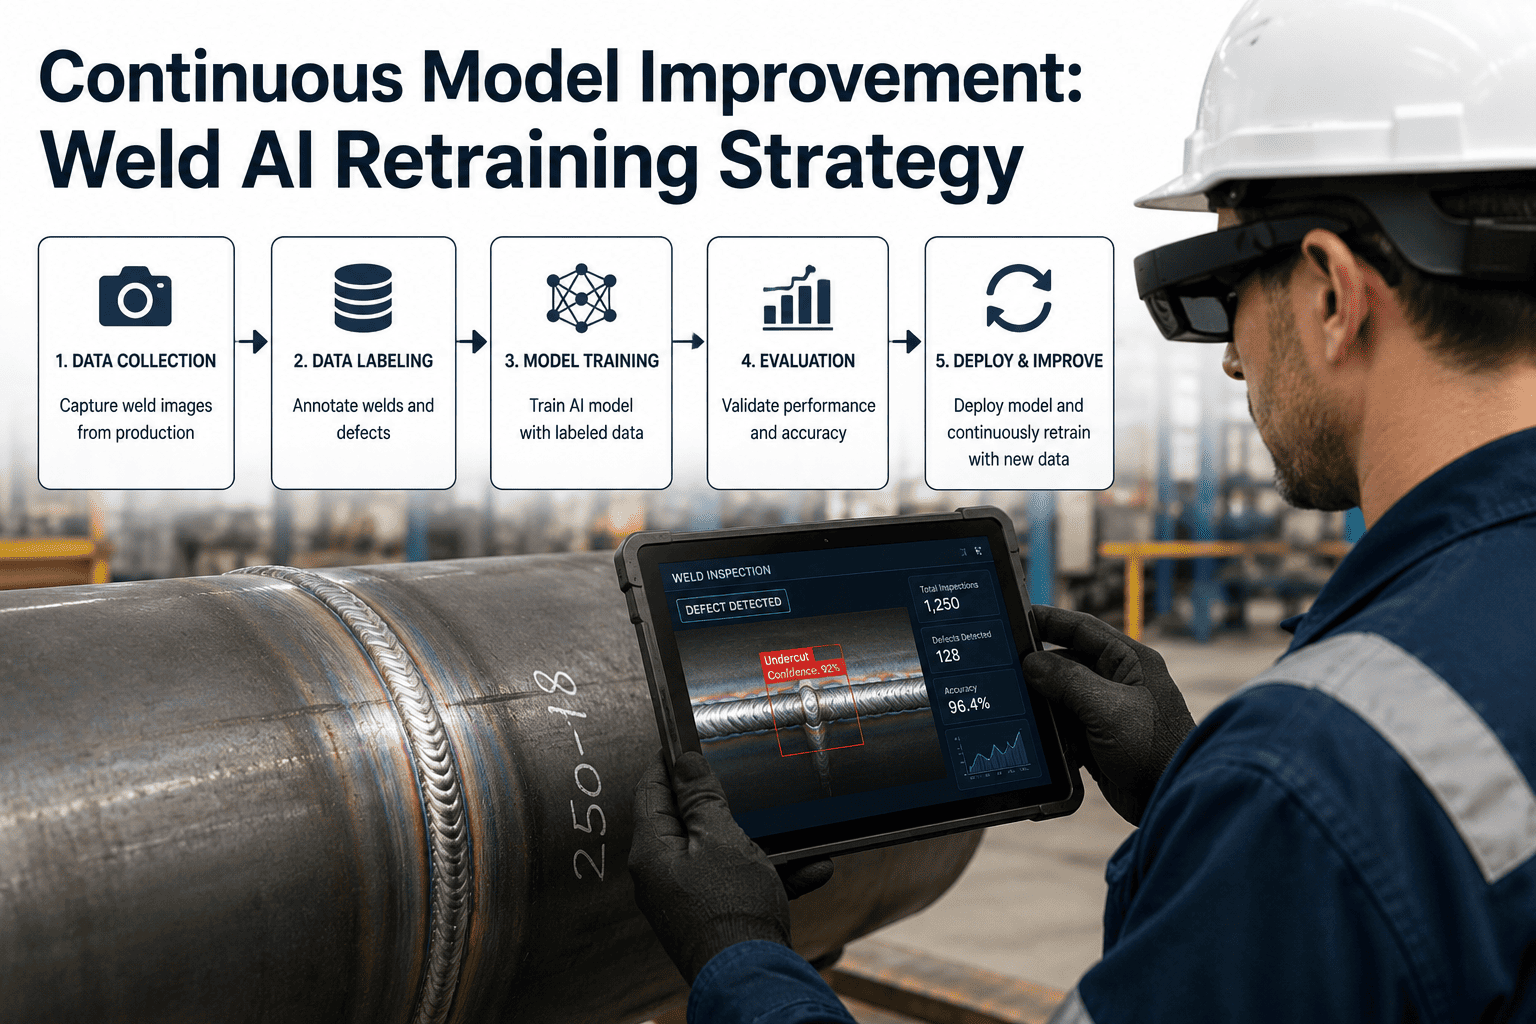
If operators have already learned to ignore your alerts, a firmware update alone will not fix that. Trust has to be rebuilt deliberately, and the staged approach that works for a first deployment works just as well for a recalibration after drift has set in.
Shadow Mode Comparison
Run the recalibrated system in parallel with inspector decisions on one high-risk joint, logging every call without triggering production alarms, so accuracy can be measured before anyone has to trust it again.
Per-Class Threshold Validation
Compare system calls against inspector verdicts defect class by defect class, adjusting each threshold independently until agreement reaches the level your best inspectors would sign off on.
Controlled Alarm Handoff
Once shadow-mode agreement is validated, the system takes over live alarms on that one joint, with operator response rate tracked explicitly as a KPI alongside the false-positive rate itself.
Scheduled Recalibration
A recurring monthly check against a fixed set of reference welds with known ground-truth verdicts catches drift before it reaches the point where operators start disengaging again.
The Difference Between a Dashboard and a System Operators Actually Trust
That last answer is the entire point. The fix was not simply a looser threshold that happened to also let real defects through. It was correctly teaching the model to recognize legitimate process variation as legitimate, which is what a threshold number alone can never fully accomplish.
What Fabrication Teams Ask Before Recalibrating an Underperforming System
Stop Losing Operator Trust to a Threshold Nobody Has Revisited
If your alerts are being ignored, the fix is rarely a new model, it is a proper diagnostic of where drift crept in and a staged recalibration operators can actually see working before they are asked to trust it again.