
Operational Excellence Framework & Assessment 2026

By Johnson on August 18, 2026

operational-excellence-framework-manufacturing-assessment

Ask five people in the same plant how mature its operations really are and you will usually get five different answers, because "operational excellence" tends to mean whatever the last improvement project happened to touch. One person points to a clean OEE dashboard as proof the plant has arrived. Another knows the same dashboard is fed by a spreadsheet someone updates by hand every Friday. Without a structured way to score maturity across every dimension that actually drives performance, plants end up managing perception instead of managing the gap. See how iFactory turns that guesswork into a measurable maturity score at ifactory support.

iFactory Operational Excellence Framework

Find Out Exactly Where Your Plant Stands, Dimension by Dimension

A structured maturity assessment across six operational dimensions, scored against five maturity levels, so you can stop guessing at "world-class" and start closing the specific gaps holding your plant back.

6
Scored dimensions
5
Maturity levels
90 Days
To a scored roadmap

Why Most Plants Can't Actually Score Their Own Maturity

Operational excellence became a buzzword precisely because it is hard to pin down. Plants that are genuinely disciplined about standard work, data integrity, and continuous improvement get lumped into the same conversation as plants that installed a few dashboards and called it digital transformation. The problem is not ambition, it is measurement. Most improvement programs are judged by whether a project got completed, not by whether the underlying capability the project was supposed to build actually stuck. A kaizen event that produces a poster on the wall and a maturity assessment that produces a repeatable, scored capability are not the same thing, and the gap between the two is where most operational excellence programs quietly stall after the first eighteen months.

62%
Of OpEx programs stall within two years
Initial momentum from a launch event fades once there is no scored baseline to measure progress against.
3-5x
Variance in maturity between departments in one plant
Quality can be running near world-class discipline while maintenance is still fully reactive, and nobody has ever compared the two on the same scale.
1 in 3
Improvement projects chosen without a gap score
Teams pick the most visible problem instead of the highest-leverage gap, because there was no scored assessment to rank against.
12-18 Mo
Average time before a program gets reset from scratch
Leadership changes, the scorecard resets, and the plant starts a new "excellence journey" without carrying forward what it already learned.

The Six Dimensions That Actually Determine Operational Excellence

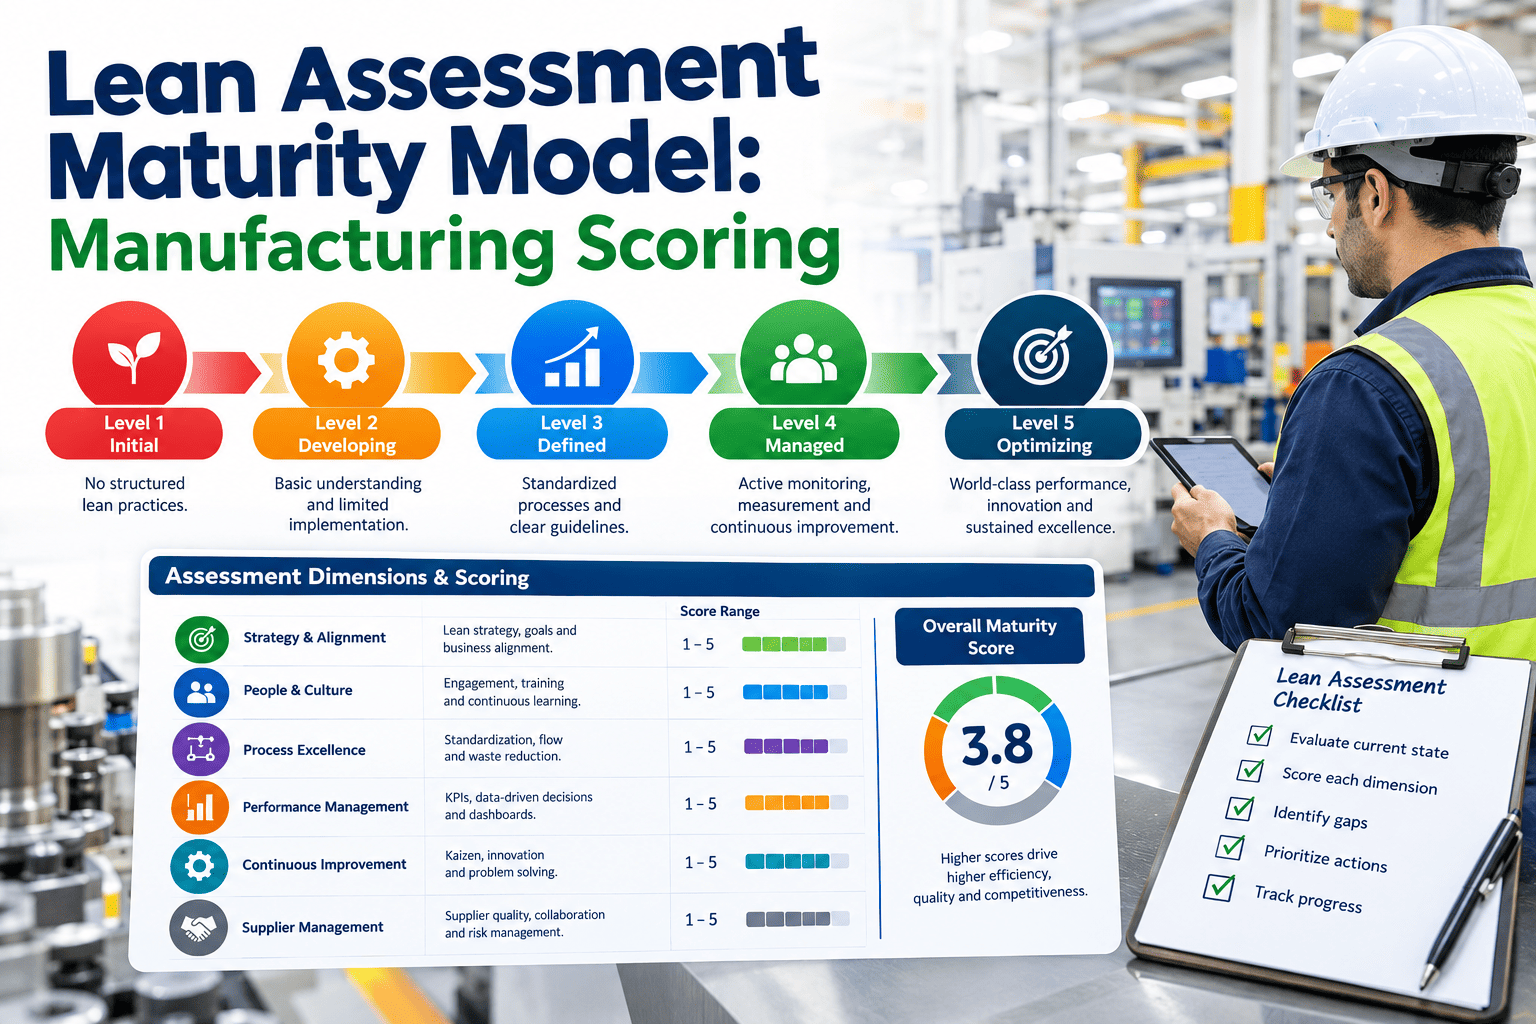
A maturity framework only holds up if it scores the things that actually predict performance rather than the things that are easiest to observe on a walk-through. The six dimensions below cover leadership alignment, how work actually gets done, whether the plant can trust its own data, how capable the workforce is of sustaining a gain, how disciplined the improvement process is, and whether results are tracked consistently enough to prove any of it worked. Every one of these gets its own score, because a plant can be strong in one and genuinely weak in another, and averaging them together is exactly what hides the gap that is actually costing the most.

Dimension 1
Leadership & Strategy Alignment
Whether plant-floor priorities actually trace back to a stated business strategy, or whether every department is optimizing its own local metric.
Dimension 2
Process Standardization
Whether standard work exists, is followed consistently across shifts, and gets updated when a better method is found, instead of living in a binder nobody opens.
Dimension 3
Data & Digital Infrastructure
Whether production, quality, and maintenance data are captured automatically and trusted, or reconstructed from memory at the end of a shift.
Dimension 4
Workforce Capability
Whether operators and technicians are cross-trained and equipped to sustain an improvement, or whether every gain depends on one specific person staying in that role.
Dimension 5
Continuous Improvement Discipline
Whether root-cause problem solving is a habit built into daily work, or an event that happens only when a consultant is in the building.
Dimension 6
Results & Accountability
Whether the plant can show a consistent trend line tied to a specific improvement, or whether results are reported as one-off wins with no baseline behind them.
The Five Maturity Levels, Visualized
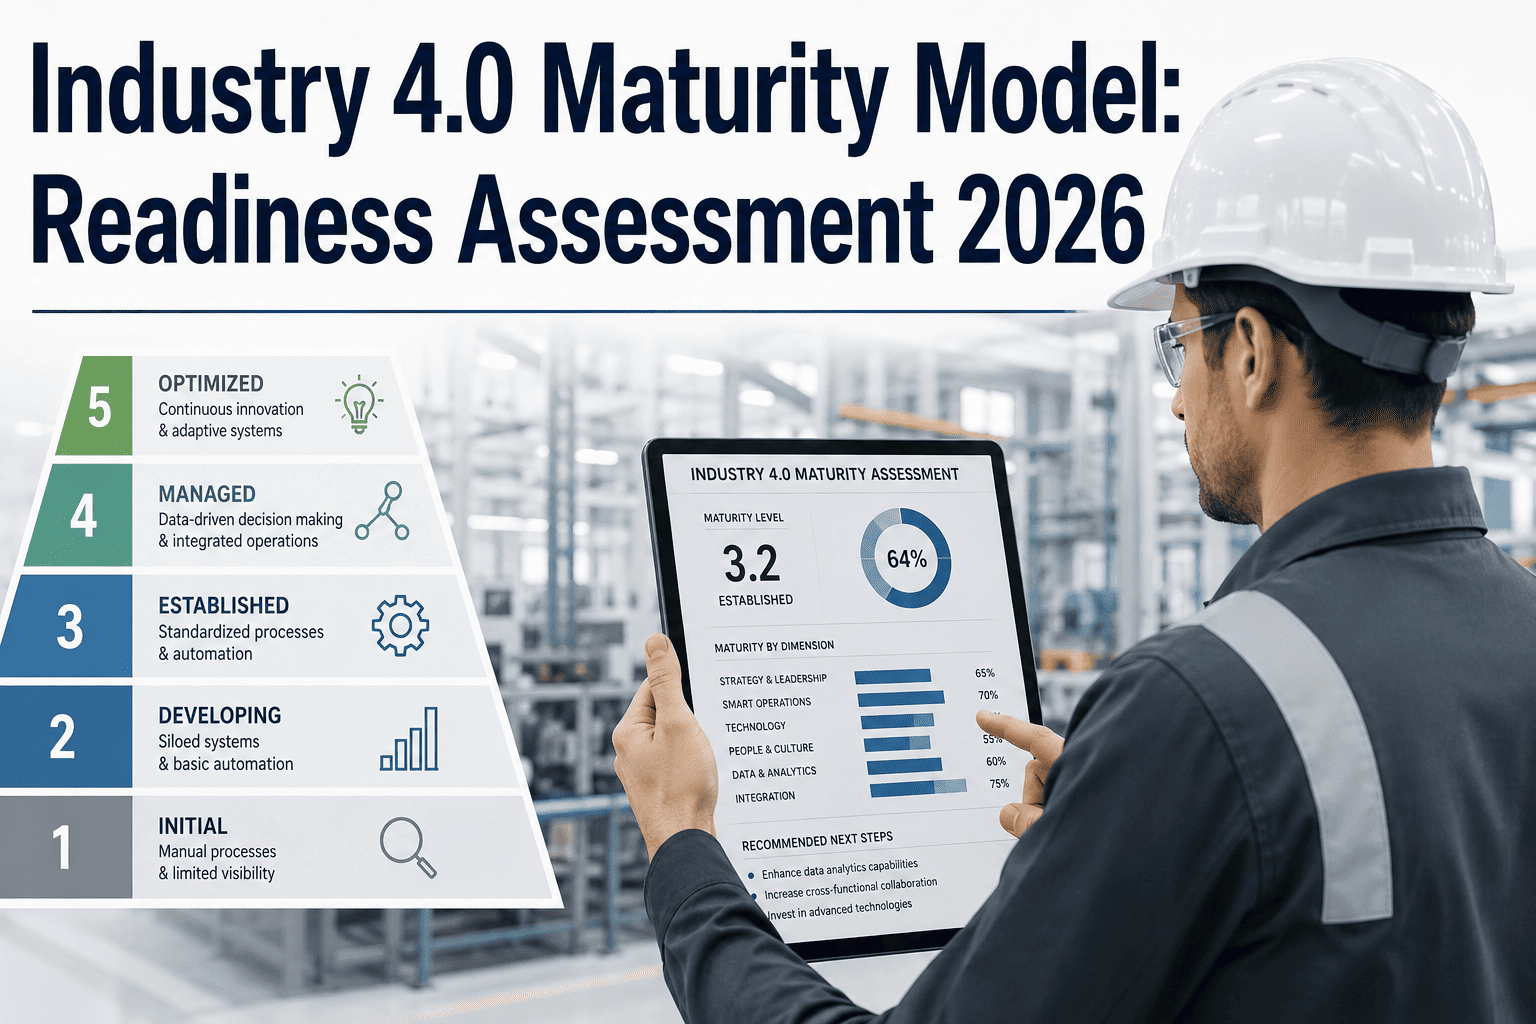
L1 AD HOC L2 EMERGING L3 DEFINED L4 MANAGED L5 OPTIMIZED Reactive Localized Standardized Data-Driven Self-Improving
Get Your Score

See Where Your Plant Actually Lands on This Scale

Bring your last twelve months of OEE, downtime, and quality data to the call. We will walk through the six dimensions live and show you where your plant is genuinely strong and where it is quietly stuck.

What Separates Each Maturity Level in Practice

A maturity level is only useful if it describes something a plant manager would actually recognize walking the floor, not an abstract score on a slide. The table below breaks down what each of the five levels typically looks like across process discipline, data trust, and how improvement actually gets initiated. Most plants are not uniformly at one level — a plant might run Level 4 process discipline in final assembly while maintenance is still solidly Level 2, and that gap is usually the highest-leverage place to focus the next improvement cycle.

Maturity Level Characteristics Across the Plant
Level Process Discipline Data & Visibility How Improvement Happens
Level 1 — Ad Hoc No documented standard work; each operator runs the job their own way Manual, end-of-shift entries; numbers are often reconstructed from memory Purely reactive, triggered only after a visible failure
Level 2 — Emerging Standard work exists for some stations but is inconsistently followed Some digital tracking, but siloed by department and rarely cross-referenced Occasional kaizen events with no follow-up cadence
Level 3 — Defined Standard work documented and audited across most of the plant Centralized reporting exists, though still reviewed mostly after the fact Structured root-cause process used for major issues
Level 4 — Managed Standard work enforced consistently with real-time deviation alerts Live dashboards trusted by leadership and the floor alike Continuous improvement is a scheduled, recurring cadence
Level 5 — Optimized Standard work is self-updating as better methods are proven out Predictive analytics inform decisions before a problem shows up Improvement is embedded in daily work at every level, not a separate program

How the Assessment Itself Actually Runs

An assessment that takes three months and produces a two-hundred-page report rarely gets acted on, because by the time it is finished the plant has already moved on to whatever fire is burning that week. The process below is built to produce a scored, actionable baseline fast enough that the plant can start closing gaps within the same quarter it was assessed, rather than treating the assessment itself as the deliverable.

From First Walk-Through to a Scored Roadmap
1
Baseline Walk & Data Pull
A structured floor walk across every shift combined with a pull of existing OEE, downtime, and quality data to see what the plant already knows about itself.
2
Score Each of the Six Dimensions
Every dimension is scored independently against the five-level scale, using specific, observable evidence rather than a self-reported survey answer.
3
Map the Gap Between Departments
Scores are compared across departments and shifts to surface where maturity is inconsistent, which is usually where the biggest quick wins are hiding.
4
Rank Improvement Opportunities
Gaps are ranked by a combination of expected impact and effort to close, so the roadmap starts with the highest-leverage moves rather than the loudest complaint.
5
Set a Re-Score Cadence
A follow-up scoring date is set from day one, so the plant is measuring progress against its own baseline instead of restarting the conversation from zero next year.

Want to see how your own OEE and downtime data would score against the six dimensions? Send us a sample data set and we will walk through a preliminary scoring with you.

What Closing the Gap Actually Delivers

The value of a maturity assessment is not the score itself, it is what the plant does with the gap once it is visible. The ranges below reflect what mid-size manufacturers have reported after using a scored baseline to prioritize their improvement roadmap for a full year, rather than picking projects based on whichever department made the most noise at the last leadership meeting.

20-35%
Faster time to close a known capability gap
Teams work from a ranked list instead of debating which problem to tackle first at every meeting.
2-3 Levels
Typical maturity gain in a lagging dimension within 12 months
Once a specific dimension is scored and visible, it stops being an abstract weakness and becomes a tracked target.
40%+
Reduction in duplicate or conflicting improvement projects
A shared scorecard stops different departments from independently launching the same fix.
Quarterly
Re-scoring cadence most plants settle into
Frequent enough to catch drift, light enough that it does not become its own burden on the floor.

Turning the Score Into a 90-Day Improvement Plan

A maturity score that sits in a slide deck changes nothing. The plants that actually move up the scale treat the assessment as the start of a working plan with a fixed horizon, not an annual audit exercise. The four phases below are how a scored baseline typically turns into a plan the floor can actually execute against within a single quarter.

Phase 1
Baseline & Score
Complete the six-dimension assessment and publish the scored baseline to plant leadership and shift supervisors alike, not just the executive team.
Phase 2
Pick Two Dimensions
Rather than attacking all six at once, focus the first ninety days on the two lowest-scoring, highest-impact dimensions to build early, visible momentum.
Phase 3
Assign Owners & Targets
Each targeted dimension gets a named owner and a specific level target, not a vague direction to "improve," so progress can actually be checked at the next review.
Phase 4
Re-Score & Expand
At the ninety-day mark, re-score the targeted dimensions, confirm the gain held under normal operating conditions, and expand focus to the next pair.

Common Mistakes That Skew a Maturity Score

A poorly run assessment is worse than no assessment at all, because it produces a false sense of confidence that leadership will act on for the next twelve months. The most common mistake is scoring maturity based on what a policy document says rather than what actually happens on the floor at two in the morning on the night shift, when the supervisor who wrote that policy is not around to enforce it. A close second is letting a single enthusiastic department pull the overall average up, which hides exactly the imbalance the assessment was supposed to surface in the first place. Averaging across dimensions instead of reporting each one independently is the fastest way to turn a genuinely useful diagnostic tool into a vanity number that nobody can actually act on.

The other recurring mistake is treating the assessment as a one-time event rather than a recurring discipline. A score taken once and never revisited tells a plant where it stood on a single day, which is only marginally more useful than not knowing at all, because operational maturity drifts constantly in both directions. A dimension that scored well last year can quietly slip if the person who built the discipline moves to a different role and nobody trained a successor. Building the re-score cadence into the plan from day one, rather than treating it as an optional follow-up, is what actually separates plants that sustain their gains from plants that celebrate a good assessment result and then watch it erode over the following months.

Frequently Asked Questions

How is this different from an OEE dashboard or a standard KPI scorecard?
An OEE dashboard measures output — availability, performance, and quality on a given line — but it does not tell you whether the capability behind that number is sustainable or lucky. The maturity framework scores the underlying process, data, and workforce discipline that actually produce a consistent OEE trend, which is why two plants can report the same OEE number while sitting at completely different maturity levels. One is likely to hold that number under pressure, and the other is one bad week away from losing it. Talk to our team about how the two measurements work together rather than replacing each other.
Do all six dimensions need to be assessed at once, or can we start with one or two?
Most plants get more value starting with a full baseline across all six dimensions, even at a lighter level of detail, because the real insight usually comes from comparing scores against each other rather than looking at any single dimension in isolation. That said, a focused assessment on one or two dimensions is a reasonable starting point if a specific department is already flagged as a known problem area. Book a scoping call to figure out which approach fits your current situation.
Who on our team needs to be involved in the assessment for it to be accurate?
An accurate score depends on input from more than just plant leadership, since leadership's view of process discipline is often more optimistic than what shift supervisors and operators actually experience day to day. A representative assessment typically includes the plant manager, a maintenance lead, a quality lead, and at least two shift-level supervisors or senior operators, so the score reflects the floor as it actually runs, not just how it is described in a leadership meeting. Reach out to our team for a suggested stakeholder list based on your plant's structure.
How often should the assessment be repeated once we have a baseline?
Most plants settle into a quarterly light re-score focused on whichever dimensions are actively being targeted, paired with a full six-dimension reassessment once a year to catch any drift in areas that were not the current focus. Reassessing too infrequently risks losing sight of a gain that quietly eroded once attention moved elsewhere, while reassessing too often turns the process into its own burden on the floor. Book a walkthrough to set a cadence that fits your team's capacity.
Can a smaller plant with limited staff realistically use a six-dimension framework?
Yes, and in practice smaller plants often move through the levels faster once a gap is visible, simply because there are fewer layers of approval standing between identifying a problem and fixing it. The framework scales down by scope rather than by rigor — a smaller plant assesses the same six dimensions but with a lighter data pull and a shorter list of stakeholders involved in scoring. Contact our team to talk through what a right-sized version of the assessment looks like for your plant.
Know Where You Stand.

Get a Scored Baseline Across All Six Dimensions

Bring your OEE, downtime, and quality history to the call. We will walk through where your plant scores today, where the biggest gap is hiding, and what a ninety-day plan to close it would actually look like.
6
Dimensions scored
5
Maturity levels
90 Days
To a working plan
Quarterly
Recommended re-score

Share This Story, Choose Your Platform!