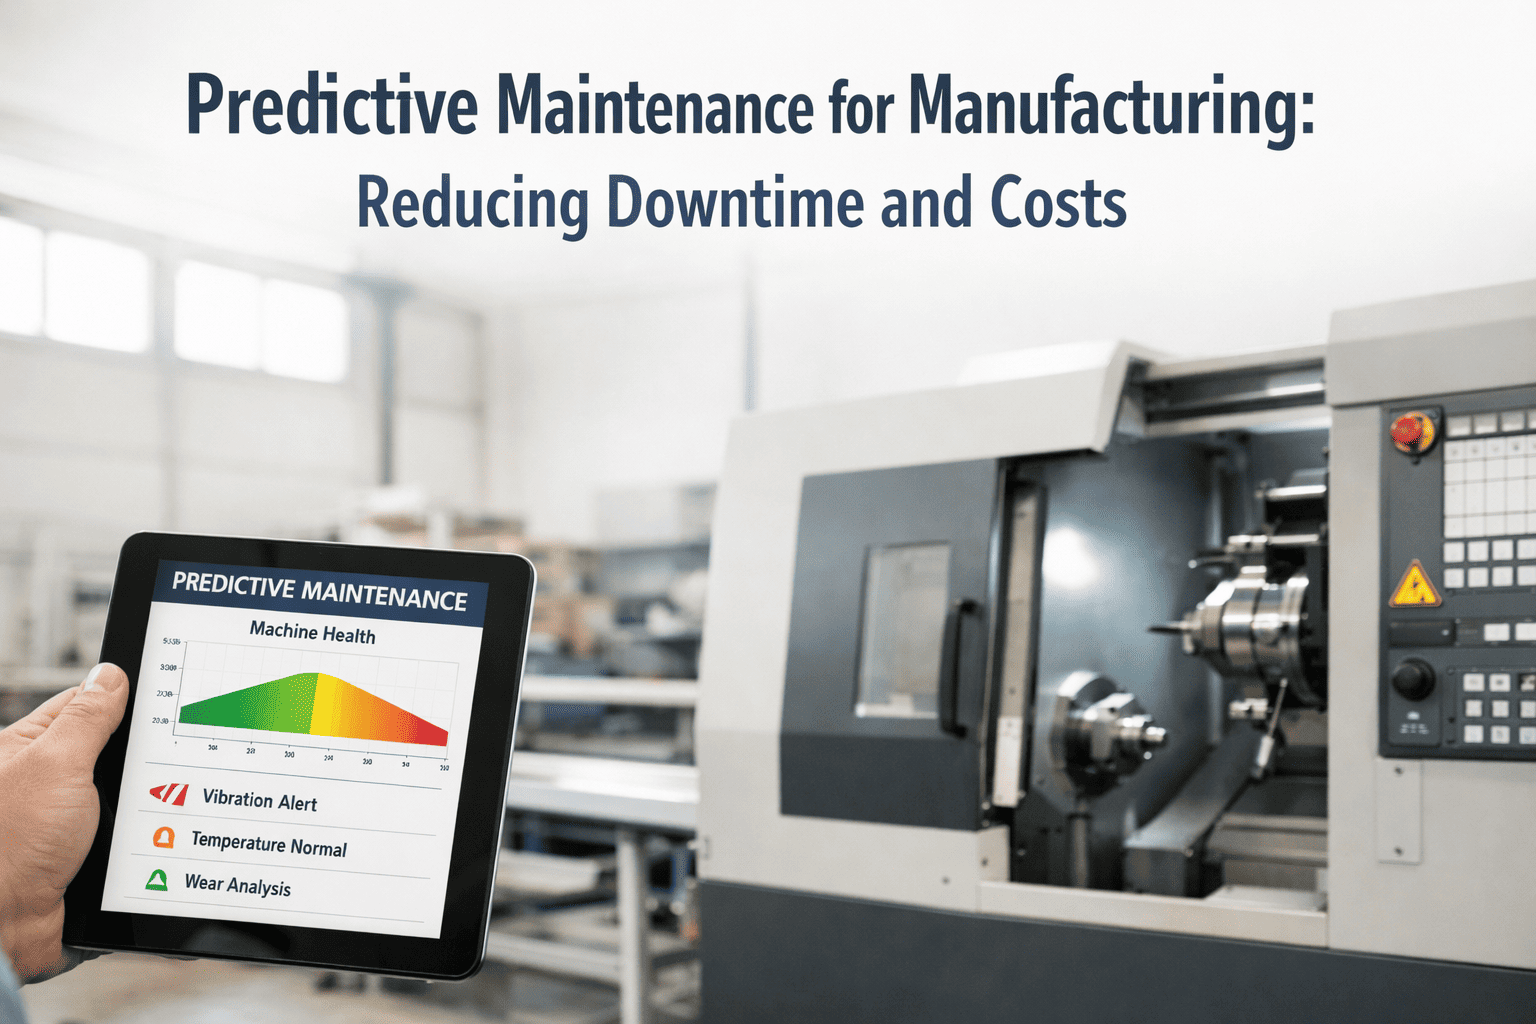
Every predictive maintenance business case eventually comes down to one number leadership actually cares about: the return on investment, measured in dollars and months, not sensor counts or model accuracy scores. Reliability teams that walk into budget meetings with vibration charts and prediction-accuracy percentages tend to lose the argument to teams that walk in with recovered downtime hours and a payback date. This guide breaks predictive maintenance ROI into its real components, walks through documented savings benchmarks by asset class, and lays out the exact calculation reliability leaders use to defend the investment to finance. Most of the return hides in places a first-pass business case forgets to credit — deferred capital spend, lower energy draw, smaller emergency parts premiums — until someone puts a number next to them. A short demo can show what a connected monitoring platform tracks toward that number automatically.
Digital Transformation ROI
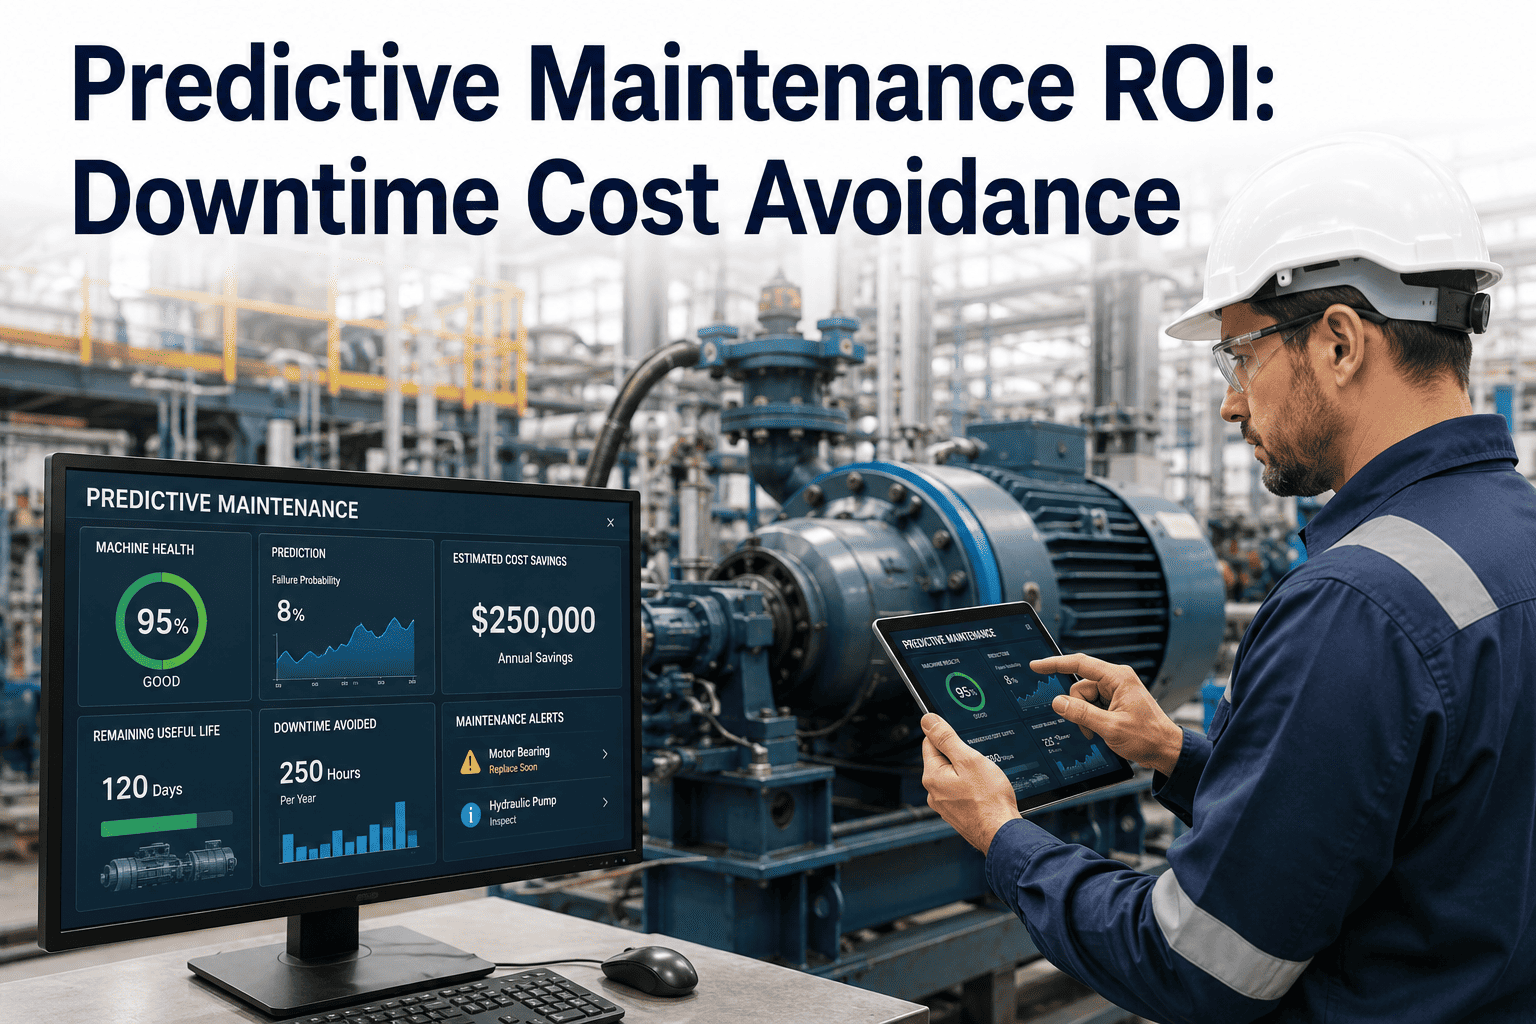
Predictive Maintenance ROI: What Downtime Cost Avoidance Is Actually Worth
Documented savings ranges, payback timelines, and the four sources that make up a defensible predictive maintenance business case.
The Real Cost of Unplanned Downtime
Before any predictive maintenance business case can be built, the baseline number has to be right, and most plants underestimate it. Unplanned downtime doesn't just cost lost production — it drags in scrap and rework, wasted energy during restarts, overtime to recover the schedule, expedited freight on emergency parts, and sometimes delivery penalties that never show up in a maintenance department's own budget line. Reliability teams that only count a production line's hourly output rate are frequently working with a figure well below what finance would actually book as the loss once every downstream cost is added in. The average manufacturing facility now loses roughly $260,000 for every hour of unplanned downtime, a figure that has climbed about 50% since 2019 as supply chains grew more fragile and production schedules grew tighter. That number varies enormously by industry and asset criticality — a packaging line and an offshore compressor train do not carry the same exposure — but the direction is the same almost everywhere: downtime is getting more expensive every year, which means the return on preventing it is growing right alongside it. Facilities that have not recalculated their downtime cost figure in the last two years are almost certainly underselling the case for predictive maintenance to their own leadership.
$260K
average cost of one hour of unplanned downtime at a typical manufacturing facility
50%
higher than the equivalent downtime cost figure in 2019
10:1–30:1
documented ROI ratio for mature predictive maintenance programs within 12–18 months
The Four Sources Where PdM Savings Actually Come From
A predictive maintenance business case that only counts avoided downtime is leaving real money off the table, and a business case that only counts maintenance labor savings is making the same mistake in the other direction. The strongest, most defensible ROI cases quantify all four sources separately, because each one is independently verifiable against a different line in the plant's existing financials — production reports, the CMMS work order history, the capital asset register, and the utility bill. Presenting all four together also tends to change the conversation with leadership: instead of one large, slightly abstract downtime number that invites skepticism, the case becomes four smaller, individually traceable numbers that are much harder to argue with.
Source 1
Downtime Cost Avoidance
The largest and most direct line item in almost every documented case. Plants moving from reactive to predictive strategies report a 30–50% reduction in unplanned downtime within the first year, and because downtime cost per hour is usually already known, this is the easiest number to defend in front of finance. It's also the number that compounds fastest, since every additional monitored asset adds its own downtime exposure to the total.
Source 2
Maintenance Cost Reduction
Total maintenance spend typically drops 18–25% within 18 months as work shifts from emergency callouts to scheduled interventions. A proactive repair generally costs four to five times less than the identical repair performed as an unplanned emergency, which is the single ratio that most business cases understate. Labor also gets used more efficiently, since technicians spend less time on unplanned callouts and more on planned work that can be batched together.
Source 3
Asset Life Extension
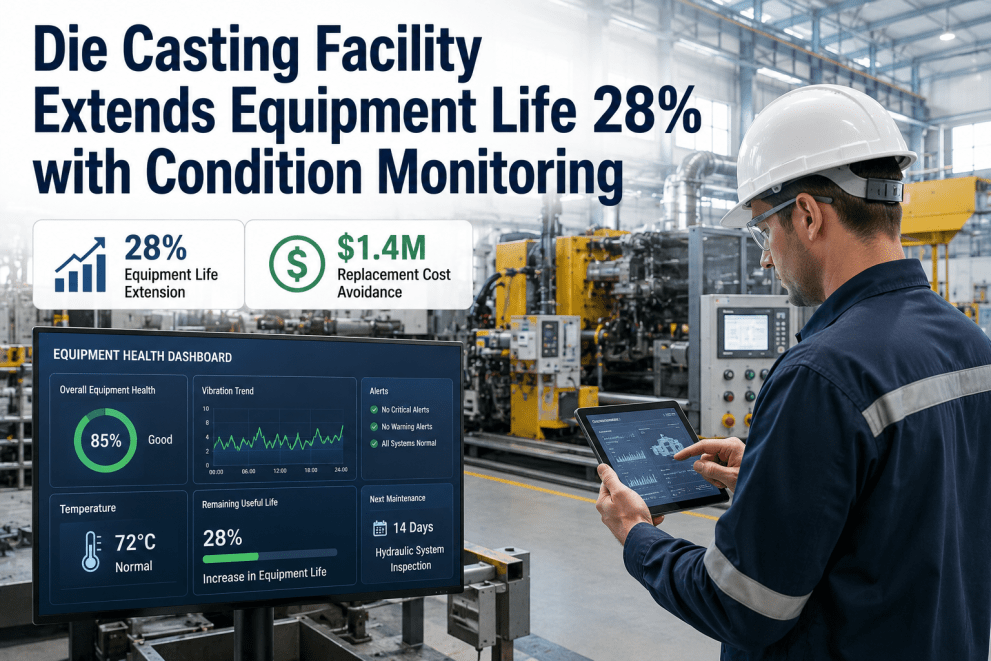
Monitored rotating equipment routinely shows a 20–40% extension in useful life, which defers rather than eliminates capital spend. It doesn't show up as cash in year one, but it's real: a large compressor lasting a quarter longer can defer hundreds of thousands of dollars in replacement capital for years, freeing that budget for other priorities in the meantime.
Source 4
Energy and Parts Optimization
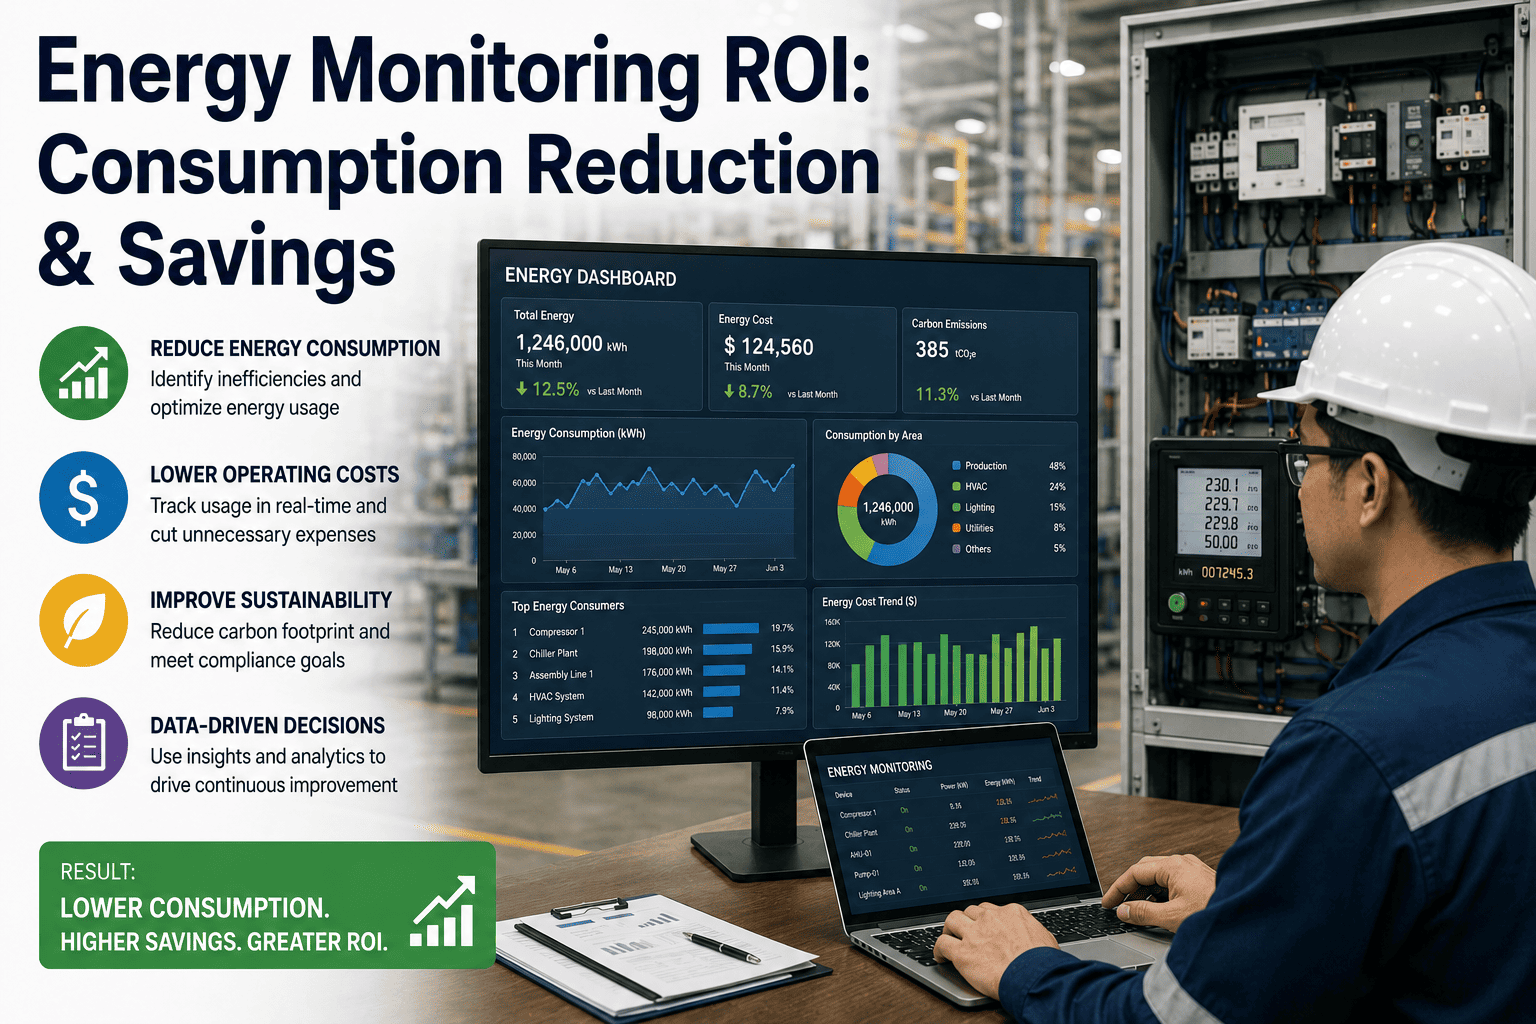
Degrading equipment consumes more power long before it fails outright — a misaligned pump can draw 10–15% more power, and a fouled heat exchanger can force a compressor to work 8–12% harder. Correcting these issues early typically recovers 5–10% energy on monitored assets, alongside smaller emergency-procurement premiums and less rush-order inventory sitting idle on the shelf.
See The Math For Your Plant
Turn These Benchmarks Into Your Own Numbers
A demo walks through how iFactory tracks downtime avoidance, maintenance spend, and energy savings against your actual asset data.
ROI Benchmarks by Asset Class
Not every asset returns the same ROI from predictive monitoring, and pretending otherwise is one of the fastest ways to lose credibility with a finance team that has seen the numbers before. Rotating equipment with predictable, well-documented failure modes — motors, pumps, compressors, fans, bearings — consistently delivers the fastest and highest returns because degradation follows a measurable curve that models can learn from a matter of weeks of baseline data. Fixed and hybrid systems like HVAC and chillers still return strongly, but the payback window tends to run longer because the failure signatures are less uniform across units. The table below reflects documented ranges pulled from manufacturing, process, and facilities deployments rather than a single vendor's projection, so it's a reasonable starting point for a first-pass estimate before a plant's own baseline data is available.
| Asset Class | Primary Failure Risk | Documented Savings Range | Typical Payback Window |
| Rotating equipment (motors, pumps, fans, gearboxes) |
Bearing wear, misalignment, imbalance |
30–50% downtime reduction, 20–40% life extension |
3–6 months for high-criticality assets |
| Critical compressors and turbines |
Catastrophic shutdown, seal and blade degradation |
35–50% downtime reduction, up to 41% maintenance cost cut in documented cases |
Often the fastest payback due to high dollar-per-hour exposure |
| HVAC, chillers, and building mechanical systems |
Efficiency loss, compressor and coil failure |
10–20% energy reduction, up to 62% cut in unplanned capital spend |
8–18 months |
| Plant-wide mixed asset rollout |
Aggregate across all monitored equipment |
18–25% maintenance cost reduction, 10:1–30:1 overall ROI |
12–18 months typical, sometimes 3–6 in high-downtime-cost sectors |
Why Industry Context Changes The Math
The same predictive maintenance program can post very different ROI figures depending on what industry it's deployed in, and none of the discrepancy is about the technology working better in one sector than another. It's almost entirely about what a single hour of downtime costs and how forgiving the failure mode is. An offshore oil and gas platform facing a compressor shutdown can lose several hundred thousand dollars a day in lost production plus separate platform operating costs, which is why a single documented case in that sector reported a 41% maintenance cost reduction, $6.8 million in total annual savings, and a seven-month payback period. A discrete manufacturing plant running mixed production lines rarely carries downtime costs anywhere close to that per hour, so the same percentage improvement produces a smaller absolute number and a longer payback window, even though the underlying reliability gain is comparable.
This is exactly why benchmark ranges should be treated as a starting point, not a promise. A cement kiln, a semiconductor fab, and a food packaging line all have different tolerances for unplanned stops, different criticality profiles across their asset base, and different regulatory or quality consequences when something fails. The right way to use industry benchmarks is to identify which comparable facility type is closest to your own operation, then adjust the range up or down based on your actual downtime-cost-per-hour figure rather than assuming a generic manufacturing average applies directly. A plant that has never formally documented its own downtime-cost-per-hour figure should treat that calculation, not the sensor rollout, as the actual first step of the project.
The Payback Timeline: What Actually Happens Month by Month
One of the most common questions from finance is also the hardest to answer with a single number: when does this actually pay for itself? The honest answer is that it happens in stages, not all at once, and knowing what to expect at each stage keeps a program from being judged too early or abandoned right before the payoff. Programs that get cancelled after six months are almost always cancelled during the quiet middle stretch, right before the model has enough history to start earning its keep — which is exactly why setting expectations at each milestone matters as much as the final payback number.
Month 0–2
Baseline data collection. Sensors go on the 10–20 highest-risk, highest-downtime-cost assets first, not the whole plant, so the pilot stays low-cost while establishing a defensible "before" number for downtime and maintenance spend. This is also when the team agrees on what success will look like numerically, so there's no dispute later about whether the program delivered.
Month 2–4
Early detections. Threshold-based alerts start catching obvious drift — bearing wear, motor overheating, conveyor misalignment — well before the machine learning models have enough history to reach full accuracy.
Month 4–8
First avoided failure. In documented case data, this single event typically recovers most or all of the pilot's hardware investment on its own, well before the maintenance cost and energy savings are even added in. It's also usually the moment skeptical stakeholders on the maintenance floor stop treating the alerts as noise.
Month 8–12
Model maturity. Roughly six to nine months of baseline sensor history lets prediction accuracy stabilize and false alarm rates fall, which is usually when maintenance teams start trusting alerts enough to act on them without a manual double-check.
Month 12–18
Full payback and scale decision. Most programs cross break-even in this window, with facilities in high-downtime-cost sectors sometimes reaching it in as little as three to six months because a single prevented major failure covers most of the program cost.
Calculating Your Own Predictive Maintenance ROI
The formula itself is simple; the discipline is in what gets credited as a saving and what doesn't. Conservative, defensible ROI cases use the documented average cost of past failures on a given asset class — not the single worst-case event — to estimate what a prevented failure was actually worth, which keeps the number credible in front of finance rather than optimistic. The worked example below uses figures typical of a mid-sized production facility with a single monitored line, which is a common starting scope before a program expands plant-wide.
ROI = (Annual Savings − Implementation Cost) ÷ Implementation Cost × 100
Downtime reduction
30% of $450,000 annual downtime exposure = $135,000 recovered
Maintenance cost reduction
18% of $300,000 annual repair spend = $54,000 recovered
Emergency procurement reduction
Approximately $12,000 in avoided expedite premiums
Year 1 net benefit
$201,000 total savings against $120,000 implementation cost ≈ $81,000 net
Build Your Business Case
Run This Math Against Your Actual Assets
iFactory pulls real downtime hours, maintenance spend, and asset data into a facility-specific ROI estimate.
Where Predictive Maintenance ROI Cases Fall Apart
Most predictive maintenance programs that lose executive support don't fail because the technology didn't work — they fail because the ROI case was built on numbers that couldn't survive scrutiny. These are the mistakes that show up most often in post-mortems of stalled programs, and every one of them is avoidable with a little more discipline in how the business case is put together in the first place.
Crediting worst-case avoided cost
Using the single most expensive historical failure to value every prevented event inflates the number and is the fastest way to lose a finance team's trust once they check the math against actual records. A repeated pattern of optimistic estimates, even well-intentioned ones, tends to make every future request from the same team harder to get approved.
Skipping the baseline period
Without two to four weeks of measured downtime and cost data before rollout, there's no defensible "before" number, and the reported "after" improvement can be dismissed as unverifiable. This is the single most common gap auditors and finance reviewers point to when a predictive maintenance case gets challenged.
Treating sensors as the whole solution
Sensors generate data, not decisions. Without integration into a work order system, teams end up manually correlating alerts across multiple screens, which quietly erodes the labor savings the case was built on and leaves valuable alerts unreviewed during busy shifts.
Rolling out plant-wide before piloting
Skipping the 10–20 asset pilot phase raises upfront cost and risk without first proving the model on the assets that actually matter most to downtime. A focused pilot also gives the team real experience triaging alerts before the volume scales up.
Leaving out energy and parts savings
Cases that only tally downtime and repair costs routinely undercount the real return by ignoring the energy and inventory effects that come along with catching degradation early, sometimes by a wide enough margin to change whether a project clears its hurdle rate.
Frequently Asked Questions
How long does it take to see positive ROI from predictive maintenance?
Most programs reach full payback within 8 to 18 months, though facilities in high-downtime-cost sectors sometimes break even in as little as 3 to 6 months because a single prevented major failure can cover most of the program cost on its own. The first avoided failure, which often happens within the first four to eight months, frequently recovers the pilot's entire hardware investment by itself, well before maintenance cost and energy savings are even added into the total. Programs that scope their pilot to the highest-risk assets tend to see this milestone earlier than programs that spread sensors thinly across lower-priority equipment.
A demo can walk through a payback estimate for your specific asset mix.
Which assets should a plant start with for the fastest payback?
Rotating equipment with well-documented, predictable failure modes — motors, pumps, compressors, fans, and gearboxes — consistently delivers the fastest returns because degradation follows a measurable curve models can learn from a matter of weeks of data. A focused pilot on the 10 to 20 highest-criticality assets keeps upfront cost low while producing the strongest proof point for a wider rollout. Assets that combine high downtime cost with a strong, well-understood failure signature — like a critical compressor with a documented vibration or bearing-wear history — usually make the single best starting point of all.
What's a realistic downtime cost reduction figure to use in a business case?
A 30–50% reduction in unplanned downtime is the range most consistently documented across manufacturing, energy, and process industries, and it's conservative enough to hold up under finance scrutiny. Applying the low end of that range to a known downtime-cost-per-hour figure, rather than the high end, keeps the projection credible rather than optimistic. As real baseline data accumulates from a plant's own pilot, that generic range should be replaced with the facility's own measured improvement, which is usually a more persuasive number in later budget conversations anyway.
Does predictive maintenance replace preventive maintenance entirely?
No. Predictive maintenance works alongside a preventive program rather than replacing it, redirecting maintenance effort toward the specific assets that are actually drifting toward failure while routine preventive tasks continue on their normal schedule. Facilities that skip straight from purely reactive maintenance to a fully predictive program without a solid CMMS foundation and clean historical data tend to struggle, since the models need that history to learn from.
Support can help map which assets in your current PM schedule are the strongest predictive candidates.
How is the "avoided cost" of a prevented failure actually calculated?
The defensible method uses the documented average cost of past failures on that same asset class, not the single worst historical event. If bearing replacements on a given motor class averaged $34,000 across three prior failures, a prevented failure is credited at $34,000, not at the cost of the worst individual incident. Every predictive intervention should also be tied to a specific work order noting what alert triggered it and what failure it prevented, since a running log of individually justified numbers holds up far better under review than a single aggregate claim. Organizations that track ROI this conservatively often find actual prevented costs run 15–25% higher than their estimate once compared against failures on non-monitored comparable assets.
None of this makes predictive maintenance a guaranteed win on paper — it makes it a quantifiable one, which is the more useful property in front of a capital committee. The plants that get the most out of this approach treat the ROI case as a living document, updating downtime cost figures, savings percentages, and payback timelines as real baseline data replaces industry benchmarks, rather than filing the original business case away once the budget is approved. A conservative, four-source, asset-specific case built the way this guide describes tends to survive scrutiny long after the optimistic version of the same case has already been forgotten, and it's the version of the business case that tends to get a program approved for a second phase rather than quietly shelved.
Ready When You Are
Get A Facility-Specific ROI Estimate
Book a session and see the downtime, maintenance, and energy savings math applied to your own plant data.