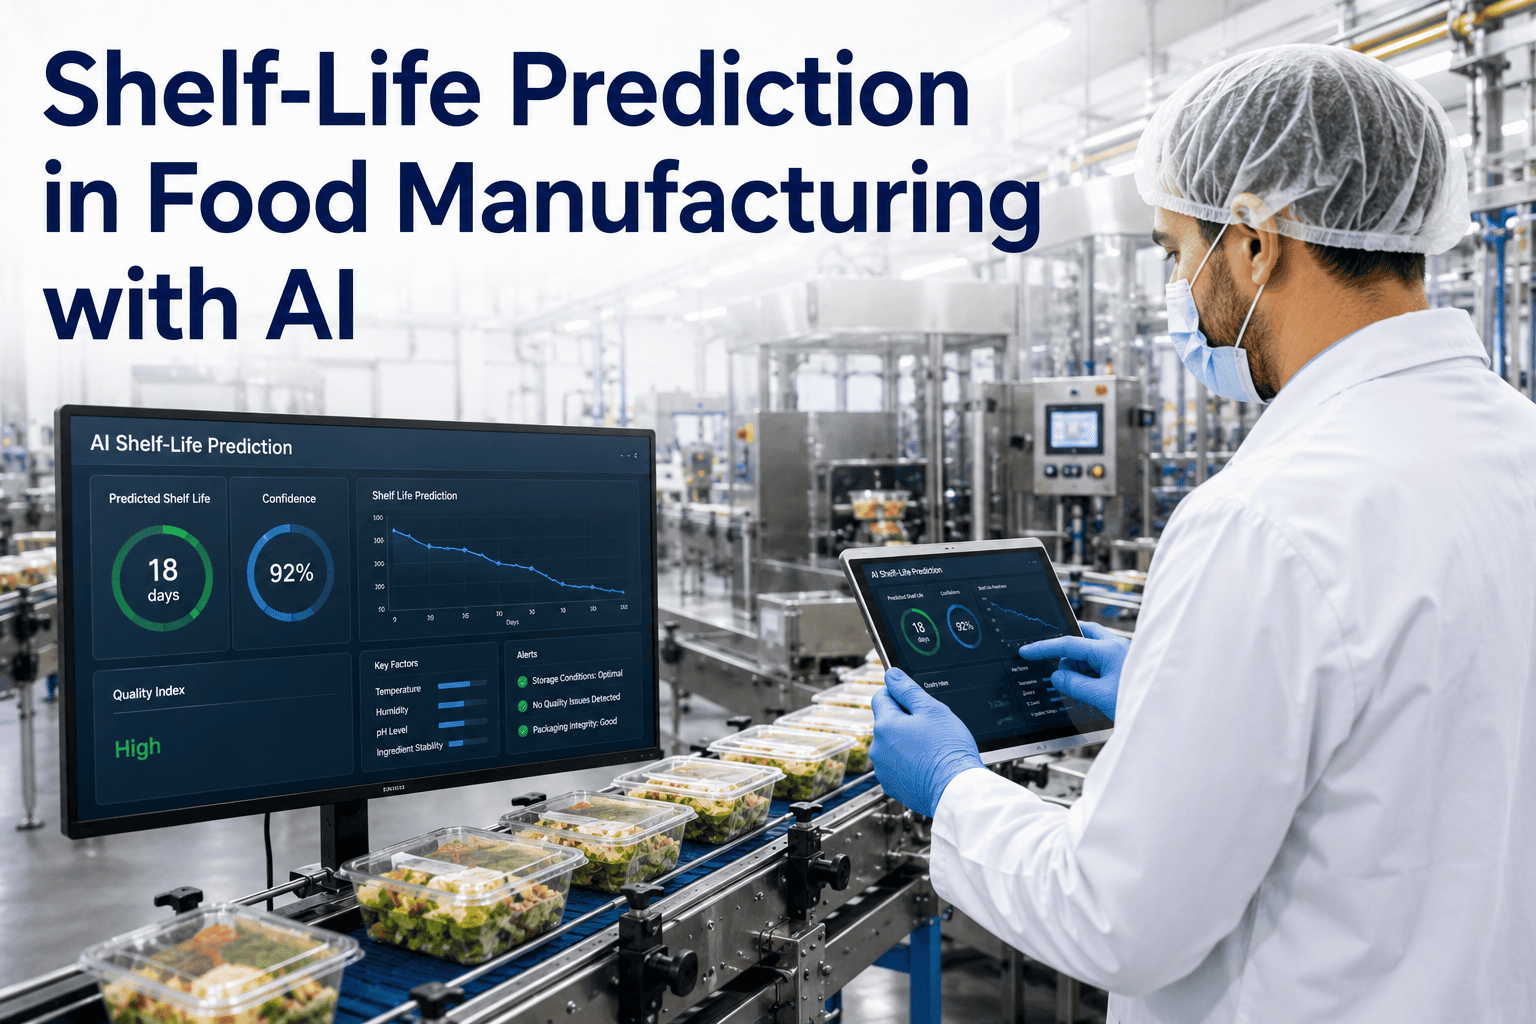
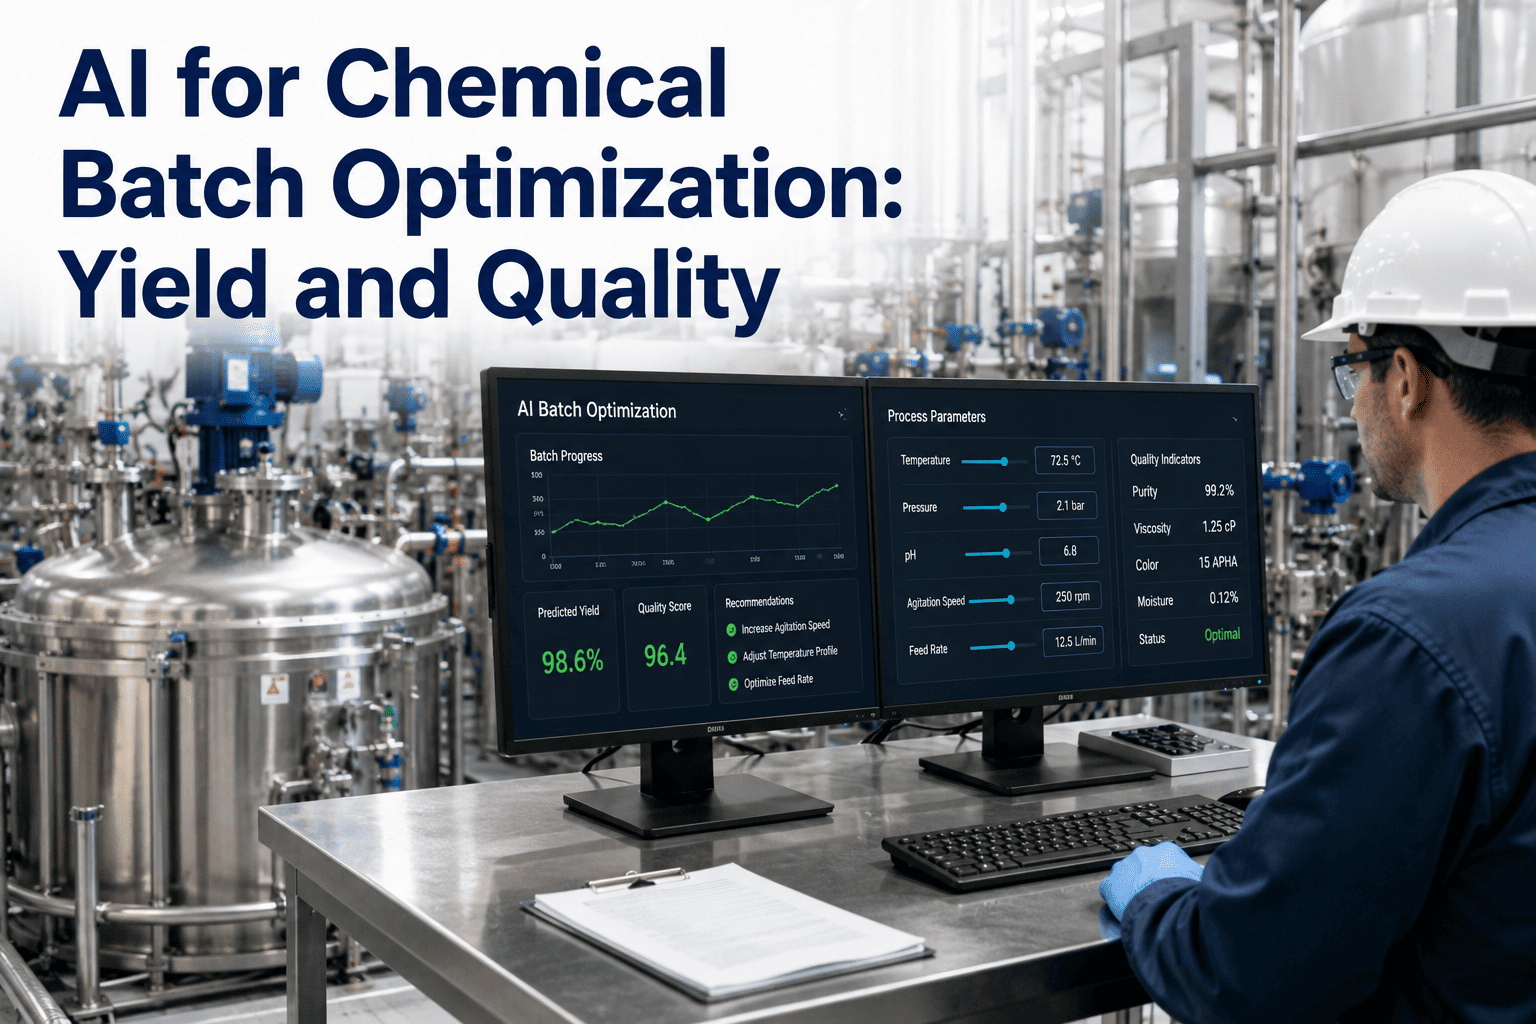
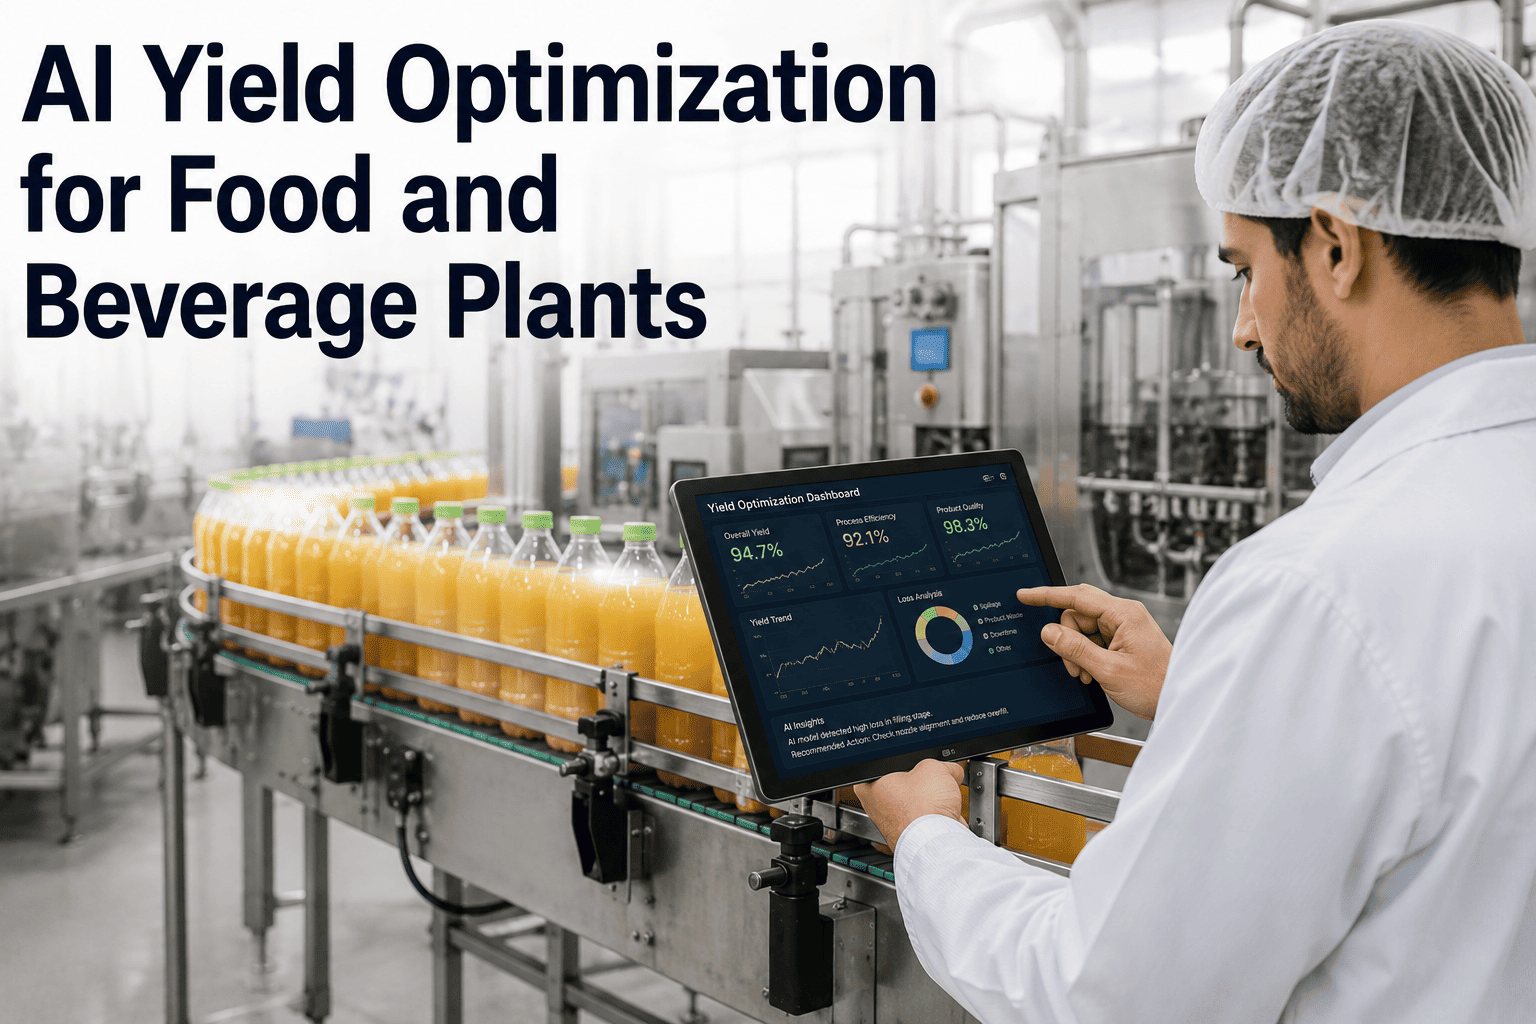
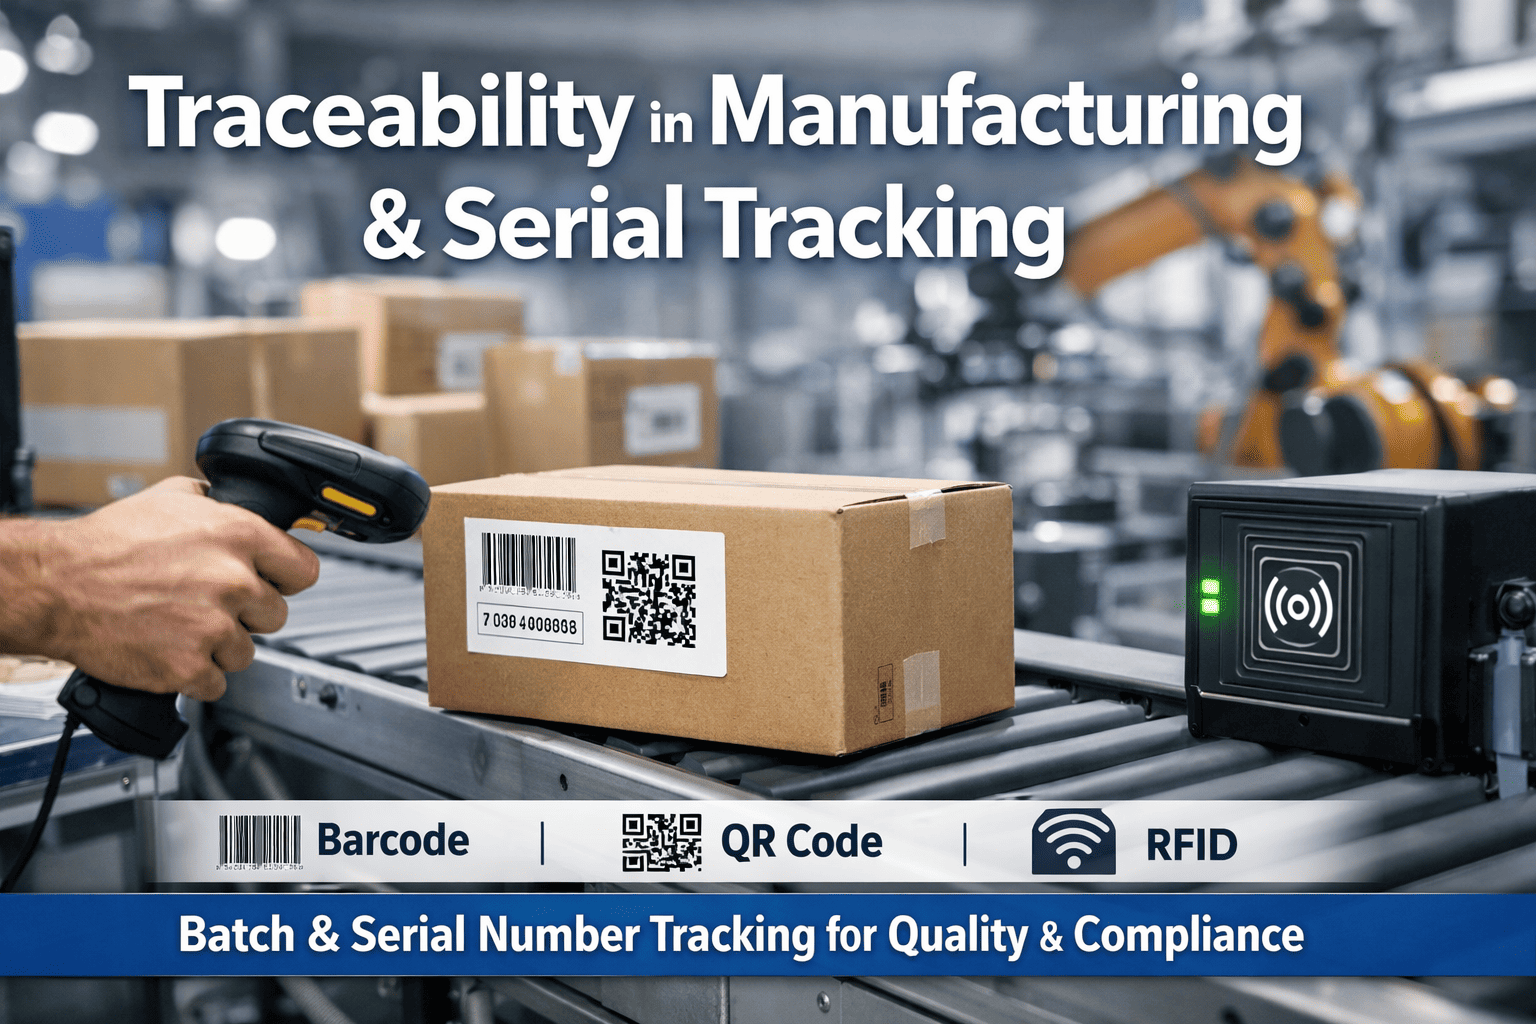
Most food manufacturers set shelf life once, at launch, using accelerated testing on a handful of samples, and then apply that same date code to every batch that rolls off the line for years afterward. But shelf life is not a formulation constant — it is the outcome of dozens of variables that shift batch to batch: raw material lot, fill temperature, headspace oxygen, seal integrity, and the storage conditions a pallet actually experiences after it leaves the plant. AI-based shelf-life prediction treats it as what it really is, a per-batch calculation grounded in production data, and our team can show you what that looks like against your own batch records in a short working session.
Food Manufacturing Quality Intelligence
The Date on the Package Was Set Once. Your Process Changes Every Day.
Traditional shelf-life testing gives you one number for an entire product line. AI-based prediction gives you a per-batch estimate grounded in the actual production and packaging data behind every lot.
Why One Shelf-Life Number Was Never Quite Right
Accelerated shelf-life testing compresses a twelve-month study into a matter of weeks by storing samples at elevated temperature and extrapolating decay rates back to normal conditions. It is a genuinely useful method for early-stage formulation decisions — but it produces one number, generated from a handful of lab samples, that then gets printed on every package regardless of which raw material lot, which line, or which shift actually produced that specific batch. The gap between that lab-derived number and a given batch's real shelf life is where both food waste and, in the worst cases, food safety risk quietly accumulate.
Raw material lot variability
Fill and seal temperature
How AI Builds a Per-Batch Prediction
Rather than replacing accelerated shelf-life testing, AI prediction sits on top of it — using the lab-derived decay curve as a starting model, then continuously refining that model against production sensor data, packaging QC results, and real-world return or complaint data as it comes in. The result is a shelf-life estimate that reflects the batch actually produced, not the average sample from a validation study run years earlier.
1
Baseline Model
Accelerated and real-time shelf-life study data establishes the decay curve for the formulation and packaging format.
2
Production Data Capture
Fill temperature, headspace gas, seal test results, and raw material lot data are logged automatically for every batch at the point of production.
3
Model Refinement
The model adjusts the predicted decay curve for that specific batch based on how its production parameters compare to the validated baseline.
4
Batch-Level Prediction
A batch-specific shelf-life estimate, with a confidence range, is generated and can inform date coding, rotation priority, or distribution routing.
Where the Prediction Gap Costs You
A shelf-life number that is too conservative wastes good product through unnecessarily early rotation and markdowns. A shelf-life number that is too optimistic risks product reaching a consumer past the point of real quality or safety. Both failure modes come from the same root cause — treating every batch as identical when the data says otherwise.
Fixed Date Code
One shelf-life number applied to every batch regardless of actual production conditions
Conservative dates built in to cover worst-case batch variability, wasting good product
Cold-chain deviations discovered only after a complaint or return
Recall scope defaults to entire lot or date range when an issue is found
AI Batch Prediction
Shelf life calculated per batch from actual production and packaging data
Rotation and markdown decisions based on real predicted freshness, reducing waste
Cold-chain telemetry flags a deviation and its shelf-life impact in near real time
Recall scope narrows to the specific batches actually affected by a root cause
Food waste from overly conservative date coding and the safety exposure from overly optimistic date coding are two sides of the same data problem. See what a per-batch shelf-life model looks like against your own production records.
Book a 30-minute demo and bring a sample of recent batch data.
Shelf-Life Prediction by Product Category
Every food category degrades through a different dominant mechanism, and an effective AI shelf-life model is trained on the mechanism that actually drives spoilage for that product rather than a generic decay curve. Applying a produce-focused respiration model to a shelf-stable packaged good, or a microbial-load model to a low-moisture product, produces predictions that look precise but are calibrated to the wrong physics entirely.
Fresh Produce
Respiration rate, moisture loss, and visual ripeness are tracked through computer vision and environmental sensors, predicting remaining freshness window per lot.
Dairy & Chilled
Cold chain consistency and microbial growth modeling dominate the prediction, since even brief temperature excursions materially shift safe shelf life.
Meat & Poultry
Packaging atmosphere, initial microbial load, and storage temperature are combined into a spoilage risk score specific to each processing batch.
Shelf-Stable & Packaged
Seal integrity, headspace oxygen, and moisture migration through packaging drive the model, since these products degrade slowly but the margin for error narrows late in shelf life.
What This Looks Like in Production
The value of batch-level prediction only materializes when it connects to the systems that actually make decisions — date coding, inventory rotation, and distribution routing. Isolated in a spreadsheet, even a highly accurate shelf-life model changes nothing on the plant floor. Integration into existing warehouse management and distribution planning systems is usually the difference between a model that produces interesting numbers and one that actually reduces waste and risk.
Production
Batch parameters are captured automatically as the product moves through fill, seal, and pack, with no added manual data entry for line operators.
Prediction
The model generates a batch-specific shelf-life estimate within minutes of the batch completing, well before the pallet leaves the facility.
Distribution
Predicted shelf life informs routing decisions, prioritizing shorter-window batches to closer distribution points to maximize sellable life at retail.
Feedback
Retail sell-through data and any consumer complaints feed back into the model, continuously improving prediction accuracy for future batches.
The Cost of Getting It Wrong in Either Direction
Food waste driven by overly conservative date coding is one of the largest preventable losses in the food supply chain, and it compounds at every stage from plant to distribution center to retail shelf to consumer refrigerator. A fixed shelf-life number that assumes worst-case batch variability for every lot means the majority of batches, which perform better than that worst case, get pulled and discounted earlier than their actual quality would require. At scale across a multi-SKU production facility, that gap between predicted and actual shelf life represents a measurable percentage of total output value written off unnecessarily.
The other direction carries a different kind of cost. An optimistic date code applied uniformly across batches that actually varied in production quality can allow a below-average batch to reach a consumer past the point of genuine freshness or, in a worst case, safety. Because that risk is distributed across every unit sharing a date code rather than isolated to the specific batches where it originated, the exposure is broader than it needs to be. Per-batch prediction narrows both problems at once by replacing a single assumption with an estimate grounded in what that specific batch's data actually shows.
What This Means for Compliance and Documentation
Shelf-life claims sit inside a regulatory framework regardless of how they're generated, and moving to batch-level prediction doesn't change the underlying obligation to document how a date is derived and validated. What it does change is the quality of the evidence available when a regulator, auditor, or customer asks that question. A fixed date code backed by a single validation study answers "how was this determined" with one report from years ago; a batch-level system answers it with a continuously validated model and a full data trail for the specific batch in question.
Traceability
Every batch's production parameters and predicted shelf-life basis are logged automatically, strengthening the audit trail behind every date code issued.
Validation Continuity
The model's predictions are checked against real outcome data on an ongoing basis rather than validated once and left unchecked for years.
Deviation Documentation
Cold-chain or process deviations and their calculated shelf-life impact are captured automatically instead of relying on manual incident logs.
Audit-Ready Reporting
Batch-level prediction history can be exported in the format your QA and regulatory teams already use for internal and third-party audits.
Getting Started: What the First Few Months Look Like
Facilities evaluating batch-level shelf-life prediction usually want a realistic picture of the work involved before committing, not just the end-state benefit. The path below reflects how most food manufacturers move from an initial data review to a working prediction system feeding real decisions.
1
Data Review
Existing batch records, shelf-life study data, and line sensor logs are reviewed to identify what's already digitized and what needs to be connected.
2
Baseline Model Build
The accelerated and real-time shelf-life study becomes the model's starting decay curve for each formulation and packaging format in scope.
3
Pilot on Priority SKUs
A small set of SKUs with the highest waste or risk exposure runs the batch-level model first, validating predictions against real outcomes before wider rollout.
4
Facility-Wide Rollout
Validated pilot results extend to the full SKU portfolio, with predictions feeding rotation, markdown, and distribution decisions in production.
Frequently Asked Questions
Does AI-based prediction replace our accelerated and real-time shelf-life studies?
No — the lab-derived decay curve from your accelerated and real-time studies remains the foundation the AI model builds on. What changes is that the model continuously refines its predictions using live production data instead of applying that lab-derived number unchanged to every batch for years. Your existing testing protocol, acceptance criteria, and regulatory documentation stay in place; the AI layer adds batch-level precision on top of a study design your team already trusts.
Walk through how this fits your existing testing program.
Can this actually change the date code we print on packaging?
Any change to a printed date code involves regulatory and label-compliance review specific to your product category and market, and batch-level predictions do not bypass that process. What batch-level prediction typically changes first is internal decision-making — rotation priority, markdown timing, and distribution routing — where the tighter, batch-specific estimate can be acted on immediately. Facilities that want to move toward dynamic date coding on the package itself generally pursue that as a longer-term phase once the underlying prediction accuracy has been validated over multiple production cycles.
How accurate is a per-batch prediction compared to standard lab testing?
Accuracy depends heavily on how much production and environmental data is available to refine the model, but published research on AI-based shelf-life modeling consistently shows deep learning and hybrid mechanistic-AI approaches improving on static extrapolation methods, particularly for categories like fresh produce and chilled products where storage variability is the dominant driver of actual shelf life. The model's confidence range narrows as more batches and more outcome data accumulate, which is why early deployments are typically framed as a decision-support layer rather than a replacement for existing QA sign-off.
Ask our team about validation approaches for your product category.
What data do we need to have in place before starting?
A useful starting point is whatever your plant already captures digitally: batch and lot records, fill and seal line sensor data, packaging QC results, and cold chain telemetry if your product moves through a temperature-controlled supply chain. Facilities without digitized batch records typically start with a shorter phase focused on connecting existing paper or spreadsheet-based batch logs into a structured format before the prediction model can be trained meaningfully. Most deployments reach a working baseline within six to eight weeks of data access being established.
How does this help if we ever need to run a recall?
Batch-level data capture is what makes a narrow, precise recall possible instead of a broad one. When every batch's production parameters, raw material lots, and predicted shelf-life characteristics are logged individually, a root-cause investigation can trace an issue back to the specific batches that share the causal factor rather than defaulting to a full date-range or full-lot recall out of caution. That precision reduces both the cost of the recall and the amount of unaffected product pulled unnecessarily.
Ask how batch traceability integrates with your QA system.
Stop Printing One Date on Every Batch
See a Batch-Level Shelf-Life Prediction Built From Your Own Data
Bring a sample of recent batch and production records. We'll show you what a per-batch shelf-life model looks like, where your current fixed date code is likely too conservative or too tight, and how the prediction connects to rotation and distribution decisions.