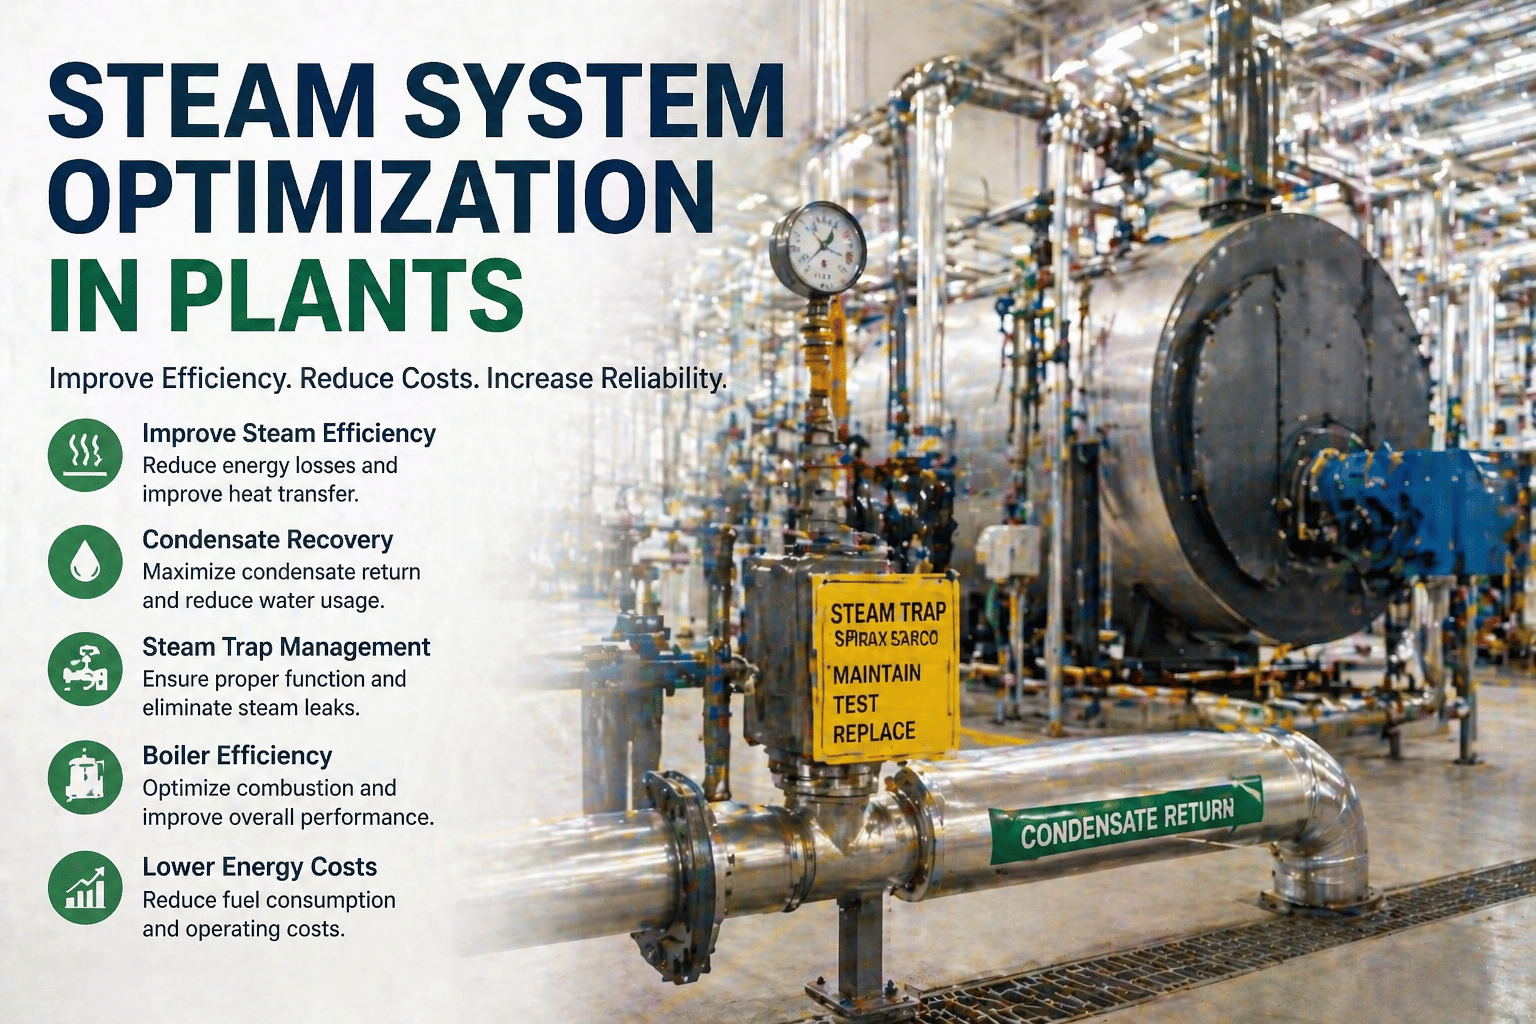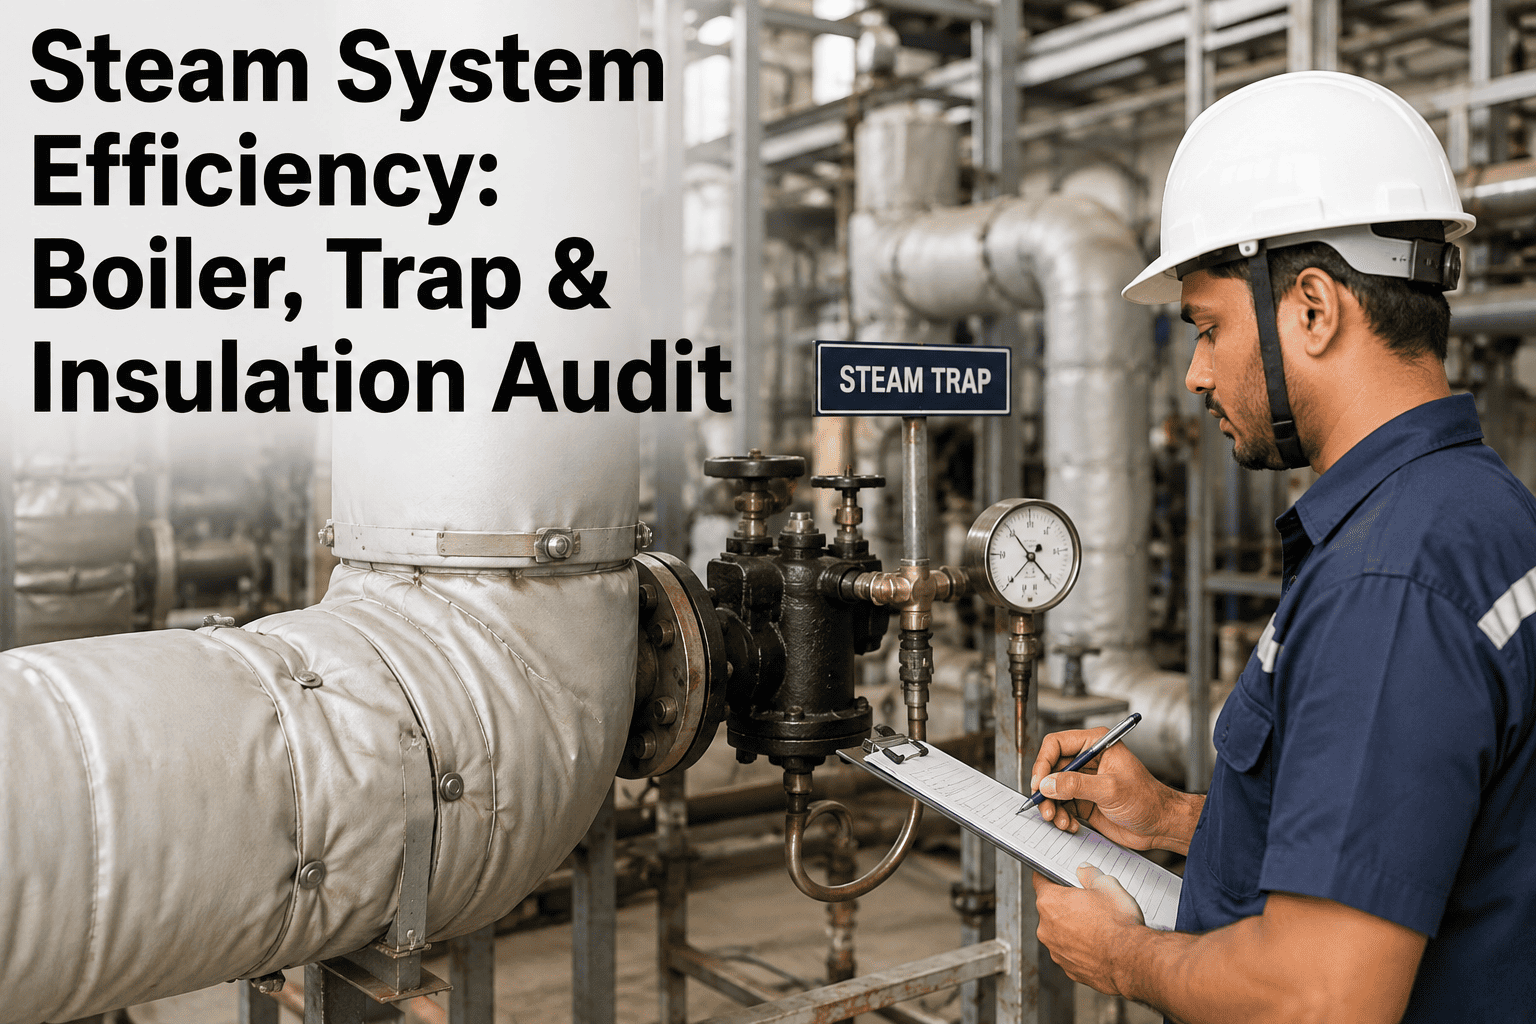
Somewhere between the boiler house and the last process heat exchanger, most manufacturing plants are quietly burning fuel to heat the floor, the roof cavity, and the outside air. Industry studies consistently show that poorly maintained steam systems waste fifteen to thirty percent of all steam generated, and the losses hide in three places: combustion that never got tuned, traps that failed months ago and nobody noticed, and insulation that degraded slowly enough that no single day looked alarming. This blog breaks down how to audit all three, what a proper trap survey and insulation assessment actually involve, and how to turn the findings into a prioritized repair list a plant manager can act on. If your steam system has not been formally audited in the last year, book a demo with iFactory and see where your losses are actually hiding.
Find the 15-30% of Steam You Are Paying For and Never Using
Boiler combustion tuning, steam trap failure detection, and insulation heat-loss auditing — the three-part discipline that turns a steam system from a hidden cost center into a tracked, managed asset.
Where Steam Money Actually Leaks
A steam system loses efficiency at every stage between the burner and the final process load. Understanding the relative size of each loss category is what determines where an audit — and a repair budget — should focus first, rather than spreading a limited maintenance budget evenly across every symptom that gets reported.
Boiler Combustion: The Foundation the Rest of the Audit Depends On
Combustion efficiency compounds through everything downstream. A boiler running at 72 percent instead of 80 percent is not just burning more fuel — it is generating more stack emissions, consuming more water treatment chemical, and adding thermal stress that shortens equipment life.
- Combustion efficiency 3-5 percentage points below optimum
- Excess air running high, wasting heat up the stack
- Burner tuned once at commissioning, never revisited
- Fouled heat transfer surfaces reducing effective output
- Combustion tuned to target excess air for the fuel and load
- Flue gas O2 and stack temperature tracked continuously
- Burner tuning scheduled on a fixed interval, not left to chance
- Heat transfer surfaces cleaned on a data-driven schedule
Rule of thumb: every one percentage point of combustion efficiency gained is a direct one percent reduction in fuel spend at that boiler, applied across every hour it runs for the rest of the year.
See Your Combustion Trend Before It Costs You a Quarter
iFactory tracks flue gas oxygen, stack temperature, and combustion efficiency continuously, flagging drift the week it starts instead of the year it finally gets noticed at the annual inspection.
Steam Trap Survey: The Fastest Payback in the Entire Audit
A typical unaudited industrial steam system has ten to twenty percent of its traps failed at any given time. Trap repair programs routinely pay back in under ninety days, making the trap survey the single highest-return line item on a steam efficiency audit.
The trap blows live steam continuously past the condensate it should be discharging. This is the most expensive failure mode — a single failed-open trap can waste tens of thousands of kilowatt-hours a year.
The trap blocks condensate entirely. No energy is wasted directly, but condensate backs up into the steam space, causing water hammer, reduced heat transfer, and process temperature problems.
The trap cycles cleanly — discharging condensate in short bursts and closing before live steam escapes. This is the baseline every trap in the survey is being compared against.
The Department of Energy recommends annual steam trap surveys for most industrial plants and semi-annual surveys for high-usage facilities. Facilities without a formal survey in three or more years should start with a full baseline audit rather than a spot check.
Insulation Heat Loss: What an Uninsulated Pipe Actually Costs
Insulation is the most visible loss in the entire system — you can literally feel the heat radiating off a bare fitting — yet it is frequently the last thing addressed because no single missing section looks catastrophic on its own.
Figures assume 250°F saturated steam against a 70°F ambient. A comprehensive insulation audit and upgrade program typically delivers five to ten percent overall system efficiency improvement, and the payback on insulation repair is almost always measured in months, not years.
Condensate Recovery: The Savings Hiding in the Drain
Condensate carries roughly a quarter of the total energy content of the steam that produced it, plus treated makeup water that cost money to soften and de-aerate in the first place. Returning it to the boiler feedwater tank captures both.
Half of the facilities audited still dump condensate to drain simply because a return line leaked years ago and nobody scheduled the repair. Fixing the return path is frequently a lower-cost fix than any other item on the audit list.
The Steam System Audit Sequence
A full boiler room and distribution audit follows the same core sequence whether it is performed by an in-house energy team or an outside specialist. Each stage produces a documented finding with an estimated dollar value attached.
Pull twelve months of fuel consumption, steam generation, and makeup water volume to establish the starting point every finding gets measured against.
Measure flue gas oxygen and stack temperature against target excess air for the fuel type and current load, and log the efficiency gap in percentage points.
A certified technician tests every trap ultrasonically at a rate of roughly seventy-five traps a day, documenting location, type, condition, and failure mode.
Walk the full distribution network noting missing, wet, or damaged insulation on pipes, valves, and flanges, and estimate the heat loss at each point.
Trace return line routing, check for leaks or bypassed sections, and measure the current condensate return rate against the theoretical maximum.
Rank every finding by estimated annual dollar value and payback period, so the repair budget goes to the highest-return items first.
Turning Audit Findings Into a Budget Leadership Will Approve
Every finding from a steam audit needs a dollar figure and a payback period attached before it goes anywhere near a capital request. The framework below is how iFactory structures a findings report so the highest-return items rise to the top automatically.
A dramatic-looking bare pipe section may cost less annually than a quietly failed trap tucked behind a heat exchanger. Sort every finding by estimated annual dollar value first, and let visual severity take a back seat.
Batching trap replacements, insulation jacketing, and condensate line repairs by physical area reduces mobilization cost and lets a single maintenance window address several findings at once.
Trap repairs and insulation jacketing are typically maintenance-budget items with near-immediate payback. Burner replacement or boiler retubing belongs in a separate capital request with its own multi-year business case.
A repair without a follow-up measurement is a guess. Schedule a re-check on fuel consumption, trap condition, or insulation surface temperature thirty to sixty days after each fix to confirm the savings actually materialized.
Continuous Monitoring vs. Periodic Audits: Why the Gap Between Surveys Matters
A once-a-year trap survey and combustion check is far better than nothing, but the months between surveys are exactly when a newly failed trap or a drifting burner quietly erodes the savings from the last audit. Continuous monitoring closes that gap.
A trap that fails the week after the annual survey runs undetected for up to eleven months before the next scheduled check finds it, wasting thousands of dollars in fuel during the gap.
- Detection lag: up to a full survey cycle
- Combustion drift goes unnoticed between visits
- Findings report is a snapshot, not a trend
Acoustic sensors on high-value traps and continuous flue gas analysis on the boiler catch a failure or a combustion drift within days, feeding directly into a maintenance work order instead of waiting for the next scheduled walk-down.
- Detection lag: days, not months
- Combustion trend visible in real time
- Every finding logged with a repair history for ROI reporting
Five Mistakes That Let Steam Losses Creep Back
Even plants that complete a thorough one-time audit often watch the savings erode within a year or two. These are the patterns behind that slow reversal.
Treating the audit as a one-time event
Traps fail continuously, not just once. A plant that audits every three years re-discovers the same ten to twenty percent failure rate it thought it had fixed the last time.
Fixing the audit findings but not tracking recurrence
Without a logged repair history per trap and pipe segment, there is no way to tell whether a specific location keeps failing and needs a different trap type or insulation approach.
Passing the annual pressure inspection and stopping there
A jurisdictional safety inspection checks compliance, not efficiency. Plants that treat it as their only steam system review miss the combustion drift and trap failures happening the other eleven months.
Reinsulating without fixing the leak underneath
Wrapping new insulation over a leaking flange or valve packing hides the problem visually while the underlying loss and the corrosion risk both continue unaddressed.
Ignoring condensate return in the efficiency budget
Teams that focus only on traps and insulation while leaving condensate to drain are walking past one of the fastest, cheapest fixes available in the entire audit.
Frequently Asked Questions
How often should a plant run a full steam trap survey?
The Department of Energy recommends an annual survey for most industrial facilities and a semi-annual survey for high-usage plants running continuous production. Facilities that have never had a formal survey, or have not had one in three or more years, should start with a complete baseline audit rather than a partial spot check, since trap failure rates tend to be significantly underestimated without one. Book a demo to see how continuous trap monitoring replaces the need to wait for the next scheduled survey.
What is the typical payback period for steam system efficiency repairs?
Steam trap repair programs frequently pay back in under ninety days, making them the fastest return of any item on a typical audit. Insulation repair and combustion tuning generally pay back within a single year, and combined boiler room audits covering all three areas commonly show payback under twelve months across the full recommendation list. The exact figure depends on facility steam consumption, fuel cost, and how long the losses have gone unaddressed.
Can steam trap monitoring be automated instead of relying on manual ultrasonic surveys?
Yes. Acoustic and temperature sensors mounted on high-value traps can detect a failed-open or failed-closed condition continuously, flagging it the day it happens rather than waiting for the next scheduled survey months later. Manual ultrasonic surveys remain useful for lower-priority traps where continuous sensor coverage is not cost-justified. Our support team can help design a hybrid monitoring plan matched to your trap population.
How much does insulation heat loss actually add to the annual fuel bill?
Distribution and insulation losses typically account for ten to twenty percent of total generated steam in a poorly maintained system. A single uninsulated four-inch pipe run of one hundred feet can lose well over a thousand dollars worth of fuel a year at typical industrial steam conditions, and a plant with hundreds of feet of degraded insulation across its distribution network can be losing a meaningful percentage of its entire steam fuel budget to radiated heat alone.
Does improving condensate return rate really move the needle on fuel costs?
Yes, and it is often underestimated. Condensate retains roughly a quarter of the total energy content of the steam that generated it, plus the cost of the treated makeup water it replaces. Plants that raise their condensate return rate toward near-complete recovery commonly see fuel savings in the low single digits up to around eight percent, depending on how far the current return rate is below the achievable maximum.
Ready to Stop Guessing Where Your Steam Losses Are?
Book a 30-minute demo with iFactory. Bring your last boiler inspection report, leave with a prioritized loss breakdown across combustion, traps, insulation, and condensate return.