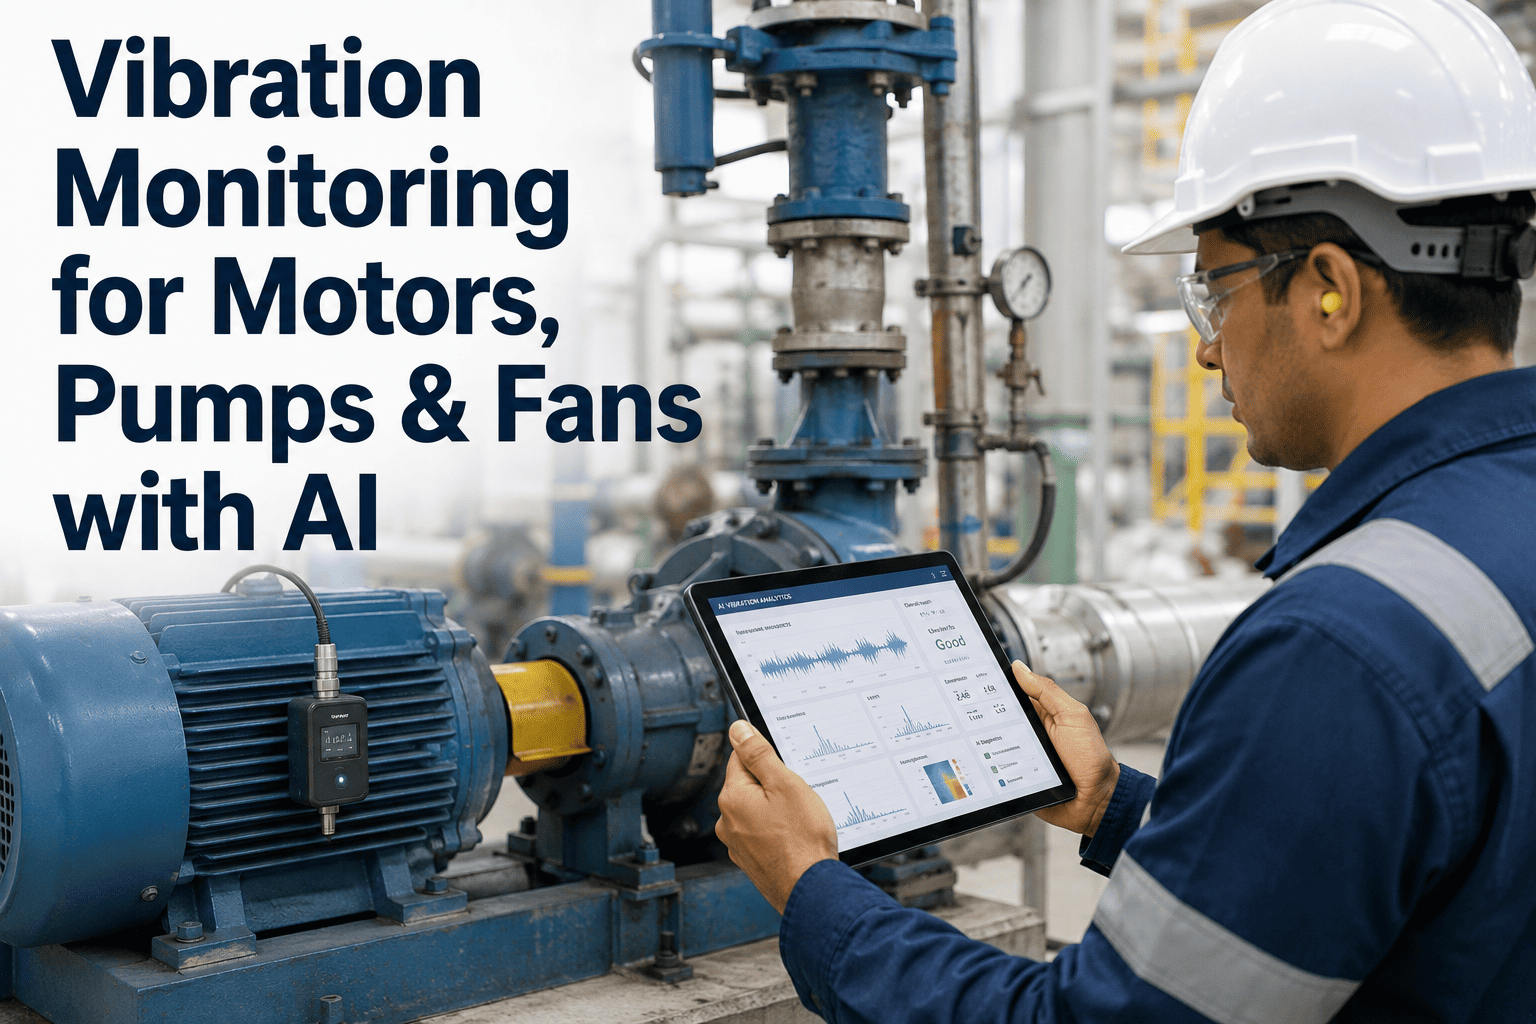
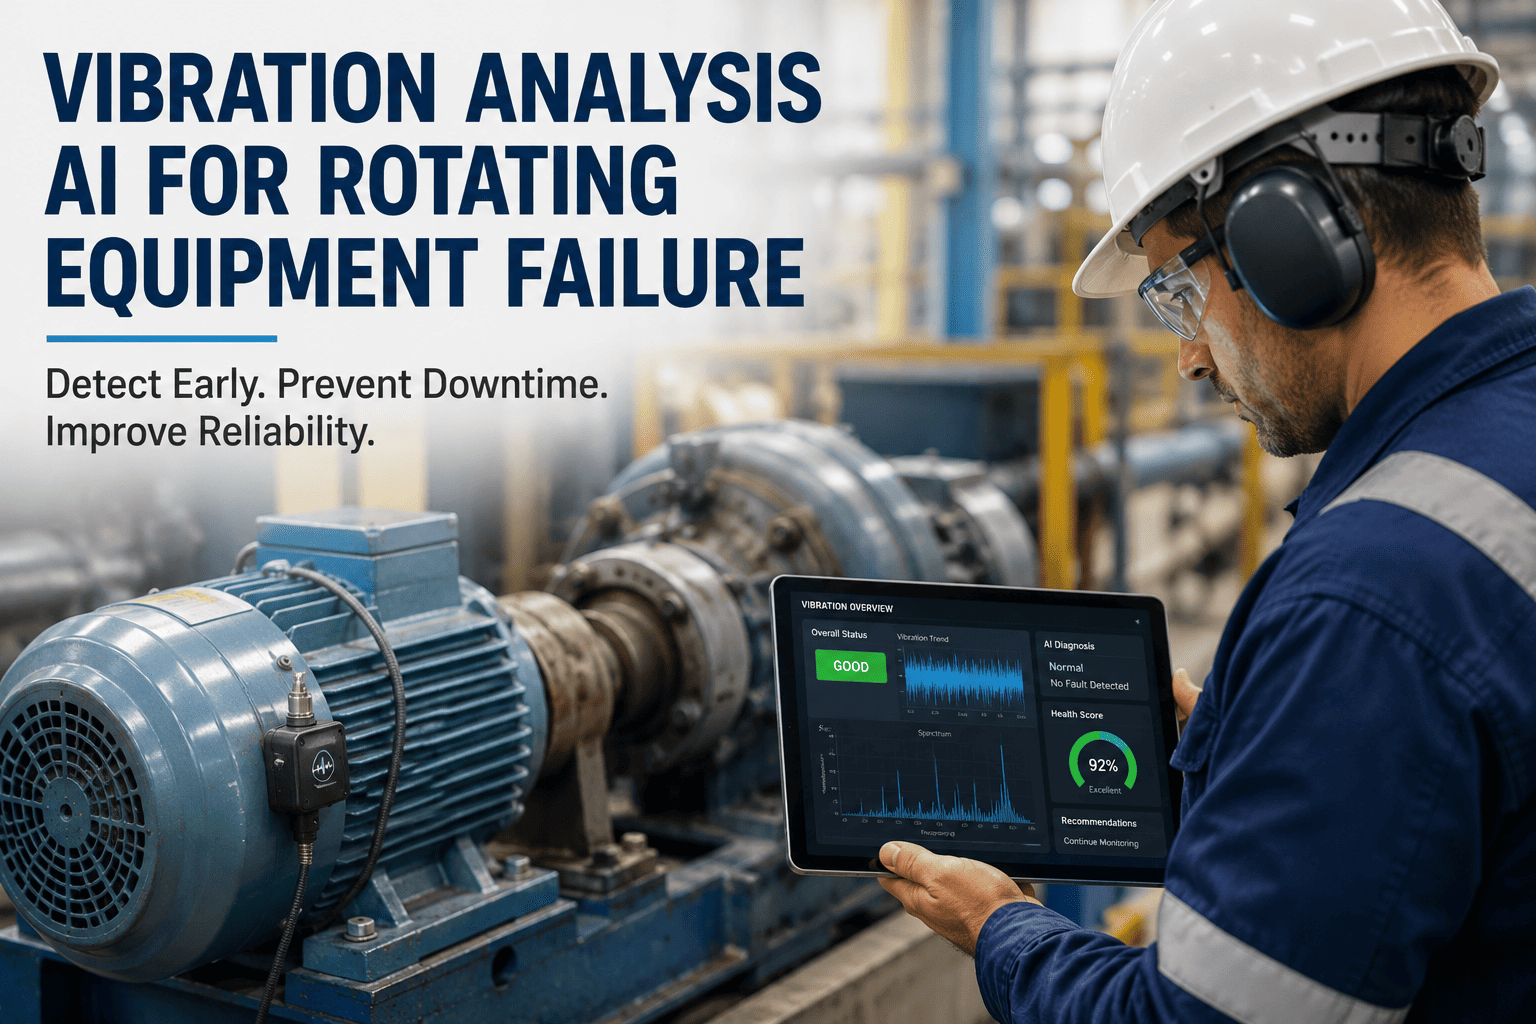
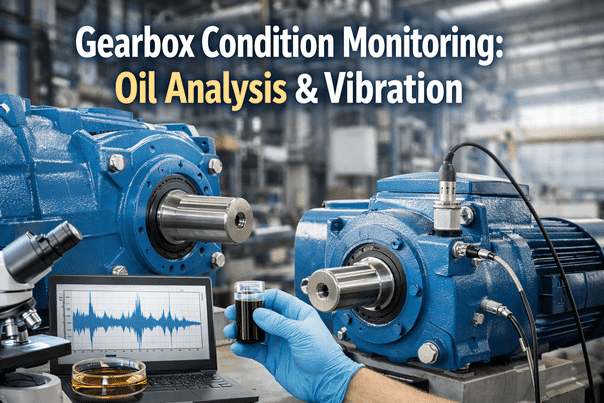
A motor bearing that is eleven days from failure sounds almost identical to a healthy one to the human ear, but it is already writing its own diagnosis into the vibration spectrum. Plants running hundreds of motors, pumps, and fans across a facility cannot send a technician with a handheld collector to every asset every week, which means the assets that fail between rounds fail without warning. AI-driven vibration monitoring closes that gap by listening continuously, recognizing fault patterns like bearing defects, misalignment, and imbalance as they emerge, scoring severity automatically, and estimating how many operating days remain before intervention is required. Reliability teams evaluating this shift from periodic to continuous monitoring can book a demo to see fault detection running against their own rotating asset fleet.
PREDICTIVE MAINTENANCE · VIBRATION INTELLIGENCE · 2026
Hear Every Fault Before It Becomes a Failure
AI vibration monitoring for motors, pumps, and fans that recognizes fault signatures, scores severity, and predicts remaining useful life continuously across the fleet.
Why Periodic Vibration Rounds Miss Failures
Route-based vibration collection, walked once every two to four weeks, was designed for a slower failure environment than most modern production lines actually experience.
70%
Of unplanned motor failures show a detectable vibration signature more than 30 days before the fault becomes catastrophic
3-4x
Higher repair cost when a bearing fault progresses to secondary shaft or housing damage before detection
10-45
Days of typical warning window between early-stage bearing defect and functional failure, depending on load and speed
24/7
Continuous sensing coverage replaces a two to four week manual route on the same critical asset
The Four Fault Signatures AI Models Learn to Recognize
Every rotating machine problem writes a distinct signature into the frequency spectrum, and pattern recognition models are trained to separate these signatures automatically instead of relying on a technician's manual FFT read.
Bearing Defects
Ball pass frequencies on the outer race, inner race, rolling elements, and cage generate distinct harmonic peaks long before the bearing produces audible noise or measurable heat.
Misalignment
Angular and parallel misalignment show up as elevated 2x running speed vibration with characteristic axial components that a well-tuned model separates from imbalance.
Imbalance
A dominant 1x running speed peak with a stable phase relationship points to mass imbalance, often from buildup on fan blades or impeller wear.
Looseness & Resonance
Mechanical looseness generates a harmonic series across multiple orders of running speed, while resonance amplifies vibration at a structure's natural frequency regardless of load.
From Raw Signal to Maintenance Decision
Step 1
Continuous Signal Capture
Accelerometers stream time-waveform and spectral data continuously rather than during a scheduled walk, capturing transient events a monthly route would never see.
Step 2
Pattern Recognition
Trained models classify the signature against known fault types, distinguishing bearing wear from misalignment, imbalance, and looseness automatically.
Step 3
Severity Scoring
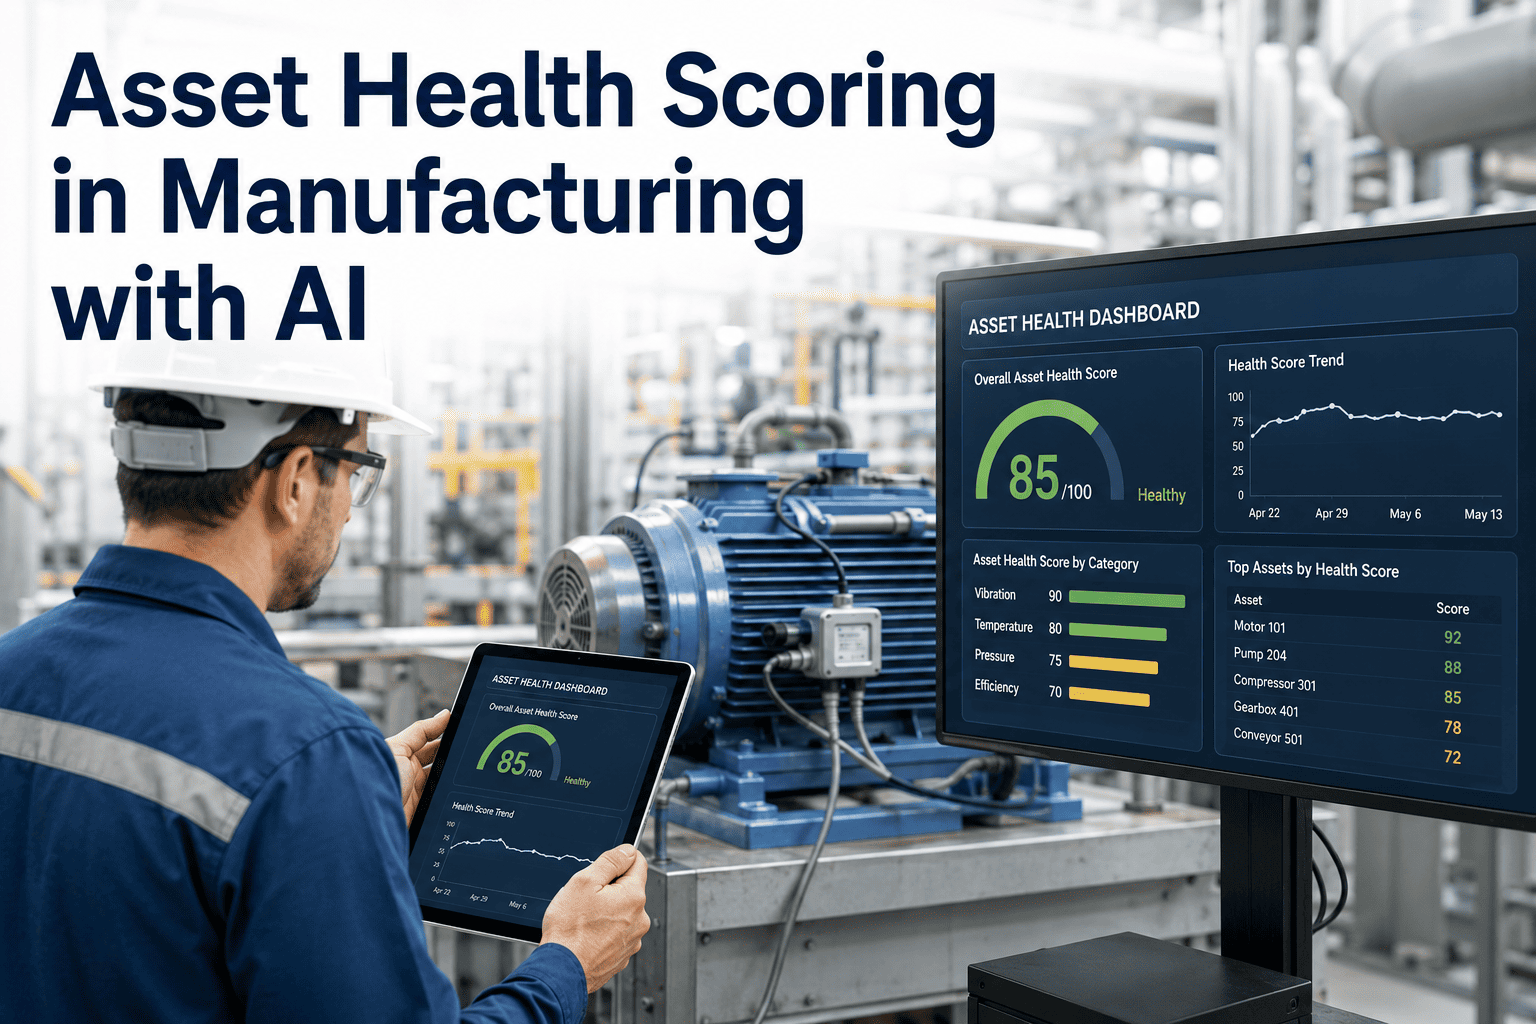
Each detected fault is scored against ISO 10816 style velocity thresholds and historical trend rate, ranking assets by urgency rather than treating every alert equally.
Step 4
Remaining Useful Life
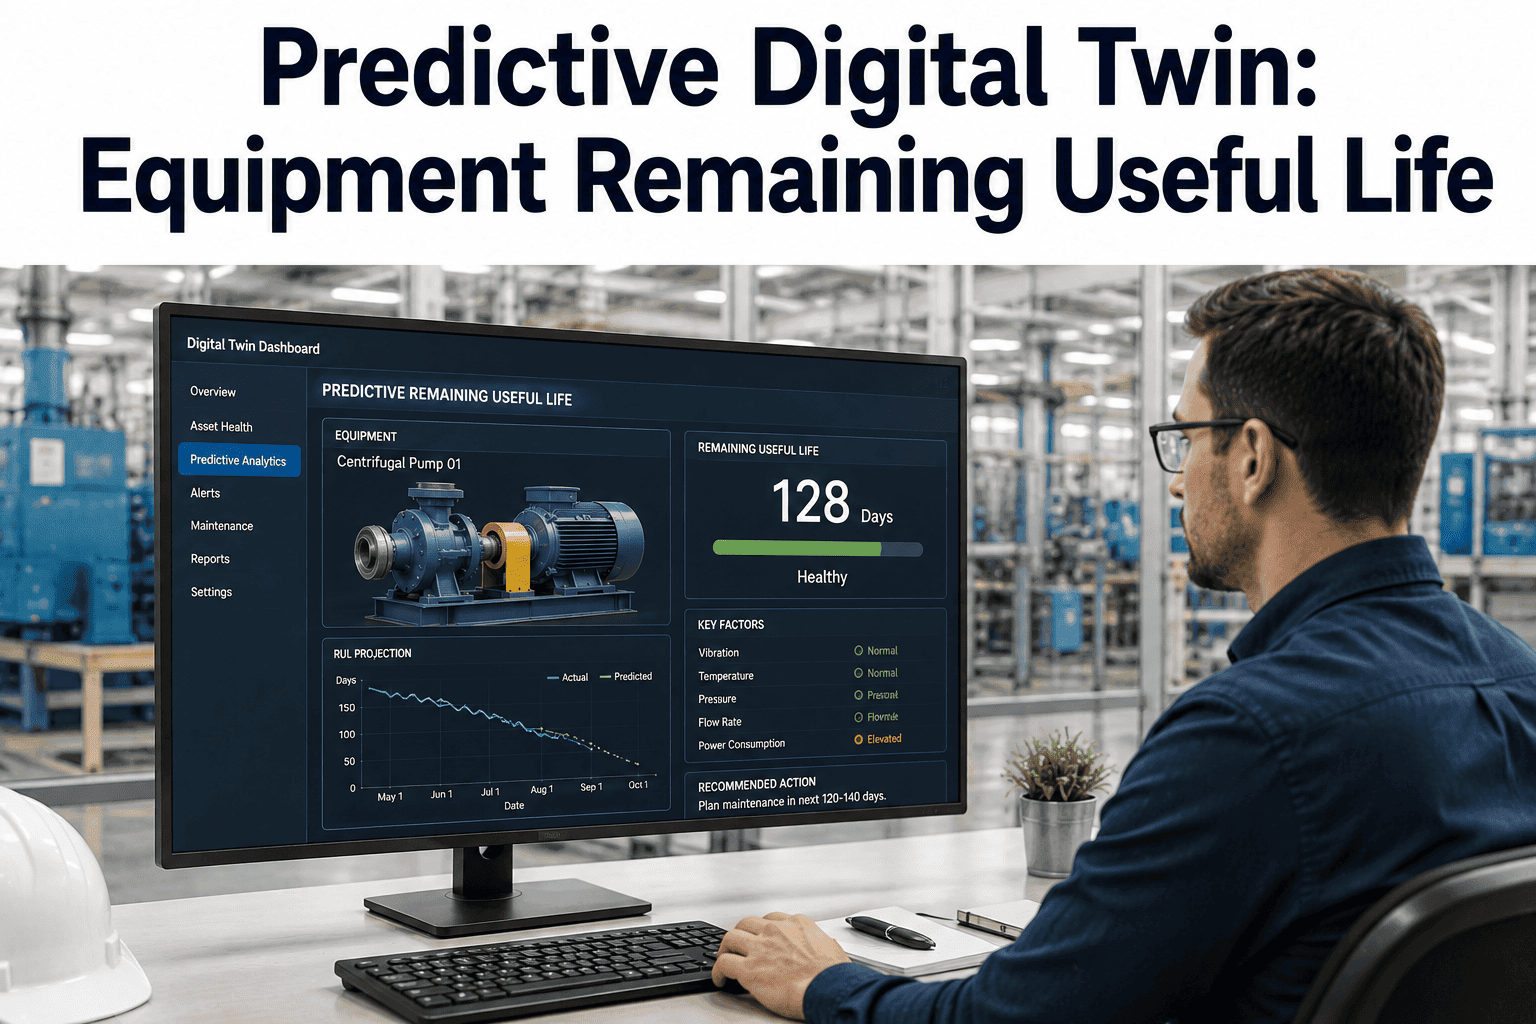
Trend-rate modeling estimates the operating window remaining before the fault reaches functional failure, giving planners a maintenance date instead of a guess.
Severity Bands Used Across a Typical Fleet
| Severity Band | Vibration Behavior | Recommended Action |
| Good |
Stable amplitude, no dominant fault frequency |
Continue continuous monitoring, no action needed |
| Acceptable |
Minor elevation at 1x or 2x running speed |
Trend weekly, schedule inspection at next planned outage |
| Unsatisfactory |
Clear fault harmonic present, rising trend rate |
Schedule targeted maintenance within 2-4 weeks |
| Unacceptable |
Severe amplitude, multiple fault frequencies present |
Immediate inspection, plan shutdown before next shift if load-critical |
Monitoring Priorities by Asset Type
Motors, pumps, and fans each fail differently, and a fleet-wide monitoring program tunes its fault library and alert thresholds to the specific asset class rather than applying one generic model everywhere.
Motors
Bearing wear, rotor bar defects, and airgap eccentricity dominate motor failure modes, with electrical fault signatures often appearing in the vibration spectrum before a thermal or current anomaly.
Pumps
Cavitation, seal wear, and impeller imbalance generate broadband noise and characteristic vane-pass frequencies that a well-tuned model separates from normal hydraulic turbulence.
Fans
Blade fouling, belt wear, and bearing degradation on large industrial fans typically show up first as slow-rising 1x amplitude tied to dust or material buildup on the blades.
RELIABILITY ENGINEERING · ROTATING EQUIPMENT
See Your Fleet's Fault Signatures Live
Compare continuous AI monitoring against your current vibration route on the assets that matter most.
Why Bearing Faults Dominate the Failure Statistics
Across most rotating equipment fleets, bearing-related failures account for the largest single category of unplanned downtime, which is why bearing defect frequencies receive so much attention in any vibration monitoring model. A rolling element bearing generates four distinct characteristic frequencies tied to its physical geometry: the ball pass frequency of the outer race, the ball pass frequency of the inner race, the ball spin frequency, and the fundamental train frequency of the cage itself. As a defect develops on any one of these surfaces, energy at the corresponding frequency and its harmonics begins to rise steadily above the noise floor long before the defect becomes large enough to generate audible noise or measurable heat at the housing.
What makes this early-stage detection genuinely useful rather than just academically interesting is the progression curve most bearing faults follow. A defect typically begins as a microscopic spall on a race or rolling element surface, generating a very low amplitude signal that only shows up clearly in the high-frequency envelope of the vibration spectrum rather than the raw time waveform. As the spall grows, amplitude increases at the fundamental defect frequency and its harmonics, and eventually sidebands appear around those harmonics as the defect begins interacting with cage rotation. By the time the fault reaches the stage where an untrained ear could detect unusual noise, the bearing has often already progressed well past the point where a planned replacement would have been the lower-cost option.
This is precisely why an AI classification layer adds real value over a simple threshold alarm. A model trained across a large population of bearings learns to recognize these progression stages automatically, distinguishing a stage-one spall showing up only in the envelope spectrum from a stage-three fault with clear sidebands and rising broadband energy. That staging directly informs the remaining useful life estimate, since a stage-one fault might allow months of continued safe operation while a stage-three fault demands action within days. Reliability teams managing a fleet of hundreds of motors, pumps, and fans depend on this staging to decide which alerts genuinely need attention today versus which can be scheduled into the next planned maintenance window without meaningful risk.
Misalignment and imbalance, while less catastrophic in isolation than a severe bearing fault, carry their own cost story worth understanding. Persistent misalignment does not just generate vibration, it also accelerates coupling wear, increases bearing loading beyond design tolerance, and raises energy consumption as the motor works against unnecessary mechanical resistance. A fan running with even modest imbalance from blade fouling can see measurably higher energy draw long before the vibration amplitude alone would trigger a maintenance alert under older threshold-based monitoring approaches, which is one more reason continuous severity scoring across all fault types, not just the most dramatic ones, tends to produce a stronger overall return than monitoring bearing faults in isolation.
Continuous Monitoring vs Periodic Route: Outcome Comparison
Continuous AI Monitoring
Faults flagged within hours of onset, not weeks
Severity scoring prioritizes the fleet automatically
Remaining useful life supports planned parts ordering
Periodic Manual Route
Faults discovered only on the scheduled walk date
Technician judgment varies across readings and shifts
Secondary damage often accumulates between rounds
Rolling Out Continuous Monitoring Without Disrupting Production
One of the most common concerns reliability leaders raise before starting a continuous vibration program is the disruption sensor installation might cause on running equipment. In practice, most modern accelerometers can be mounted on an operating motor, pump, or fan bearing housing during a brief planned pause or even without stopping the machine at all, using magnetic mounts for temporary installation or adhesive and stud mounts for permanent placement during the next scheduled outage. Wireless sensor options have made this rollout considerably faster than the wired systems of a decade ago, since there is no need to run cable trays or conduit back to a central data acquisition unit, and a facility can typically instrument its first twenty to thirty critical assets within a single week without touching the production schedule.
Change management matters just as much as the hardware installation itself. A vibration monitoring program that generates alerts nobody trusts or acts on quickly becomes background noise, regardless of how accurate the underlying fault detection actually is. Successful rollouts typically start with a short validation period where the system's findings are cross-checked against the plant's existing manual vibration route or against a known fault the maintenance team is already tracking, building confidence in the tool before it becomes the primary trigger for maintenance decisions. Once that trust is established, alert routing into the existing computerized maintenance management system becomes the next priority, since a fault detected by the model but never converted into an actual work order provides no operational value regardless of its diagnostic accuracy.
Fleet prioritization is the final piece worth planning deliberately rather than instrumenting assets in whatever order happens to be convenient. Criticality ranking, typically based on the cost and safety consequence of an unplanned failure combined with the asset's failure history, should drive which motors, pumps, and fans get sensors first. A facility with two hundred rotating assets rarely needs continuous monitoring on all two hundred simultaneously; the twenty to forty assets whose failure would actually stop production or create a safety hazard usually account for the overwhelming majority of the program's total value, with lower-criticality equipment added in later phases once the initial rollout has proven its worth.
Common Mistakes That Undermine a Vibration Program
Treating Every Alert as Equal
Routing every vibration alert to the same maintenance queue without severity ranking quickly trains technicians to ignore notifications altogether, since a minor 1x amplitude shift and a genuine bearing defect end up looking identical in the inbox.
Skipping the Baseline Period
Comparing a new asset's first reading directly against a generic industry threshold, rather than letting the model learn that specific machine's normal operating envelope first, produces false alarms that erode trust in the entire system early on.
Ignoring Sensor Mounting Quality
A poorly mounted accelerometer, whether loose, mounted on a resonant bracket, or placed on the wrong axis, introduces measurement error that no amount of downstream analytics can correct, making mounting discipline as important as the sensor itself.
No Feedback Loop to the Model
When a technician inspects a flagged bearing and finds no fault, or finds a fault the model missed, that outcome needs to feed back into the system, otherwise the fault library never improves and confidence in future alerts keeps eroding.
Building the Cost Case for Continuous Monitoring
Justifying a continuous monitoring investment internally usually comes down to comparing the fully loaded cost of the sensors and software against the cost of even a single avoided failure on a critical asset, rather than trying to project an abstract fleet-wide percentage improvement that is harder for finance teams to evaluate. A single unplanned motor failure on a line-critical asset commonly costs far more in lost production, expedited parts freight, and overtime labor than an entire year of continuous monitoring across dozens of comparable assets, which is why most facilities find the payback period for their first phase of critical-asset coverage measured in months rather than years.
Secondary savings tend to accumulate once a program has been running for several quarters and are worth tracking separately from the headline avoided-failure figure. Reduced manual route labor, since technicians spend less time walking routes on assets already covered continuously, frees skilled labor for higher-value diagnostic work. Extended asset life from catching misalignment and imbalance early, before they accelerate bearing and coupling wear, shows up gradually in reduced parts spend rather than in a single dramatic event. Energy savings from correcting persistent imbalance and misalignment, both of which increase the mechanical load a motor has to overcome, are smaller individually but add up meaningfully across a large fleet of continuously running equipment.
Insurance and safety considerations round out the cost case for many facilities, particularly where a catastrophic motor or fan failure carries a genuine risk to personnel working nearby. Documented continuous monitoring programs are increasingly recognized by industrial insurers as a risk-reduction measure, and some facilities have negotiated more favorable terms after demonstrating a mature predictive maintenance program covering their most critical rotating assets.
Reliability Teams Ask
How is AI fault detection different from a standard FFT spectrum alarm?
A standard FFT alarm simply flags when an amplitude crosses a fixed threshold at a given frequency, which produces frequent false alarms on assets with naturally variable load or speed. AI-based fault recognition instead learns the normal operating envelope for each specific asset, correlates multiple frequency bands simultaneously, and classifies the actual fault type rather than a generic amplitude breach. This distinction is what allows the system to separate a real bearing defect from a harmless load-related vibration change. Teams that want to see this classification running on their own data can
book a demo.
What sensor hardware is required to start continuous vibration monitoring?
Most fleets start with triaxial MEMS or piezoelectric accelerometers mounted at the bearing housings on critical motors, pumps, and fans, wired or wireless depending on the plant's existing network infrastructure. Sampling rates and mounting locations are chosen based on the fault frequencies relevant to each asset's bearing geometry and running speed. Teams can review sensor placement guidance and existing infrastructure compatibility through
support before a rollout begins.
How accurate is remaining useful life prediction in practice?
Remaining useful life estimates improve significantly once a fault has progressed past the earliest detection stage, since the model then has an established trend rate to extrapolate from rather than a single data point. Early-stage estimates are intentionally conservative and widen as more historical failure data accumulates for that specific asset class within the fleet. Most reliability teams treat the estimate as a planning window rather than an exact date, using it to schedule parts and labor rather than to predict a precise failure hour.
Can this replace our existing vibration analyst entirely?
No, continuous AI monitoring is designed to extend an analyst's coverage rather than remove their judgment from the process, since complex or ambiguous fault patterns still benefit from expert review before a major repair decision is made. What changes is the volume of routine screening the analyst has to perform manually, freeing their time for the assets actually flagged as unsatisfactory or unacceptable. The combination of continuous screening and expert review consistently outperforms either approach running alone.
How quickly can a facility roll this out across its motor and pump fleet?
A phased rollout starting with the highest-criticality assets, typically the ten to twenty machines whose failure would stop production, can be sensor-equipped and generating baseline data within the first few weeks. Full fleet coverage across hundreds of motors, pumps, and fans is usually completed in phases over one to two quarters, prioritized by criticality and failure history. Facilities can discuss a phased rollout plan by reaching out through
support.
VIBRATION INTELLIGENCE · MOTORS · PUMPS · FANS
Stop Walking Routes. Start Listening Continuously.
Give your reliability team a live severity-ranked view of every rotating asset in the fleet.