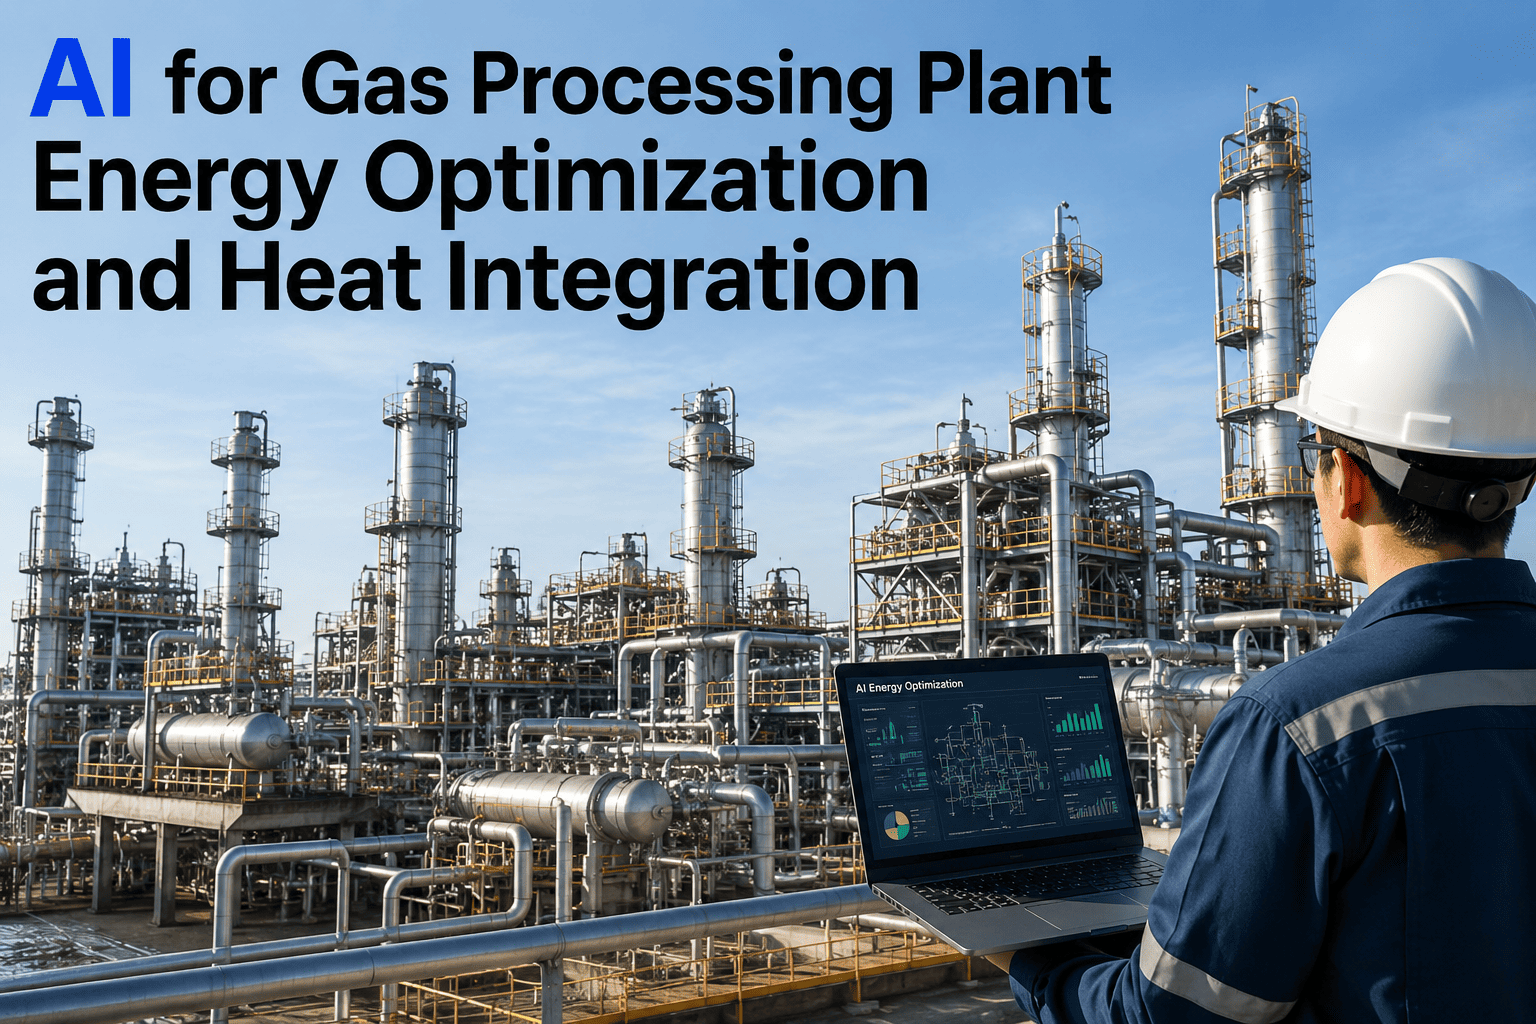
A gas processing plant burns fuel gas around the clock to keep fired heaters, reboilers, and compressors running, and most of that energy spend is never questioned because it has always been that way. Somewhere in the process there is a hot stream being air-cooled next to a cold stream being fired from scratch — two problems solving each other, sitting a hundred feet apart, unnoticed for a decade. iFactory's energy optimization AI finds those matches automatically and keeps finding them as the plant's operating envelope shifts week to week.
Every Degree of Wasted Heat Is a Fuel Gas Invoice You Didn't Have to Pay
Documented AI-driven heat integration and dynamic optimization programs have cut overall plant energy intensity by 15-25%, without a single new heat exchanger being installed in the first ninety days.
Why Gas Plants Leave So Much Energy on the Table
A gas processing plant is a network of hot and cold streams — inlet gas needing to be chilled, reboiler bottoms needing heat, amine solution needing regeneration temperature, glycol needing reconcentration. Every one of those streams was matched against an exchanger network designed years ago, for a feed composition and throughput that has since changed. Debottlenecking projects add equipment. Turnarounds change tube bundles. Nobody goes back and re-runs the pinch analysis, because pinch analysis is a specialist exercise that takes weeks and produces a report that sits on a shelf the moment operating conditions shift again.
The result is a plant that is thermodynamically sound on paper and quietly inefficient in practice — trim coolers rejecting heat that a nearby reboiler could use, fired heaters carrying more duty than the current feed slate requires, and a fuel gas system compensating for all of it without anyone noticing until the monthly energy report lands.
Map every hot and cold stream
AI ingests live temperature, flow, and composition data from every exchanger, heater, and cooler on the unit — not the design basis from ten years ago, but what is actually flowing through the plant right now.
Run continuous pinch analysis
Instead of a one-time study, the model recalculates the pinch point and minimum utility targets every time feed composition, ambient temperature, or throughput shifts meaningfully — surfacing new integration opportunities as they appear.
Rank opportunities by payback
Each identified gap — a stream pairing, a heater setpoint, a bypass valve position — is ranked by fuel gas savings against implementation cost, separating free operating changes from capital exchanger projects.
Push setpoints to the operator
No-cost changes — heater firing rate, exchanger bypass position, reflux ratio — are surfaced as recommended setpoint adjustments the control room can act on the same shift, not a report for next quarter's planning meeting.
Track savings against a live baseline
Every implemented change is measured against a rolling energy-intensity baseline, so the plant can see exactly how many MMBtu/hr of fuel gas each recommendation actually saved, not just what a simulation predicted.
Fired Heater Loading: The Single Biggest Lever Most Plants Never Touch
Fired heaters are usually run to a fixed outlet temperature setpoint that was chosen once, conservatively, and never revisited. That conservatism is expensive. Every degree of excess firing above what the downstream process actually needs is fuel gas converted directly into flue gas losses, with nothing to show for it on the process side.
| Optimization Lever | Typical Baseline Practice | AI-Optimized Practice | Fuel Gas Impact |
|---|---|---|---|
| Fired heater outlet temperature | Fixed conservative setpoint | Dynamically adjusted to downstream process need | 3-6% reduction in heater duty |
| Excess air / O2 trim | Manually checked monthly | Continuously trimmed against combustion efficiency curve | 1-3% combustion efficiency gain |
| Heat exchanger network routing | Static design-basis routing | Re-matched against live pinch analysis | 4-8% reduction in utility duty |
| Reboiler duty vs reflux ratio | Fixed reflux, reactive adjustment | Jointly optimized against separation target | 2-5% reduction in reboiler steam |
| Air cooler fan staging | All fans running or simple on/off | Staged against ambient temperature and duty need | 10-20% reduction in cooler power draw |
Heat Integration in Practice: A Composite Amine Unit Scenario
Consider a gas plant running a standard amine treating train alongside a glycol dehydration unit. For years, the lean amine cooler has been running its fans near full speed to hit a fixed lean amine temperature, while forty meters away the glycol reboiler fires harder than the current water content in the gas actually requires, because the setpoint was fixed during a wetter feed period two summers ago. Neither system talks to the other, and neither operator has a reason to question a setpoint that has "always worked."
An AI optimization layer sees both systems as part of the same energy balance. It identifies that the lean amine cooler is rejecting more heat than necessary for the current circulation rate, and that the glycol reboiler's excess duty is compensating for a water content that dropped when a wellhead separator was upgraded eight months earlier — a change nobody connected to the reboiler setpoint because they happened in different departments, on different timelines, without a shared owner. Correcting both setpoints together, without touching a single piece of equipment, reduces combined fuel gas and cooler power draw measurably within the first week, and the recommendation keeps re-checking itself every time feed water content shifts again.
Your Fuel Gas Bill Is Telling You Something Your P&ID Can't
iFactory maps every hot and cold stream in your plant, finds the matches your design basis missed, and keeps finding new ones as conditions change.
Ambient Conditions Change the Math Every Single Day
A gas plant's optimal setpoints in July are not its optimal setpoints in January, and most control philosophies were never built to shift with the season. Air cooler performance swings with ambient temperature, fired heater efficiency shifts with combustion air density, and compressor discharge targets move with suction conditions that themselves depend on the weather. A fixed operating philosophy averages across all of it, which means it is wrong on both the hottest and coldest days of the year, and only approximately right the rest of the time.
Continuous optimization treats ambient temperature as an input rather than an inconvenience. On a cool morning, air cooler fans can often be staged down without losing target outlet temperature, cutting power draw during exactly the hours a fixed setpoint would keep every fan running. On a hot afternoon, the same system recognizes that heater duty needs to increase earlier than a static schedule would trigger it, avoiding the brief off-spec excursions that come from reacting to temperature after the fact rather than ahead of it. Neither adjustment requires new equipment — both require a model that is watching the weather as closely as it watches the process.
What a Continuous Energy Optimization Program Actually Measures
The core plant-wide metric, tracked continuously rather than reconstructed once a month from meter readings. A falling trend line, adjusted for feed and ambient conditions, is the clearest sign the program is working.
Combustion efficiency and stack loss, tracked against excess air and firing rate, isolates how much of the intensity gain is coming from the heaters specifically versus the broader heat integration network.
Steam, fuel gas, and power consumption broken out by processing train exposes which unit is dragging the plant-wide average down and where the next optimization pass should focus.
How often operators act on AI-suggested setpoint changes versus overriding them tells you whether the recommendations are trusted and whether operator feedback needs to be folded back into the model.
Why This Isn't a One-Time Energy Audit
A traditional energy audit is a snapshot — a team spends two weeks on site, produces a report ranking savings opportunities, and leaves. Six months later, feed composition has shifted, a new well has come online, ambient temperatures have swung with the season, and half the recommendations no longer apply cleanly. The audit wasn't wrong; the plant just kept moving after it was written.
Continuous AI optimization treats energy performance the way a control system treats pressure or level — as something to hold against a target in real time, not something to review annually. That distinction matters because the biggest energy losses in a gas plant are rarely a single dramatic inefficiency; they are dozens of small drifts accumulating between audits, each one individually unremarkable and collectively expensive.
The Losses That Never Show Up on a Single Meter
Most energy loss in a gas plant is distributed across dozens of small inefficiencies rather than concentrated in one obvious culprit, which is exactly why it survives standard reporting. A control loop that hunts slightly around its setpoint burns marginally more fuel than one that holds steady, but the difference never triggers an alarm. A trim cooler running its fans a notch harder than necessary costs a few kilowatts nobody bothers to chase. None of these individually justify an engineering study. Collectively, across a plant with hundreds of control loops and dozens of rotating utility assets, they add up to a meaningful share of the energy intensity gap between a plant's design efficiency and its actual operating efficiency.
This is the category of loss that continuous monitoring is built to catch, because it depends on volume and persistence rather than magnitude. A model watching every loop, every cooler, and every heater simultaneously can flag the cumulative pattern — dozens of loops each running a little hot, a little loose, or a little conservative — in a way that no single-point alarm or quarterly audit was ever designed to see.
Who Should Own the Program
Energy optimization works best as a joint effort between process engineering, who understands the thermodynamic constraints, and operations, who controls the setpoints day to day. Assigning it solely to process engineering produces recommendations that sit in a report; assigning it solely to operations produces reactive fixes without the underlying pinch analysis to guide them.
Realistic Review Cadence
Weekly review of flagged opportunities, rather than a quarterly deep dive, keeps the gap between identification and action short enough that recommendations still match current operating conditions when they're implemented. Quarterly reviews are still useful for capital project ranking, but should not be the only cadence for no-cost operating changes.
Common Mistake: Chasing Capital First
Plants often jump straight to costed exchanger and heater revamp projects because they feel more substantial than a setpoint change. In practice, the no-cost operating changes typically deliver a meaningful share of total available savings and should be captured first, both for the immediate return and because they clarify which capital projects are still worth pursuing afterward.
Common Mistake: Treating the Baseline as Fixed
An energy intensity baseline set once, at commissioning or during a single audit, becomes misleading as feed slate and ambient conditions shift across seasons. A rolling, condition-adjusted baseline is what makes month-over-month comparisons meaningful instead of noise.
Where Most Plants Should Start
Not every plant needs to begin with a full pinch analysis rebuild. The highest-return starting point is usually narrower and faster to stand up than that, which matters for getting a program approved without a long capital justification cycle.
Connect the historian first
Pull twelve to eighteen months of existing temperature, flow, and duty data before touching a single setpoint — the baseline itself often reveals the biggest gaps before any optimization runs.
Target the highest-duty fired heater
The unit's largest single fuel gas consumer is almost always where the first setpoint adjustment produces the most visible, defensible savings number for the next budget conversation.
Run the no-cost changes before the capital list
Setpoint and staging adjustments that require no maintenance window build the track record that makes the capital exchanger and revamp recommendations easier to fund later.
Set a rolling, condition-adjusted baseline
Compare month over month against a baseline that accounts for feed and ambient shifts, not a single fixed number from commissioning, or the reported savings will look noisier than they actually are.
What Changes When the Feed Slate Itself Shifts
Gas plants rarely run a single, unchanging feed composition for long. A new well comes online with different water and CO2 content, a gathering system reroutes volume from one field to another, or a seasonal production pattern shifts the ratio of associated gas to dry gas moving through the plant. Each of these changes the thermodynamic profile the original heat exchanger network and pinch analysis were designed around — and each one, individually, is too routine to trigger a full re-study, even though collectively they are exactly why a plant's actual energy performance drifts away from its design basis over time.
A continuous optimization model treats every feed shift as a new data point rather than an exception to investigate manually. When water content in the inlet gas rises, the model doesn't wait for someone to notice the glycol reboiler duty creeping up — it recalculates the target reboiler duty for the new water loading and flags the gap between target and actual immediately. That responsiveness is what separates a plant that stays close to its thermodynamic optimum through a changing feed slate from one that only rediscovers its inefficiency once a year, during the next scheduled energy audit.
Frequently Asked Questions
Does this require new heat exchangers or capital equipment?
No — the first wave of savings typically comes entirely from operating changes: fired heater setpoints, fan staging, reflux ratios, and exchanger bypass positions that are already available to adjust within the existing equipment envelope. Capital projects like new exchangers or heater revamps are identified separately and ranked by payback, so the plant can capture free savings immediately while evaluating longer-lead investments on their own timeline. Most plants see the majority of their first-year gains from these no-cost adjustments alone. Visit support for a breakdown of typical opportunity categories.
How is this different from a DCS advanced process control layer we already have?
Advanced process control typically optimizes a single unit against a local constraint — a column, a heater, a compressor — without visibility into the plant-wide energy balance. iFactory's optimization layer sits above individual unit controllers and looks across the whole plant for integration opportunities that span units, like the amine-and-glycol example, which no single unit's APC would ever see because the connection isn't within its control scope. The two systems complement each other rather than compete.
How quickly can we expect to see measurable energy savings?
Most plants see their first measurable reduction in fuel gas and utility consumption within the first thirty to ninety days, driven by no-cost setpoint recommendations that don't require a maintenance window or capital approval. The bigger structural gains from heat exchanger network re-matching and heater duty rebalancing typically build over two to three quarters as the model accumulates enough operating history to distinguish real opportunity from normal process variation. Book a demo to see typical timelines for a plant your size.
Can this integrate with our existing historian and DCS data?
Yes — iFactory connects to standard plant historians and DCS tag structures to pull live temperature, flow, pressure, and composition data without requiring new instrumentation in most cases. Where key streams lack instrumentation, the platform flags the gap so it can be prioritized rather than silently excluded from the optimization model, which keeps recommendations grounded in what the plant can actually measure and act on.
Does energy optimization ever conflict with production rate or product spec?
The optimization model is constrained by product spec and throughput targets before it ever touches an energy recommendation — it will not suggest a setpoint change that risks off-spec product or a rate cutback to save fuel gas. Energy savings are pursued within the operating envelope the plant defines, which means production and quality teams retain the final say on any constraint the model operates inside.
The Cheapest Fuel Gas Is the Gas You Never Had to Burn
iFactory turns your plant's own operating data into a continuously updated energy roadmap — no stale audit report, no guesswork on which setpoint actually moves the needle.