A cathodic protection system that is technically "on" is not the same as one that is actually protecting the pipe — rectifiers get set once at commissioning and rarely revisited, pipe-to-soil potentials drift as soil resistivity changes with the seasons, and interference from nearby structures goes unnoticed until a survey years later flags an under-protected segment. AI-based CP optimization changes that by continuously monitoring pipe-to-soil potentials and adjusting rectifier output before a segment ever drifts out of protection criteria, rather than waiting for the next scheduled survey to catch it. Here is how continuous CP optimization actually works and how to book a review with our pipeline integrity team for your system.
Flow Assurance Intelligence · Cathodic Protection
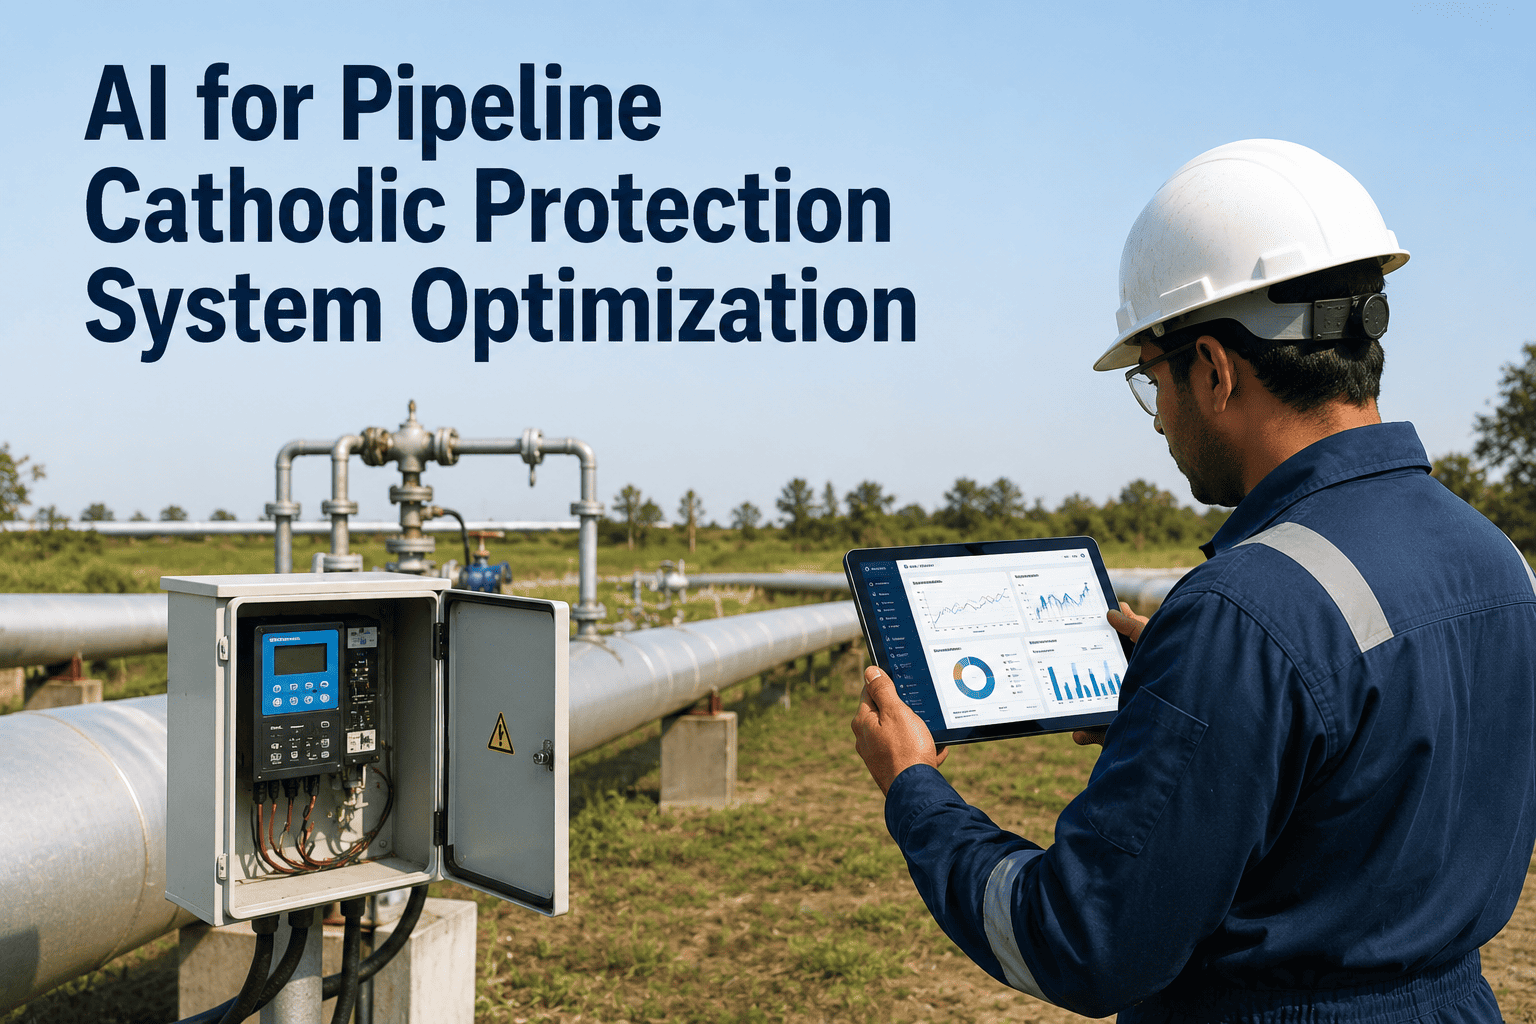
AI for Pipeline Cathodic Protection System Optimization
Continuous pipe-to-soil potential monitoring and automated rectifier, anode bed, and interference optimization — keeping every segment of the line inside protection criteria instead of finding out at the next survey.
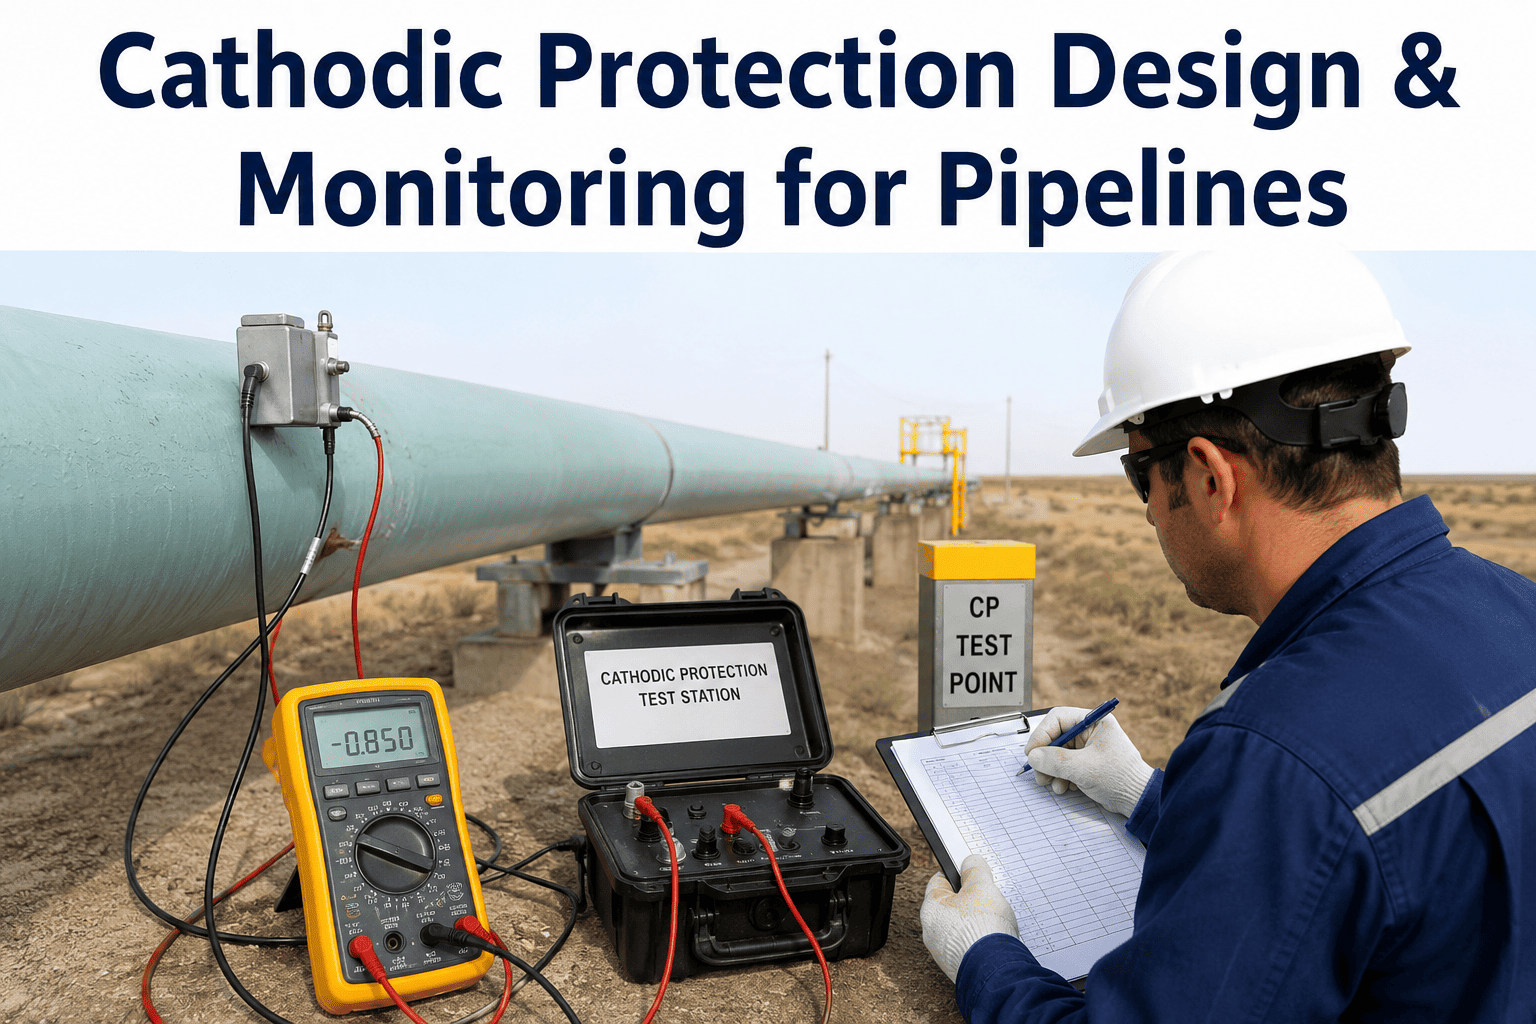
Pipe-to-Soil Potential
Continuous monitoring vs. periodic close-interval survey
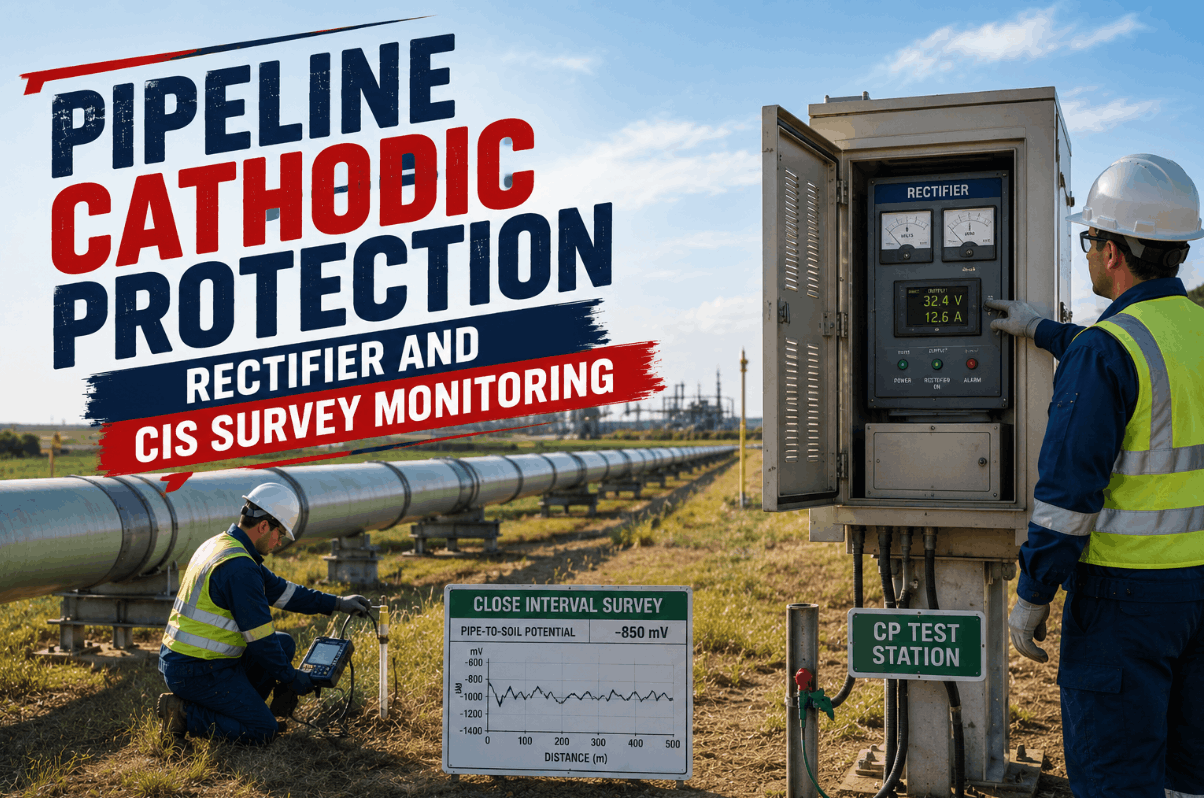
Rectifier Output
Automated tuning against real-time protection criteria
Anode Bed Performance
Trend-based degradation detection before failure
Interference Mitigation
Early flagging of AC/DC interference from nearby structures
The Underlying Problem
Why "Set and Forget" Rectifier Operation Under-Protects Pipe
A rectifier tuned to the right output at commissioning is only correct for the soil and interference conditions that existed at that moment — soil resistivity shifts with moisture and temperature, anode beds degrade at uneven rates, and new construction or transit systems nearby introduce interference that did not exist when the system was designed. Because most CP systems are only checked on a periodic survey cycle, a segment can sit outside protection criteria for months before anyone notices, and by the time it's caught, corrosion has already had that entire window to progress. Continuous monitoring closes that window from months to near real time.
Operating Model Comparison
Periodic Survey vs. Continuous AI-Optimized CP
| Dimension | Periodic Survey Model | Continuous AI Optimization |
|---|---|---|
| Detection window | Weeks to months between surveys | Near real time, typically within minutes |
| Rectifier adjustment | Manual, reactive to survey findings | Automated, continuous against protection criteria |
| Anode bed degradation | Identified after output drops noticeably | Flagged from early trend deviation |
| Interference detection | Often found only during dedicated interference testing | Continuously screened for anomalous potential swings |
| Compliance documentation | Point-in-time survey records | Continuous data trail supporting audit and regulatory review |
How It Works
From Sensor Reading to Rectifier Adjustment
01
Continuous Potential Reading
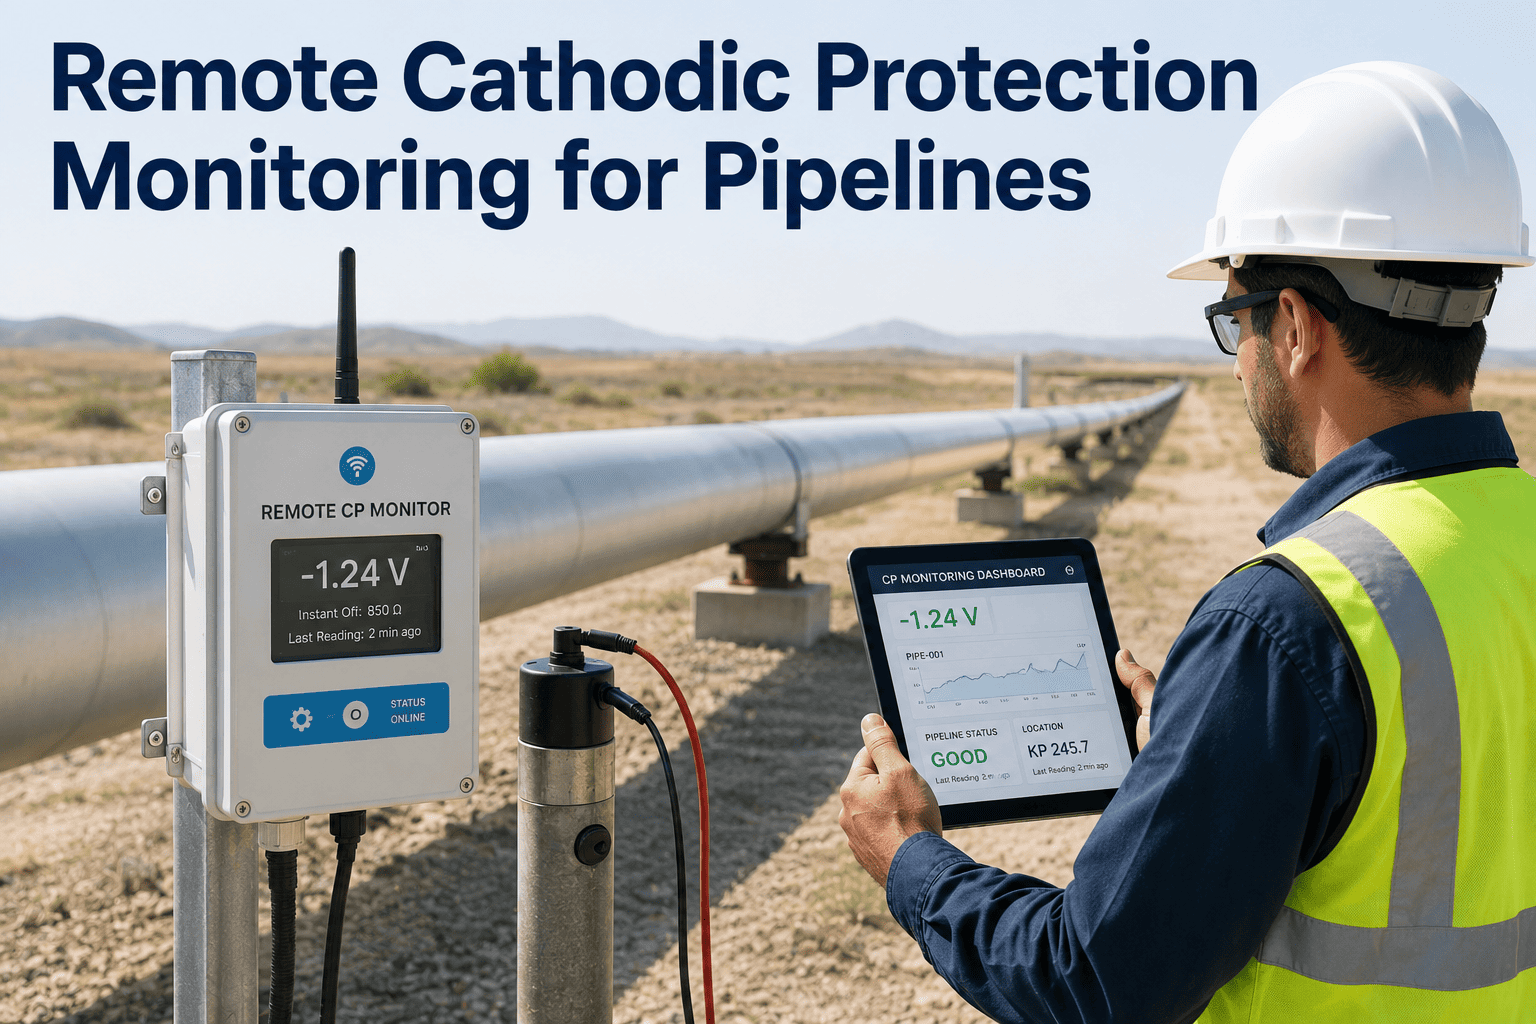
Remote monitoring units at test stations and rectifiers report pipe-to-soil potential readings continuously rather than during a scheduled technician visit alone.
02
Deviation Detection
The model compares incoming readings against protection criteria and historical baselines for that specific segment, flagging deviations before they become a compliance issue.
03
Root Cause Differentiation
The system distinguishes between a rectifier output issue, anode bed degradation, and external interference, since each requires a different corrective action.
04
Rectifier Output Adjustment
Where the rectifier is remotely controllable, output is adjusted automatically within approved operating limits; otherwise a work order is generated for field action.
Programme Metrics
What to Track as CP Optimization Matures
Segments Within Protection Criteria
Percentage of monitored segments continuously reading within target potential range, the primary integrity indicator for the whole system.
Mean Time to Deviation Detection
Time from a segment drifting out of criteria to the deviation being flagged — the metric that most directly reflects the shift from periodic to continuous monitoring.
Anode Bed Remaining Life Accuracy
How closely predicted anode bed degradation trends match actual field replacement timing, validating the model's degradation forecasting.
Interference Events Identified Pre-Survey
Number of interference conditions flagged by continuous monitoring before they would have otherwise surfaced during a dedicated interference test.
Regulatory Context
Where Continuous Monitoring Fits Into Existing Compliance Obligations
Pipeline operators already carry cathodic protection survey and record-keeping obligations under pipeline safety regulations, and those requirements are not replaced by continuous monitoring — but the data trail it produces tends to make demonstrating compliance considerably easier during an audit or regulatory inspection. Instead of pulling together isolated survey records from scattered dates to show a segment stayed within protection criteria, an operator with continuous monitoring can produce an unbroken data trail for the entire period in question, which is generally a stronger evidentiary position than point-in-time survey snapshots alone. This does not change what the regulation requires; it changes how completely an operator can demonstrate they met it.
Survey Frequency Requirements
Continuous monitoring does not eliminate required close-interval or annual survey cadences, but it substantially reduces the odds a survey turns up a surprise.
Record Retention
Continuous data logs provide a more complete retained record than periodic readings alone, supporting longer-term trend analysis during an audit.
Remediation Timelines
Earlier deviation detection means remediation actions can be initiated and documented well before a regulatory response deadline becomes a concern.
Find Out How Much of Your Line Is Already Drifting
Many operators are surprised by how many segments have drifted outside optimal protection criteria between scheduled surveys. A system review shows exactly where continuous monitoring would have caught it first.
Rectifier Optimization in Detail
How Output Adjustment Decisions Actually Get Made
Rectifier output optimization is not a matter of simply raising output whenever a potential reading looks marginal — over-protection carries its own risks, including coating disbondment from excessive current and unnecessary energy cost from running rectifiers harder than the segment requires. The model instead weighs the specific reading against the segment's historical baseline, soil resistivity conditions, and proximity to other rectifiers on the same system, since adjusting one rectifier's output can shift current distribution to adjacent segments in ways that are not obvious from a single test station reading in isolation. This system-level view is one of the harder things for a purely manual process to maintain consistently across a long pipeline with dozens of rectifiers, each interacting with its neighbors in ways that shift as soil and seasonal conditions change.
Applied Example
A Segment Drifting Out of Criteria Between Scheduled Surveys
Consider a pipeline segment that reads comfortably within protection criteria during its annual survey, but experiences a period of unusually dry soil conditions several months later that raises soil resistivity and reduces current output effectiveness from the nearest rectifier. Under a periodic survey model, this drift would go unnoticed until the next scheduled survey, potentially leaving the segment under-protected for months. With continuous monitoring, the potential reading crossing below the protection threshold gets flagged within the monitoring cycle, the model checks whether nearby segments show a similar pattern consistent with a soil condition change rather than a localized coating issue, and a rectifier output adjustment recommendation is generated — closing what would have been a months-long protection gap down to a matter of days.
Corrosion engineers are not short on knowledge about how CP systems should behave — they are short on visibility into how the system is actually behaving between survey cycles. I have seen rectifiers running an output setting that made sense five years ago, quietly under-protecting a segment the whole time, simply because nothing flagged the drift until the next scheduled survey caught it. Continuous monitoring does not replace the corrosion engineer's judgment about what a reading means — it just makes sure the reading gets to them the week it starts drifting, not the year it finally shows up as a coating disbondment finding.
Odalys Ferreira-Whitcombe
Pipeline Corrosion Control Specialist · 19 years in cathodic protection design, survey, and remote monitoring systems
CP Optimization Questions
Cathodic Protection AI — Frequently Asked
Do we need new remote monitoring hardware at every test station to use this?
Most systems can start with the test stations and rectifiers that already have remote monitoring units installed, then expand coverage over time — a full-line hardware retrofit is not required to begin. Book a review to assess your current monitoring coverage.
Can the system automatically adjust rectifiers, or does it only flag issues?
Where rectifiers are remotely controllable, output can be adjusted automatically within operator-approved limits; for rectifiers without remote control, the system generates a work order for a field technician instead. Contact support to confirm which mode fits your equipment.
How does the system tell the difference between a rectifier issue and outside interference?
The model correlates potential readings across multiple test stations and rectifiers along the segment, since a rectifier-specific issue produces a different spatial pattern than interference originating from a nearby structure or transit system. Book a demo to see a sample differentiation case.
Does this replace the close-interval survey requirement?
Continuous monitoring complements rather than replaces required close-interval surveys, but it substantially reduces the number of surprises found during a survey since drift is typically caught and corrected well before the survey date. Ask our team about how this fits your existing survey schedule.
How long does it take to see the system flag its first meaningful deviation?
Once monitoring units are connected and baseline readings are established for each segment, most operators see their first flagged deviation within the first few weeks of continuous operation. Book a call to scope a rollout timeline for your line.
Stop Finding Out About Drift at the Next Survey
iFactory continuously monitors pipe-to-soil potentials and optimizes rectifier output, anode bed performance, and interference mitigation — so protection criteria stay met, not just checked.