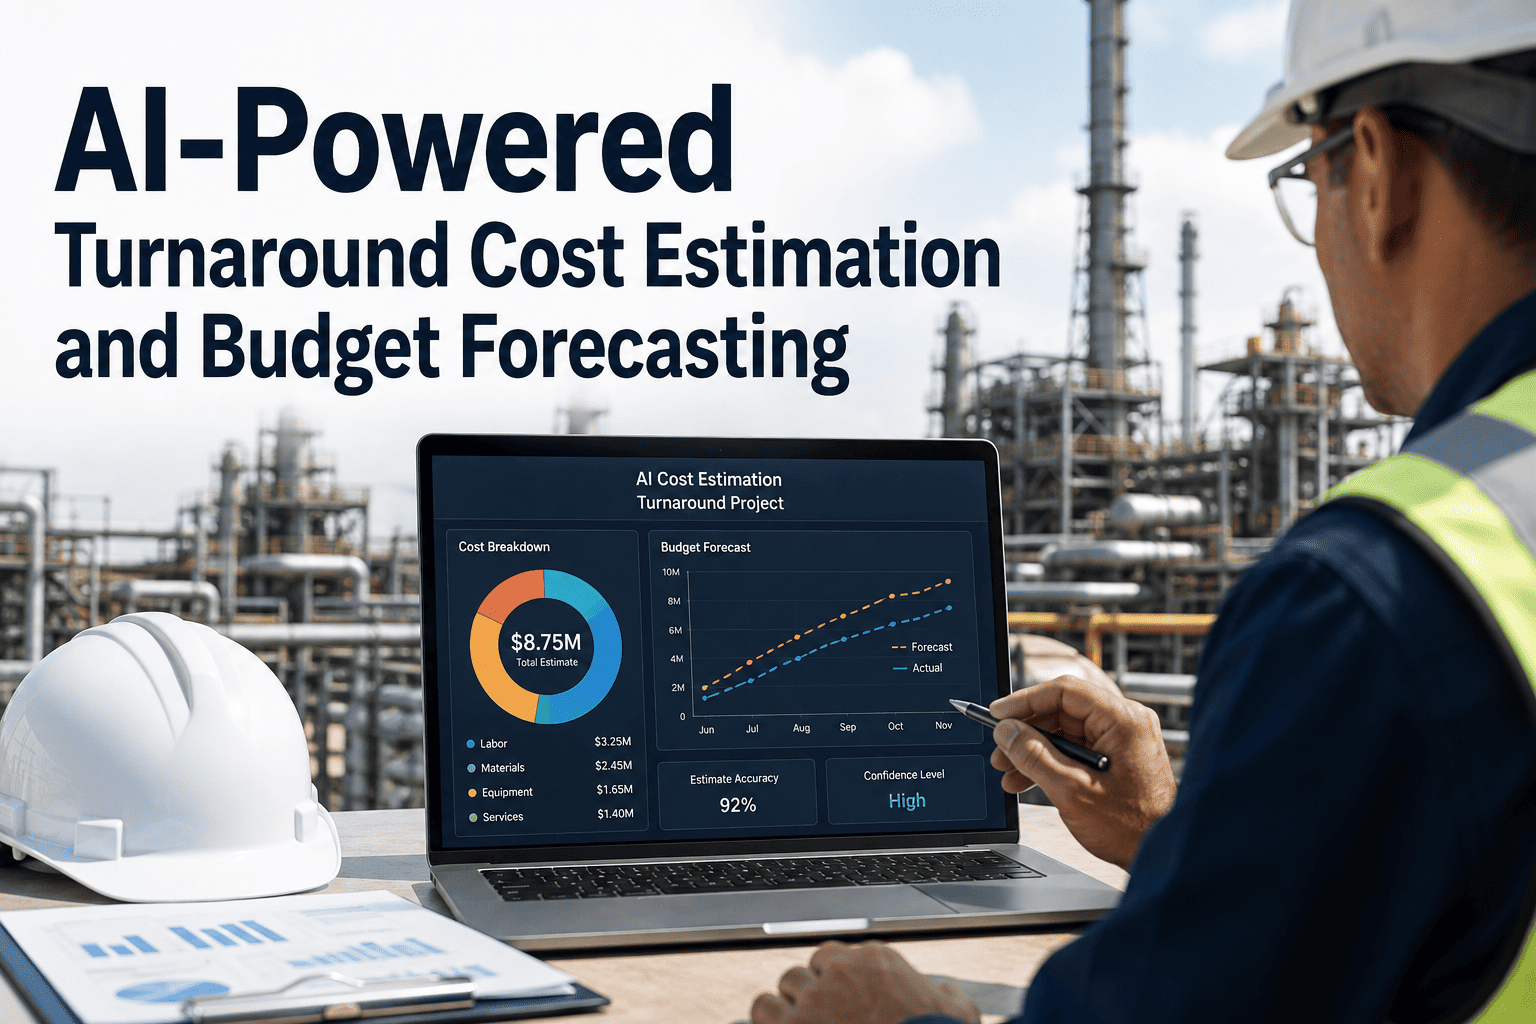
Turnaround budgets get built the same way at most refineries: pull last time's actual cost for a similar unit, add a contingency percentage that feels roughly right, and present it to leadership as a number with far more confidence than the method behind it deserves. When the final cost lands 25% or 30% over that estimate, which happens often enough that nobody's shocked anymore, the gap gets explained away as scope creep or unexpected findings rather than treated as a forecasting problem worth fixing. iFactory builds turnaround cost estimates from actual historical data instead of a rounded-up guess, and the estimation model is covered through iFactory support.
Turnaround Optimization · Budget Forecasting
Plus or Minus 30% Isn't a Budget. It's a Guess With a Number Attached.
iFactory predicts turnaround costs by analyzing historical TAR data, scope complexity, labor rates, and material requirements, tightening budget accuracy from the industry-typical +/-30% range toward +/-10%.
Where the Estimate Actually Breaks
Four Reasons Turnaround Budgets Consistently Miss
Scope Grows After the Estimate Is Locked
Inspection findings during the TAR itself add work that the original budget, built before the unit was even opened, had no way to account for.
Historical Data Isn't Actually Comparable
"Similar unit, last time" estimates often ignore real differences in scope size, contractor mix, and equipment condition between the two turnarounds being compared.
Labor Rate Assumptions Go Stale
Contract labor rates shift between estimate and execution, especially when a TAR is scheduled during a season with high regional demand from competing facilities.
Material Lead Times Get Underestimated
Long-lead items priced early in planning often see cost escalation by the time they're actually procured, a gap that flat estimates rarely build in.
Where the Money Typically Goes
Rough Cost Category Weight on a Typical Process Unit Turnaround
A 30% Miss on a $40 Million Turnaround Isn't a Rounding Error. It's a Number Leadership Remembers.
iFactory builds estimates from your own historical TAR data and current scope complexity, so the number you present is defensible, not just familiar.
How a Prediction Gets Built
From Scope Definition to a Defensible Budget Number
1
Scope is loaded and categorized. Planned work orders are classified by type and compared against similar categories from prior turnarounds rather than treated as entirely novel.
2
Historical costs are normalized. Past TAR spend is adjusted for scope size differences and inflation, so comparisons reflect true cost-per-scope-unit rather than raw historical totals.
3
Current labor and material data is applied. Live contract labor rates and current material pricing replace assumptions carried forward from the last estimate.
4
A contingency range is calculated, not assumed. Contingency reflects the actual historical variance for similar scope categories rather than a flat percentage applied to every line item.
5
The estimate updates as scope firms up. As inspection findings and final work orders are confirmed closer to execution, the budget forecast tightens rather than staying fixed at the original planning-phase number.
Who Actually Uses This Number
A Tighter Estimate Serves Several Audiences at Once
Finance and capital planning need a budget precise enough to commit against without building in a large unofficial buffer that distorts the facility's broader capital plan.
TAR planning teams use a defensible estimate to justify scope decisions and contractor selection earlier in the planning cycle, rather than scrambling to trim scope once actual costs start running hot.
Plant leadership and the board see fewer surprise variance reports, which over time changes how much scrutiny every future turnaround budget gets before it's approved.
Applied Example
Bringing a Refinery's Budget Variance From 28% Down to 9% in One Cycle
A mid-sized refinery's most recent three turnarounds had each landed between 22% and 31% over the initial budget estimate, a pattern the planning team had come to treat as more or less normal for the facility. Using iFactory to build the estimate for their next scheduled TAR, the model flagged that historical cost comparisons had consistently understated inspection-driven contingency work for that specific unit type, and that regional contract labor rates used in prior estimates were pulled from data nearly a year old by the time execution began. Rebuilding the estimate with normalized historical scope data and current labor rates produced a budget that came in within 9% of final actual cost, the tightest variance the facility had recorded in over five years of tracked turnarounds. The finance team, which had historically padded its own internal capital reserve for that unit's turnarounds by an additional 15% on top of the planning estimate as an unofficial hedge, was able to drop that informal buffer for the following cycle once the underlying estimate itself had proven reliable, freeing that capital for other planned maintenance capital projects that year.
28% → 9%Budget variance improvement in one cycle
3 prior TARsUsed to normalize historical scope data
5 yearsTightest recorded variance in facility history
Typical Outcomes
What Improves When Turnaround Budgets Are Built From Real Data
+/-30% → +/-10%
Typical Budget Accuracy Improvement Range
Defensible
Cost Basis for Leadership and Board Reporting
Tightening
Forecast as Scope Firms Up Pre-Execution
Getting Started
What to Pull Together Before Building Your Next Estimate
Gather actual cost breakdowns from your last three to five turnarounds, by category rather than just the final total, so the model has real variance data to learn from.
Confirm current contract labor rates for your region and craft mix, rather than relying on rates carried forward from the last planning cycle.
Flag any long-lead materials already identified for the upcoming scope, so escalation risk on those items is captured early rather than discovered during procurement.
Decide who owns reviewing the generated estimate before it goes to leadership, so the number carries both the model's analysis and your team's site-specific judgment.
Frequently Asked Questions
Turnaround Cost Estimation — Common Questions
How much historical turnaround data do we need for this to be accurate?
Three to five prior turnarounds on comparable units generally provide enough historical basis for a meaningful normalized estimate, though the model can still add value with less history by leaning more heavily on current labor rate and scope complexity inputs. Accuracy improves with each additional cycle as more actual-versus-estimate data feeds back into the model.
Book a Demo to review what your available TAR history can support.
Can this handle a turnaround scope that's meaningfully different from anything we've done before?
Yes, though accuracy depends on how the new scope is categorized against historical work order types rather than requiring an identical past turnaround to exist. Novel scope items are estimated using the closest comparable historical categories combined with current market data, and the model's confidence range widens appropriately where true precedent is limited.
Does the estimate update once the turnaround is underway and inspection findings come in?
Yes — as confirmed work orders and inspection-driven scope additions are logged during execution, the forecast recalculates to reflect actual conditions rather than remaining fixed at the pre-turnaround planning number, giving finance and leadership a running view of projected final cost rather than a single static figure.
Contact support to see how live updates are configured.
How does this integrate with our existing TAR planning and cost tracking systems?
iFactory connects with commonly used turnaround planning and cost management platforms to pull existing scope, work order, and historical cost data rather than requiring your team to re-enter information already tracked elsewhere. Where a facility relies primarily on spreadsheets for cost tracking, the platform can also ingest that data directly as a starting point.
Who typically owns reviewing and presenting the resulting cost estimate?
The turnaround planning team or TAR manager typically owns reviewing the generated estimate before it goes to leadership, using it as a defensible starting point rather than a number that replaces their own judgment about site-specific factors the model may not fully capture.
Book a Demo to see the estimate review workflow.
Stop Presenting a Turnaround Budget That Everyone Already Expects to Miss.
See how iFactory builds cost estimates your leadership can actually rely on.