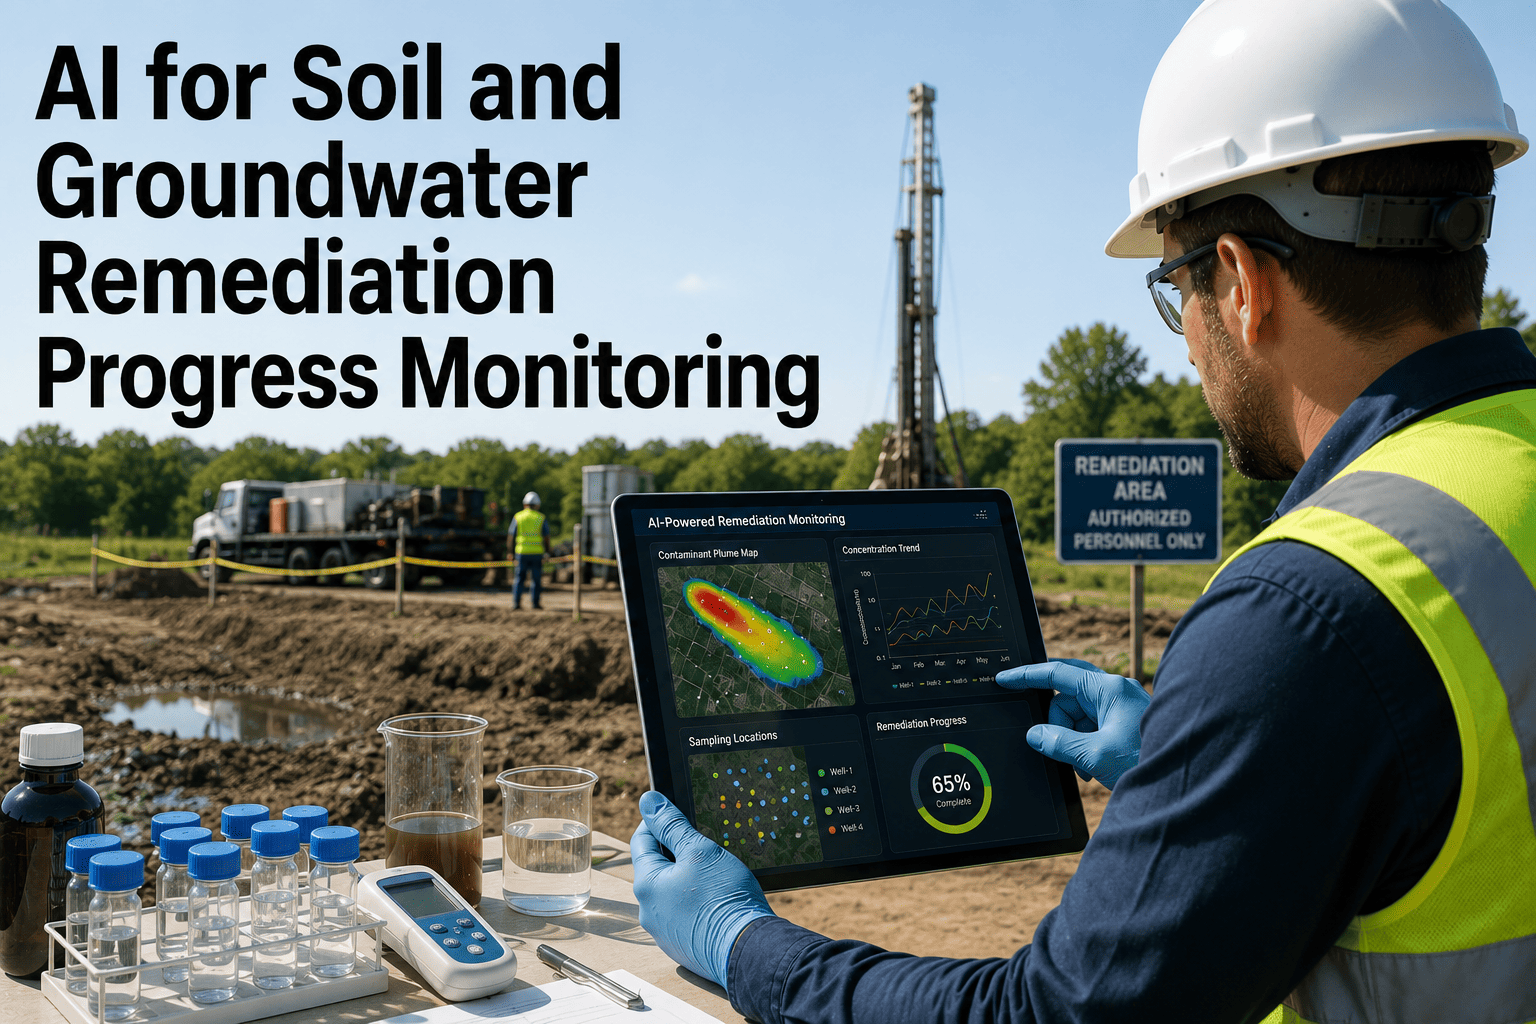
Every quarter, a remediation team pulls samples from a network of monitoring wells, ships them to a lab, and waits two to four weeks for results that describe conditions that existed a month earlier. By the time the report lands on a project manager's desk, the plume has already moved, a treatment system may already be running past the point where it's adding value, and a closure opportunity that could have been flagged sooner has quietly slipped by another quarter. This lag isn't a choice anyone made deliberately — it's simply what happens when a continuously changing subsurface system is reviewed on a fixed, infrequent schedule. Visit iFactory's support page to see how a remediation team typically connects its existing monitoring data into a system that reviews trends every day instead of every ninety.
Your Cleanup Data Already Holds the Answer — It's Just Sitting in a Quarterly Report
A monitoring well network generates a steady stream of concentration, geochemical, and hydraulic data. Most of it gets filed after a compliance check and never analyzed for the trend it's actually showing. AI reads that same data every day and tells you where the plume is headed before the next sampling round even ships.
Why Quarterly Sampling Was Never Built to Track a Moving Plume
Groundwater and soil remediation monitoring exists to answer one question repeatedly over the life of a site: is the contamination moving toward the cleanup target, or away from it? For most sites, that question gets answered on a fixed compliance calendar — quarterly, semi-annual, sometimes annual — because that's what the regulatory sampling and analysis plan requires, and lab turnaround makes anything faster impractical to do by hand. The result is a monitoring program that satisfies the regulator but tells the project team almost nothing about what happened in the ninety days between reports, which is exactly the window where a rebound trend, a stalled attenuation rate, or a plume redirecting around an old treatment zone actually needs to be caught. Over the life of a multi-year remediation program, that gap compounds — a treatment system can keep running months past the point it stopped adding value, or a site that genuinely qualifies for closure can sit under active management for an extra reporting cycle simply because nobody reviewed the trend early enough to make the case.
The Compliance-Only Trap
Sampling data gets collected specifically to satisfy a regulatory exceedance check, then archived once the report is filed. The same numbers could reveal a slow rebound or an accelerating attenuation rate months earlier, but nobody is running that analysis unless a consultant is specifically tasked and paid to do it.
The Reactive Review Problem
Because review happens only when a new report is due, a genuine change in plume behavior is discovered on the same schedule as routine, no-change data — there's no mechanism that surfaces the concerning trend sooner than the boring one, even when the concerning trend has real cost and liability consequences.
The Data an AI Remediation Monitor Actually Reads
A digital monitoring layer doesn't replace the monitoring well network or the lab — it replaces the manual step where someone has to remember to compare this quarter's numbers against the last six quarters, across every well, every analyte, and every geochemical indicator at once. That comparison is exactly the kind of pattern-matching across large, structured datasets that a model handles continuously, at a scale no single reviewer can sustain across a multi-well, multi-year site record. Most of the underlying data already exists in a LIMS export, a field data logger, or an environmental database maintained by the site's consultant — the work is in pulling it into one continuously updated place rather than collecting anything new.
| Data Source | What It Tracks | Why AI Needs It |
|---|---|---|
| Well Concentration Data | Contaminant of concern levels at each monitoring point over time | Establishes the trend line every closure decision is ultimately measured against |
| Geochemical Indicators | Dissolved oxygen, oxidation-reduction potential, ferrous iron, sulfate, methane | Confirms whether natural attenuation is genuinely active or the concentration drop has another cause |
| Water Level & Gradient | Hydraulic head across the well network and the resulting flow direction | Distinguishes real plume migration from apparent movement caused by a shifting flow path |
| Daughter Product Ratios | Breakdown compounds produced as parent contaminants degrade | Verifies that a declining parent concentration reflects degradation rather than dilution or sampling variability |
| Treatment System Data | Extraction rates, injection volumes, runtime hours for active remediation equipment | Connects operational performance directly to the concentration trend it's supposed to be driving |
Five Lines of Evidence AI Cross-Checks for Natural Attenuation
A falling contaminant concentration on its own is not proof that natural attenuation is happening — it could just as easily reflect dilution, a shift in groundwater flow, or a sampling inconsistency. Regulatory guidance on monitored natural attenuation calls for multiple independent lines of geochemical evidence pointing the same direction before a declining trend is accepted as genuine degradation, and checking all of them together, every reporting cycle, is precisely the kind of cross-referencing work that benefits from continuous automated review.
A drop in dissolved oxygen near the plume core indicates microbial activity is consuming oxygen as it breaks down the contaminant, one of the earliest signals of active biodegradation.
A shift toward negative oxidation-reduction potential shows the subsurface has moved into the anaerobic conditions under which many chlorinated solvent degradation pathways actually proceed.
An increase in dissolved ferrous iron reflects iron-reducing bacteria at work, a well-established indicator that microbial degradation processes are active in the treatment zone.
Declining sulfate paired with rising methane marks the deeper anaerobic stages of degradation, confirming the plume has progressed rather than merely stalled at an earlier breakdown step.
Stop Waiting for the Next Report to Find Out the Plume Moved
iFactory connects your existing monitoring well, geochemical, and treatment system data into one continuously updated view — so a rebound trend gets flagged the week it starts, not the quarter it's confirmed.
From Characterization to Closure: Where Continuous Monitoring Fits
A remediation site moves through distinct phases, and the value of continuous data review looks different at each one. Understanding where a site actually sits in this lifecycle is what determines whether the priority is catching an early warning sign or confirming readiness for regulatory closure.
Site Characterization
Initial well installation and baseline sampling establish plume boundaries, source concentrations, and hydrogeologic conditions — the reference point every later trend gets measured against.
Active Remediation
Pump-and-treat, in-situ chemical oxidation, or enhanced bioremediation systems run to actively reduce contaminant mass, with system performance data needing to be checked against concentration trends far more often than a quarterly report allows.
Monitored Natural Attenuation
Once active treatment has reduced mass sufficiently, the site transitions to relying on natural degradation processes, tracked through the geochemical lines of evidence and periodic concentration sampling described above.
Closure & No Further Action
A sustained trend meeting the site-specific cleanup target across multiple consecutive sampling events supports a closure or no-further-action determination, provided the trend can be demonstrated consistently rather than assumed from a single favorable quarter.
Manual Quarterly Review vs. Continuous AI Trend Monitoring
The underlying data — well concentrations, geochemical indicators, treatment system logs — is largely the same in both approaches. What changes is how often it actually gets analyzed, and how much of the analysis depends on one reviewer remembering to look for a specific pattern across dozens of wells and years of history.
| Aspect | Manual Quarterly Review | Continuous AI Monitoring |
|---|---|---|
| Review Frequency | Tied to the sampling and reporting schedule, typically 90+ days apart | Every time new data lands, regardless of the formal reporting cadence |
| Trend Detection | Depends on a reviewer manually comparing the current round against prior rounds | Statistical trend analysis run automatically across every well and analyte |
| Cross-Referencing Evidence | Geochemical indicators often reviewed separately from concentration data, if at all | Concentration, geochemical, and hydraulic data checked together as one signal set |
| Rebound Detection Speed | Confirmed only once it shows up clearly across two or more sampling rounds | Flagged as an early deviation the first time the trend line changes direction |
| Closure Readiness | Assessed at the next scheduled report, whenever that falls | Assessed continuously against the site-specific cleanup target |
What Changes When Monitoring Becomes Continuous
The figures below reflect the kind of operational shift environmental teams report after moving from a purely report-cycle review process to a continuously updated monitoring view of the same underlying well network data. None of this requires a new well, a new lab contract, or a new sampling plan — the shift comes entirely from reviewing the data that's already being collected on a schedule that matches how the subsurface actually behaves, rather than how the reporting calendar happens to be structured.
A concentration trend reversing direction gets flagged as soon as the first deviating data point arrives, rather than waiting for a second sampling round to confirm what a continuous trend line already showed.
Wells showing a consistently stable, well-established trend can be sampled on a longer interval, while wells showing early signs of deviation get prioritized for closer attention.
Continuous trend confirmation against the cleanup target means a site that's genuinely ready for no-further-action status doesn't sit waiting on an extra reporting cycle to prove it.
Trend charts, statistical summaries, and lines-of-evidence comparisons that used to be assembled manually each quarter are already current and ready to drop into the regulatory submission.
Common Mistakes When Automating Remediation Monitoring
Moving from manual to continuous review introduces its own failure modes, and most of them come from treating the automated layer as a replacement for hydrogeologic judgment rather than a way to apply that judgment more consistently and more often.
Trusting Concentration Trends Alone
Flagging a declining concentration as attenuation without checking the geochemical lines of evidence risks mistaking dilution or a flow-path shift for genuine degradation, which can undermine a closure argument later.
Ignoring Seasonal Water Table Noise
Concentration and water level data both shift with seasonal recharge and drawdown; a system that doesn't account for this can flag routine seasonal variation as a false trend deviation.
Setting Trend Thresholds Without Site Context
A generic statistical threshold applied uniformly across every well ignores that different aquifer conditions and contaminant types have genuinely different expected variability, producing either too many false alarms or missed real ones.
Removing the Hydrogeologist From Review
An automated flag is a starting point for expert review, not a final determination — regulatory closure decisions still rest on a qualified professional's interpretation of what the data means for that specific site.
Who Should Own Continuous Monitoring Inside a Remediation Program
Remediation programs typically span an environmental consultant running the day-to-day monitoring, an internal environmental or EHS manager accountable for the site's regulatory standing, and sometimes a legal or risk team tracking liability exposure across a broader portfolio of sites. A continuous monitoring layer touches all three, and a rollout that only serves one of them tends to stall once the others don't see how it fits their own reporting needs.
Environmental Consultant / Hydrogeologist
Owns the technical interpretation — validating trend flags against site-specific hydrogeologic conditions, confirming lines of evidence for natural attenuation, and translating flagged deviations into an actual recommendation for the site.
Internal Environmental / EHS Manager
Uses the continuously updated trend view to track program status across a portfolio of sites at once, prioritize which sites need budget or attention this quarter, and walk into a regulatory conversation with current data rather than a report that's already a season old.
Getting both roles looking at the same continuously updated data, rather than one working from a live dashboard and the other still waiting on a quarterly PDF, is usually what determines whether a monitoring upgrade actually changes how decisions get made — or just becomes another report format nobody has time to read differently than the last one.
Frequently Asked Questions
Does AI monitoring replace the existing monitoring well network or lab sampling program?
No. The well network and the laboratory analysis program remain exactly as they are, since both are typically fixed by the regulatory sampling and analysis plan governing the site. What changes is how quickly and how thoroughly that same data gets reviewed once results come back, and how consistently every geochemical indicator gets cross-checked against the concentration trend rather than reviewed in isolation. Visit support to see how a typical data connection into an existing monitoring program is structured.
Can this reduce how often a site needs to be physically sampled?
In many cases, yes, though the decision ultimately depends on the regulatory framework governing the site. A well showing a long, consistently stable trend with strong supporting geochemical evidence is often a stronger candidate for a reduced sampling frequency request than one where variability hasn't been fully characterized, and continuous trend data gives that request a more complete evidentiary basis. Book a demo to see how trend history gets summarized for a sampling frequency reduction submission.
How does the system distinguish a genuine rebound from normal sampling variability?
Statistical trend analysis compares each new result against the established variability range for that specific well and analyte, rather than against a single prior data point. A genuine rebound shows up as a sustained directional shift across the geochemical indicators together, not just one concentration reading moving slightly higher, which is what separates a real signal from routine noise in the data.
What natural attenuation data does the system need to get started?
Historical well concentration data, geochemical parameters where they've been collected, and basic site information such as contaminant type and cleanup target are the baseline inputs. Sites with a longer sampling history and more complete geochemical records get a more reliable trend picture from day one, though the system continues refining that picture as new sampling rounds are added over time. Contact support for a walkthrough of typical data requirements.
Does this work across multiple contaminants and remediation technologies at the same site?
Yes. Many sites are managing more than one contaminant of concern and may be running active treatment in one area while another has already transitioned to monitored natural attenuation. The monitoring layer tracks each well, analyte, and treatment zone against its own relevant trend and target rather than applying one uniform view across a site that's actually in several different remediation phases at once.
Know Where the Plume Is Headed Before the Next Report Confirms It
iFactory turns your monitoring well, geochemical, and treatment system data into a continuously updated remediation trend view — so closure decisions rest on daily evidence, not a quarterly snapshot.
-for-offshore-environmental-monitoring.png)