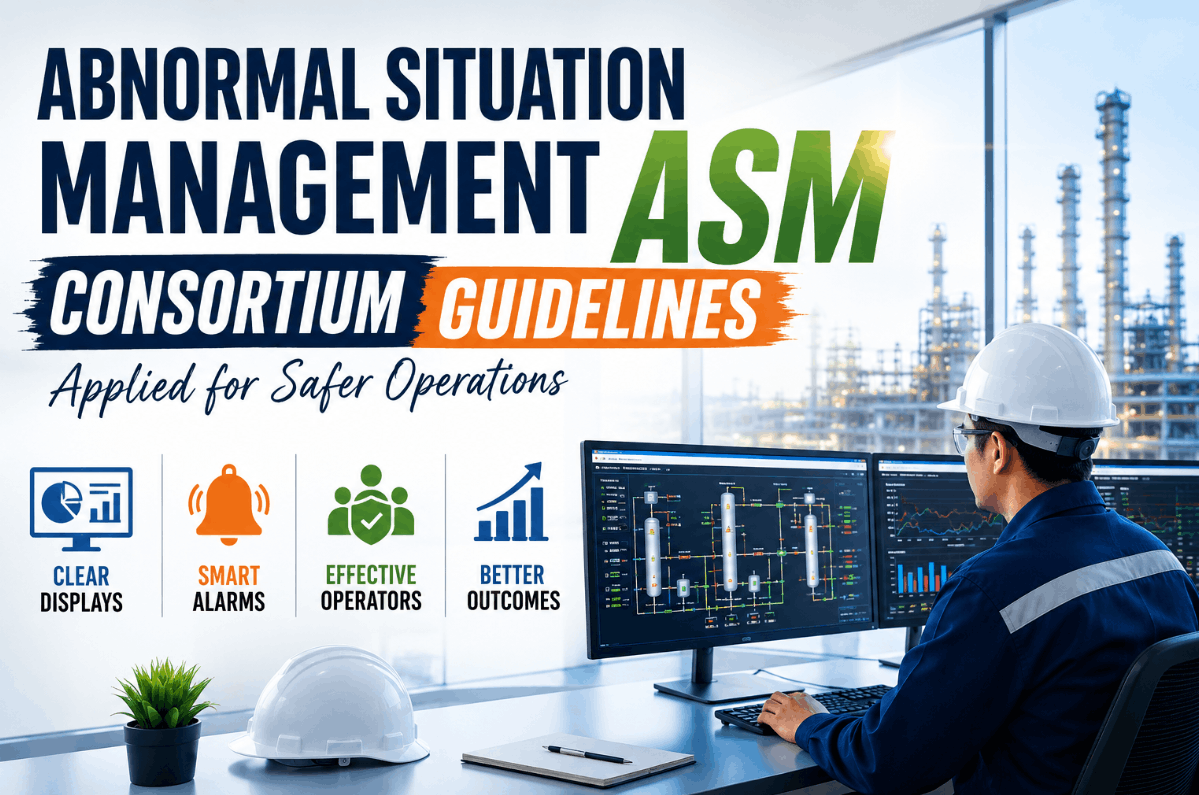
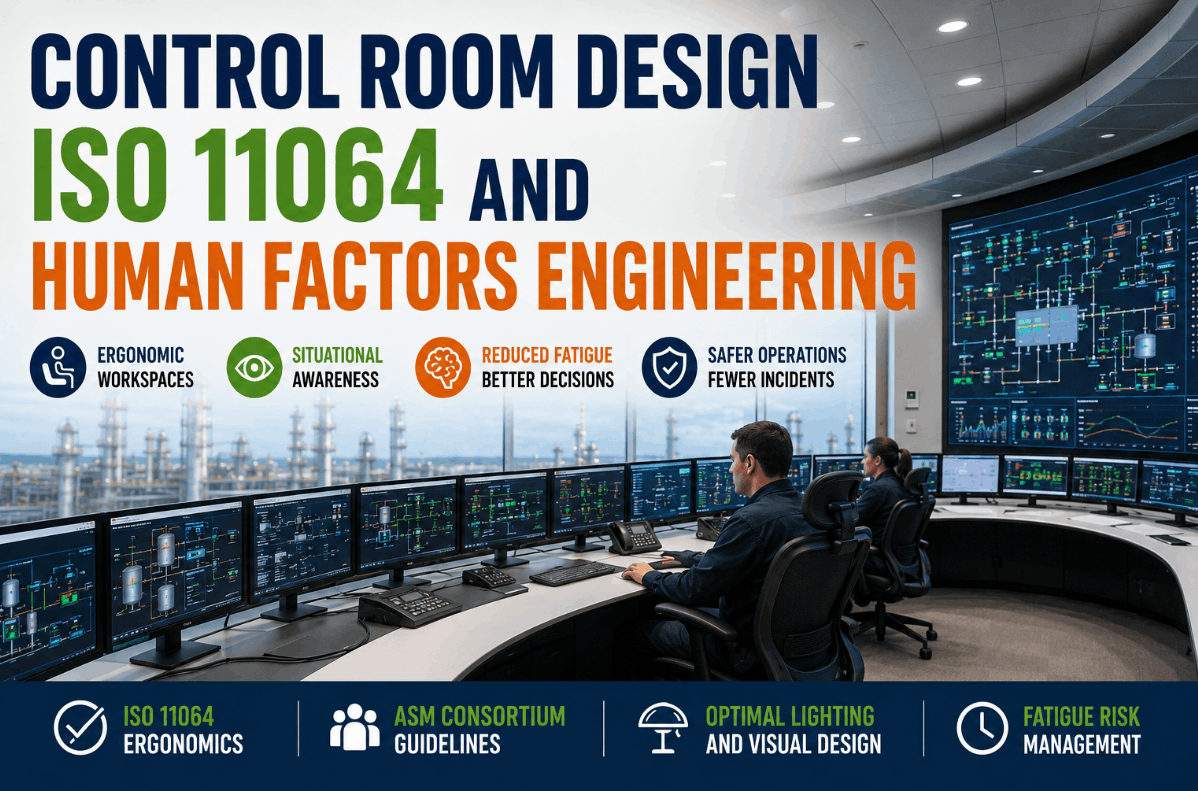
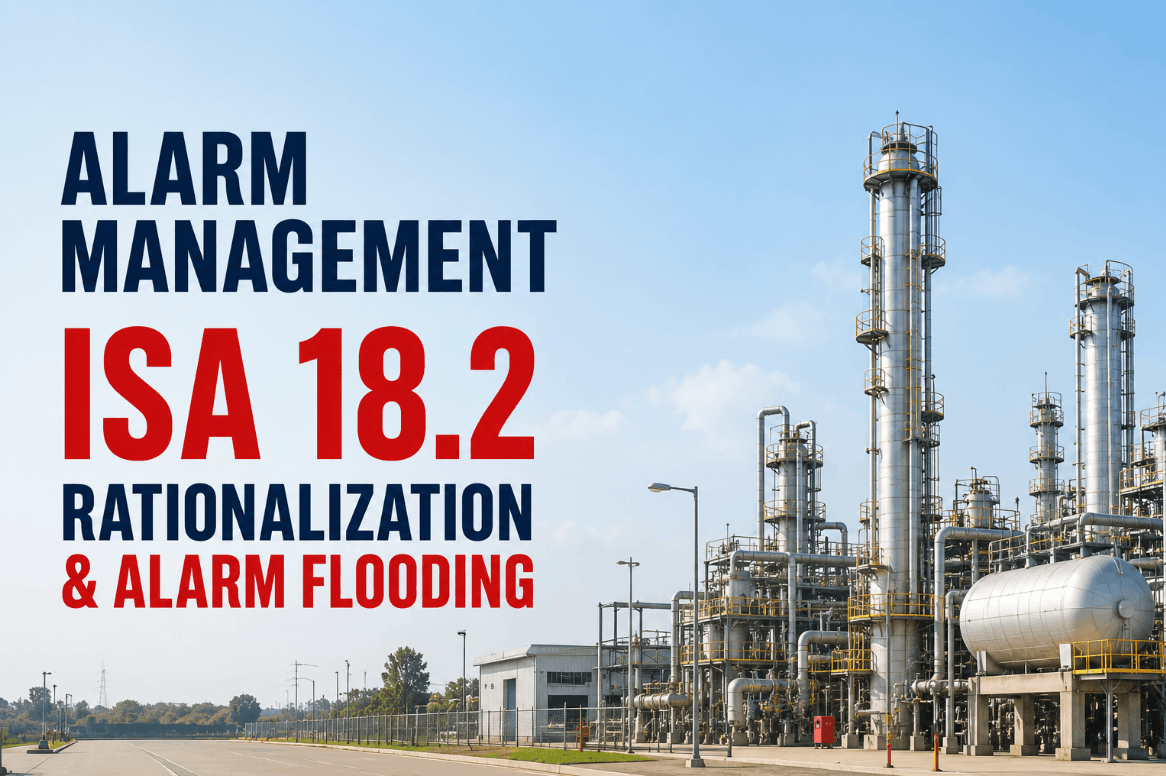
During an alarm flood at a refinery control room, an operator can receive more than one thousand alarms in the first ten minutes of a major process upset, which is roughly ten times the cognitive limit defined by ISA 18.2 for effective human response. Under that level of overload, operators stop prioritizing and start reacting to whatever appears on screen most recently, which means the most critical alarms are just as likely to be buried as the nuisance ones. The root cause is almost never operator incompetence but rather alarm systems that were never rationalized, HMIs that were designed for engineering convenience rather than operational clarity, and decades of incremental configuration changes that turned a manageable alarm set into an unmanageable noise floor. iFactory analyzes alarm frequency, priority distribution, and HMI interaction patterns to identify exactly where the overload is coming from and what rationalization or display changes will have the greatest impact on operator error reduction — see the platform at iFactory support.
Alarm Management and HMI Design · Oil and Gas
Alarm Rationalization and HMI Upgrades: Reducing Operator Error When It Matters Most
Apply ISA 18.2 alarm rationalization and ISA 101 high-performance HMI design principles to reduce alarm floods, lower operator cognitive load, and improve decision-making speed during abnormal situations in oil and gas control rooms.
1,000+
Alarms per 10 minutes during a typical refinery alarm flood event
144
Maximum alarms per operator per hour recommended by EEMUA 191
70%
Of alarm-related incidents linked to poor alarm configuration, not operator failure
The Operator Overload Problem
What Happens in a Control Room During an Alarm Flood — And Why Rationalization Is the Only Fix
An alarm flood is defined as more alarms than an operator can effectively acknowledge, assess, and respond to within the available time window. EEMUA Publication 191 and ISA 18.2 both identify alarm floods as the single most dangerous alarm management failure mode because they systematically strip away the operator's ability to distinguish between critical and non-critical situations. Understanding the mechanics of cognitive overload during a flood explains why adding more alarms or more screens never solves the problem and why rationalization is structurally necessary before any HMI improvement can deliver its full value.
Phase 1
Initial Trigger
A process disturbance occurs and generates a burst of alarms within seconds. The operator recognizes the upset and begins assessing the first few alarms that appear, still operating within normal cognitive capacity.
Phase 2
Rising Noise
As the disturbance propagates through connected systems, cascading alarms begin arriving faster than the operator can acknowledge them. Chattering alarms from oscillating loops repeat every few seconds, consuming attention without providing new information.
Phase 3
Cognitive Saturation
The alarm list is scrolling faster than it can be read. The operator shifts from analytical response to reactive mode, clicking acknowledge on whatever is visible without reading the full alarm text or considering the priority level assigned to each alarm.
Phase 4
Critical Alarm Masking
High-priority alarms that require immediate protective action arrive into a list already overwhelmed with low-priority and duplicate alarms. The critical alarm is acknowledged along with everything else, and its required response is delayed or missed entirely.
ISA 18.2 Framework
Alarm Rationalization According to ISA 18.2 — What the Standard Actually Requires
ISA 18.2 defines alarm rationalization as the process of reviewing every configured alarm in a system to determine whether it meets the definition of an alarm, is assigned the correct priority, has an appropriate setpoint, and has a defined response procedure that the operator can execute within the available response time. The standard is explicit that rationalization is not a one-time project but a lifecycle activity that must be repeated whenever process changes, operational experience, or performance monitoring indicate that the alarm baseline has shifted. Most oil and gas facilities have either never completed a rationalization or completed one years ago and have since allowed hundreds of unreviewed alarms to accumulate through modification projects and operational additions.
Step 1
Alarm Philosophy Document
Before any individual alarm is reviewed, the facility must have a documented alarm philosophy that defines what constitutes an alarm, priority definitions with response time expectations, setpoint methodology, and performance targets aligned with EEMUA 191 benchmarks. This document governs every rationalization decision that follows.
Step 2
Master Alarm Database Compilation
Every configured alarm tag across all DCS and safety system platforms is extracted into a single master database that includes the tag, alarm type, setpoint, priority, associated unit, and current performance data such as frequency of occurrence and standing time. This database becomes the working document for the rationalization process.
Step 3
Individual Alarm Review
Each alarm is evaluated against the alarm philosophy to determine whether it meets the alarm definition, is set at the correct point, has the correct priority based on consequence and response time, and has a documented operator response. Alarms that fail any of these criteria are either reconfigured, retagged, or removed.
Step 4
Suppression and Shelving Rules
Alarms that are valid in some operating modes but nuisance in others are assigned conditional suppression or shelving rules so they only present to the operator when they are operationally relevant. This is one of the highest-impact rationalization actions because it directly reduces alarm volume during mode changes and startups.
Step 5
Performance Benchmarking
Post-rationalization alarm performance is measured against the alarm philosophy targets, including average alarms per operator per hour, percentage of high-priority alarms, standing alarm count, and alarm flood frequency. These metrics are monitored continuously to detect drift from the rationalized baseline.
Step 6
Lifecycle Management
A management of change process ensures that any new alarm added to the system goes through the same rationalization criteria as the existing alarm base, and that removed or modified alarms are reflected in the master database. Without this step, the rationalized baseline degrades within months as new alarms are added without review.
ISA 101 High-Performance HMI
High-Performance HMI Design — What Changes When You Upgrade From a Legacy Display to ISA 101 Principles
Legacy HMIs in oil and gas control rooms were typically designed by control system engineers who prioritized access to every process variable, every controller faceplate, and every detail of the P&ID on a single display. The result is a screen so densely packed with data that operators spend more time scanning for relevant information than actually interpreting it. ISA 101 and the high-performance HMI approach reverse this philosophy by designing displays around the operator's cognitive workflow during normal, abnormal, and emergency situations, presenting only the information needed for the current task and removing everything else from the primary view.
Legacy HMI Design
XDense P&ID-style graphics with every tag and line displayed regardless of operational relevance
XBright saturated colors used for both normal and abnormal states, making deviations harder to distinguish
XOperator must navigate between four to eight displays to assess a single process upset
XAnimated equipment graphics that add visual noise without conveying operational state information
XNo clear visual hierarchy, so critical process deviations compete visually with background detail
High-Performance HMI Design
OKSimplified level-based graphics showing only equipment and parameters relevant to the current operational task
OKGray-scale background with color reserved exclusively for abnormal conditions requiring operator attention
OKOverview, unit, and detail display hierarchy allows situation assessment from one or two screens
OKStatic equipment representations with state indicated by color and position, not animation
OKClear visual hierarchy where abnormal conditions are immediately obvious against a calm background
Performance Measurement
Alarm Management KPIs That Actually Indicate Whether Your System Is Helping or Harming Operators
Measuring alarm system performance requires tracking a specific set of metrics that go beyond simple alarm counts. EEMUA 191 defines the key performance indicators that distinguish a well-managed alarm system from one that is creating operational risk, and these metrics must be tracked continuously rather than sampled periodically. The following KPIs represent the minimum set that any oil and gas control room should be monitoring as part of its alarm management program, along with the target ranges that indicate the system is performing within acceptable limits.
Less than 144
Average Alarms Per Operator Per Hour
EEMUA 191 Target: Manageable range, above 144 indicates operator overload during normal operations
This is the foundational metric. If your facility is averaging more than 144 alarms per operator per hour during normal operations, the alarm system is creating noise that degrades response capability during actual upsets.
Less than 10
Standing Alarms at Any Time
EEMUA 191 Target: Standing alarms represent unresolved issues that normalize deviation from safe operating limits
Standing alarms are alarms that have been acknowledged but not returned to normal state. A high standing alarm count indicates that operators have learned to accept abnormal conditions as normal, which is one of the most dangerous cultural outcomes of poor alarm management.
Less than 1 per month
Alarm Flood Events
EEMUA 191 Definition: More than 10 alarms per 10-minute period constitutes a flood event
Flood frequency is the clearest indicator of whether rationalization has addressed the root causes of alarm overload. A facility that still experiences multiple flood events per month after rationalization has unresolved chattering, duplicate, or poorly suppressed alarm configurations.
5% or less
High-Priority Alarm Percentage
If more than 5 to 10 percent of all alarms are high priority, the priority structure is broken and priorities have been inflated
Priority inflation occurs when rationalization assigns high priority to alarms that do not meet the consequence and response time criteria for that level. When too many alarms are high priority, none of them are, and the operator loses the ability to triage during an upset.
Less than 1%
Chattering Alarm Rate
Chattering alarms cycle more than 3 times in one minute and are the single largest contributor to alarm flood volume
Chattering alarms are almost always caused by poorly tuned control loops, incorrect deadband settings, or setpoints too close to normal process variability. They can typically be eliminated through control loop tuning and alarm configuration adjustments without requiring major rationalization changes.
Less than 5%
Duplicate Alarm Rate
Duplicate alarms convey the same information through multiple tags and inflate alarm counts without adding situational awareness
Duplicates occur when the same process condition triggers multiple alarms from different instruments measuring the same variable, or when a single condition triggers both a process alarm and a system diagnostic alarm. Eliminating duplicates is one of the quickest ways to reduce alarm volume during upsets.
Your Operators Are Making Decisions Based on an Alarm System That Was Configured by Dozens of Engineers Over Two Decades — None of Whom Ever Had to Sit in the Chair During an Upset.
iFactory analyzes your alarm frequency data, priority distribution, and HMI interaction patterns to identify exactly which rationalization and display changes will reduce operator error during abnormal situations.
Implementation Challenges
Why Alarm Rationalization and HMI Upgrade Projects Stall — And How to Get Past the Barriers
Most oil and gas operators recognize that their alarm systems need rationalization and their HMIs need upgrading, but the projects repeatedly get deferred, scoped down, or abandoned partway through. The barriers are not technical but organizational, and understanding them is necessary to structure a program that actually reaches completion and delivers measurable operator performance improvement rather than producing another incomplete study that sits on a shelf.
1
Alarm Count Overwhelming
A typical refinery has between 10,000 and 30,000 configured alarms across its DCS and safety systems. The sheer volume makes a comprehensive rationalization feel like a multi-year project that the organization cannot sustain, leading to scope reduction that only addresses the worst offenders while leaving the underlying noise floor unchanged.
2
Operations Ownership Gap
Rationalization is often initiated by the process safety or engineering team, but the decisions about alarm priority and operator response require operational input that shift supervisors and operators cannot provide when they are also covering normal operational duties. Without dedicated operations participation, the rationalization reflects engineering assumptions rather than operational reality.
3
HMI Upgrade Resistance
Operators who have worked with the same HMI layout for years or decades often resist visual changes even when the new design is objectively better, because their situational awareness has been built on the spatial memory of where information is located on the old displays. Transition planning and parallel operation periods are essential but frequently skipped.
4
No Data to Prioritize
Without alarm performance data showing which alarms are flooding, chattering, duplicating, or standing, rationalization teams have no objective basis for deciding which alarms to review first. The result is a sequential review that spends equal time on alarms that fire once per year and alarms that fire once per hour, dramatically slowing progress.
5
MOC Integration Failure
Even after a successful rationalization, new alarms added through management of change often bypass the rationalization criteria because the MOC process does not include an alarm review checkpoint. Within six to twelve months, the rationalized baseline has degraded enough to require another pass, creating a cycle that undermines confidence in the program.
6
No Measurable Outcome
Projects that do not define measurable operator performance targets at the outset, such as specific reductions in average alarms per hour or measurable improvements in upset response time, cannot demonstrate value to management and are vulnerable to budget cuts when timeline pressure increases.
Before and After
Alarm System Performance Before Rationalization and HMI Upgrade vs. After Implementation
Performance Metric
Before Rationalization
After Rationalization and HMI Upgrade
Average Alarms Per Operator Per Hour
380 to 600 alarms per hour during normal operations, well above the 144 EEMUA threshold
Reduced to 80 to 120 alarms per hour, within the manageable EEMUA range with clear priority structure
Standing Alarm Count
45 to 80 standing alarms at any given time, many present for weeks or months without resolution
Reduced to 5 to 8 standing alarms, each with a documented resolution plan and target date
Alarm Flood Frequency
8 to 12 flood events per month, with multiple events exceeding 500 alarms in 10 minutes
Reduced to 0 to 1 flood events per month, with no event exceeding 100 alarms in 10 minutes
High-Priority Alarm Percentage
28 to 35 percent of all configured alarms set to high priority, indicating severe priority inflation
Reduced to 4 to 6 percent high priority, with clear consequence-based justification for each
Displays Navigated During Upset Assessment
Operators navigate 5 to 8 display screens to assess the scope of a typical unit upset
Operators assess the same upset from 1 to 2 overview and unit-level displays in the high-performance HMI hierarchy
Time to First Corrective Action
4 to 7 minutes from initial upset to first corrective action due to alarm noise and display navigation delay
Reduced to 1 to 2 minutes with clear abnormal indication on overview display and prioritized alarm presentation
Chattering and Duplicate Alarm Rate
12 to 18 percent of all alarm annunciations are chatters or duplicates that provide no new information
Reduced to less than 1 percent through deadband adjustment, loop tuning, and duplicate elimination
Field Implementation
Reducing Alarm Volume by 72 Percent at a Gas Plant Control Room Through Data-Driven Rationalization
A natural gas processing plant with a centralized control room managing three processing trains had been experiencing chronic operator complaints about alarm overload, with operators reporting that they could not reliably identify critical alarms during upsets because the alarm list was dominated by low-priority and repeating alarms. An initial alarm performance audit using iFactory to analyze six months of historical alarm data revealed that the plant was averaging 420 alarms per operator per hour during normal operations, with 15 percent of all alarm annunciations classified as chatters and an additional 8 percent classified as duplicates. The audit also identified that 31 percent of all configured alarms were set to high priority, which meant that during an upset, the high-priority alarm list was as overwhelmed as the general list. Rather than attempting to rationalize all 14,000 configured alarms simultaneously, the team used the iFactory alarm frequency analysis to rank every alarm by its contribution to total alarm volume and started rationalization with the top 200 highest-frequency offenders, which accounted for 62 percent of all alarm annunciations. After the first pass, average alarms per hour dropped from 420 to 180. A second pass targeting the next 400 highest-frequency alarms, combined with HMI display upgrades on the two most-used unit overview screens, brought the average down to 118 alarms per operator per hour, within the EEMUA 191 manageable range. Book a Demo to see how iFactory prioritizes alarm rationalization targets using your actual alarm data.
72%Reduction in average alarms per operator per hour
600Alarms rationalized in two targeted passes out of 14,000 total
118Final average alarms per hour, within EEMUA manageable range
0Alarm flood events in the 90 days following second rationalization pass
Frequently Asked Questions
Alarm Rationalization and HMI Upgrades — What Control Room Managers and Process Safety Engineers Ask First
How does iFactory analyze our existing alarm data to prioritize rationalization efforts?
iFactory connects to your alarm historian or DCS alarm journal and processes historical alarm data to calculate frequency rankings for every configured alarm, identify chattering and duplicate alarm patterns, analyze priority distribution across units and alarm types, and measure standing alarm duration. This analysis produces a ranked list of alarms by their contribution to total alarm volume, which becomes the objective basis for deciding which alarms to rationalize first. Rather than starting rationalization at alarm tag number one and working sequentially through the database, the data-driven approach targets the alarms that are creating the most operator overload first, delivering measurable reduction in alarm volume after each rationalization pass.
Book a Demo to see the alarm frequency analysis workflow using your own data.
Can iFactory monitor alarm performance continuously after rationalization to detect baseline drift?
Yes. After rationalization is complete, iFactory continuously tracks the same alarm performance KPIs that were used to prioritize the rationalization effort, including average alarms per operator per hour, standing alarm count, chattering rate, duplicate rate, and flood event frequency. When any of these metrics begins to drift away from the post-rationalization baseline, the system generates alerts that identify which specific alarms or units are contributing to the drift, enabling the alarm management team to address the degradation before it returns to pre-rationalization levels. This continuous monitoring is what prevents the common failure mode where a rationalization project delivers initial improvement but then degrades over the following year as new alarms are added without review.
Contact support to discuss post-rationalization performance monitoring configuration.
Does iFactory design the HMI graphics or just provide data to support the design process?
iFactory does not design HMI graphics but provides the operational data that HMI designers need to make informed decisions about what information belongs on which display level. This includes analysis of which process variables operators access most frequently during upsets, which alarm types correlate with the longest response times, and which display navigation paths are used most often during abnormal situation assessment. By grounding HMI design decisions in actual operator behavior data rather than assumptions, the resulting display hierarchy reflects how operators actually work rather than how engineers think they should work. The HMI design and graphic implementation itself is typically performed by a specialist HMI design firm or the control system vendor using ISA 101 guidelines.
How long does a data-driven alarm rationalization project typically take for a mid-size refinery?
For a refinery with 15,000 to 25,000 configured alarms, the initial alarm performance analysis and prioritization typically takes two to three weeks. The first rationalization pass targeting the top 200 to 300 highest-frequency alarms, which usually accounts for 50 to 65 percent of total alarm volume, takes an additional four to six weeks depending on operations team availability for review sessions. A second pass targeting the next 400 to 500 alarms takes another four to six weeks. Most facilities achieve measurable alarm volume reduction after the first pass and reach their target performance range after the second pass, with the total project timeline ranging from three to five months for the data-driven targeted approach compared to twelve to eighteen months for a traditional sequential rationalization of every alarm in the database.
Book a Demo to get a project timeline estimate for your facility.
How does alarm rationalization integrate with our existing management of change process?
iFactory can be configured to flag any new alarm that is added to the DCS or safety system without going through the rationalization criteria defined in your alarm philosophy. When a new alarm appears in the alarm historian that is not present in the rationalized master alarm database, the system generates a notification to the alarm management team indicating that an unrationalized alarm has been introduced. This creates an enforcement mechanism within the MOC process that ensures new alarms are reviewed against the same priority, setpoint, and response procedure criteria that were applied during the original rationalization, preventing the gradual degradation of the rationalized baseline that occurs when new alarms are added through modification projects without alarm-specific review steps.
Contact support to discuss MOC integration for your alarm management program.
Your Alarm System Is Generating More Noise Than Signal, and Your Operators Are Compensating by Ignoring Both.
Data-driven alarm rationalization and high-performance HMI design reduce the cognitive load on your control room operators during the moments when their decisions matter most.