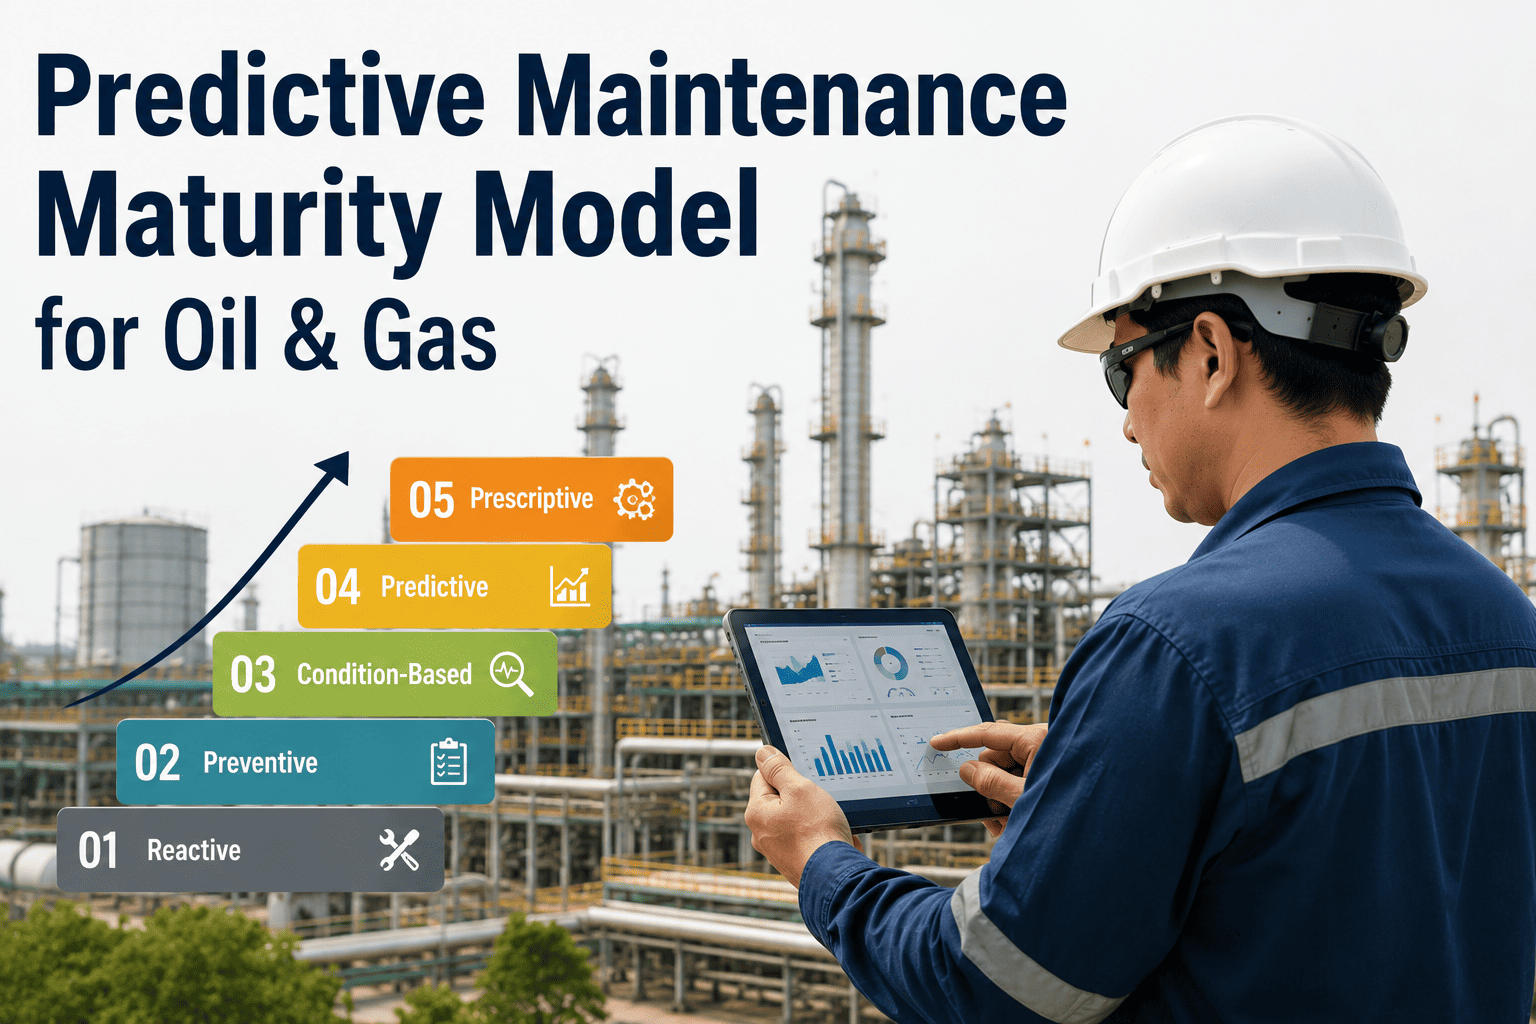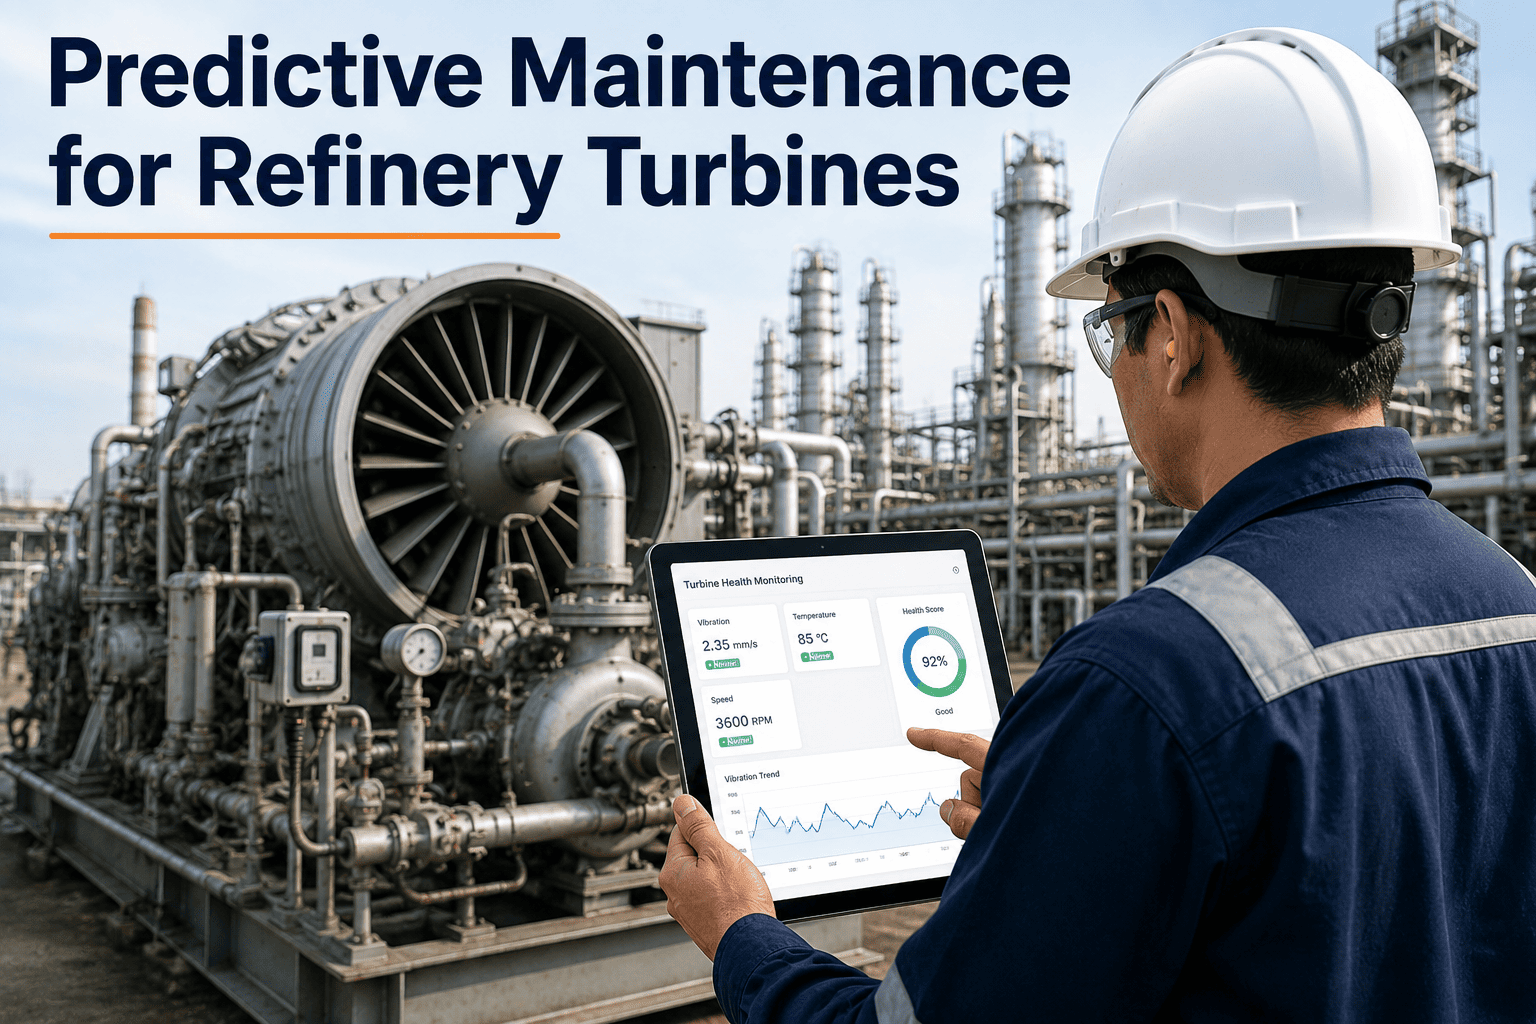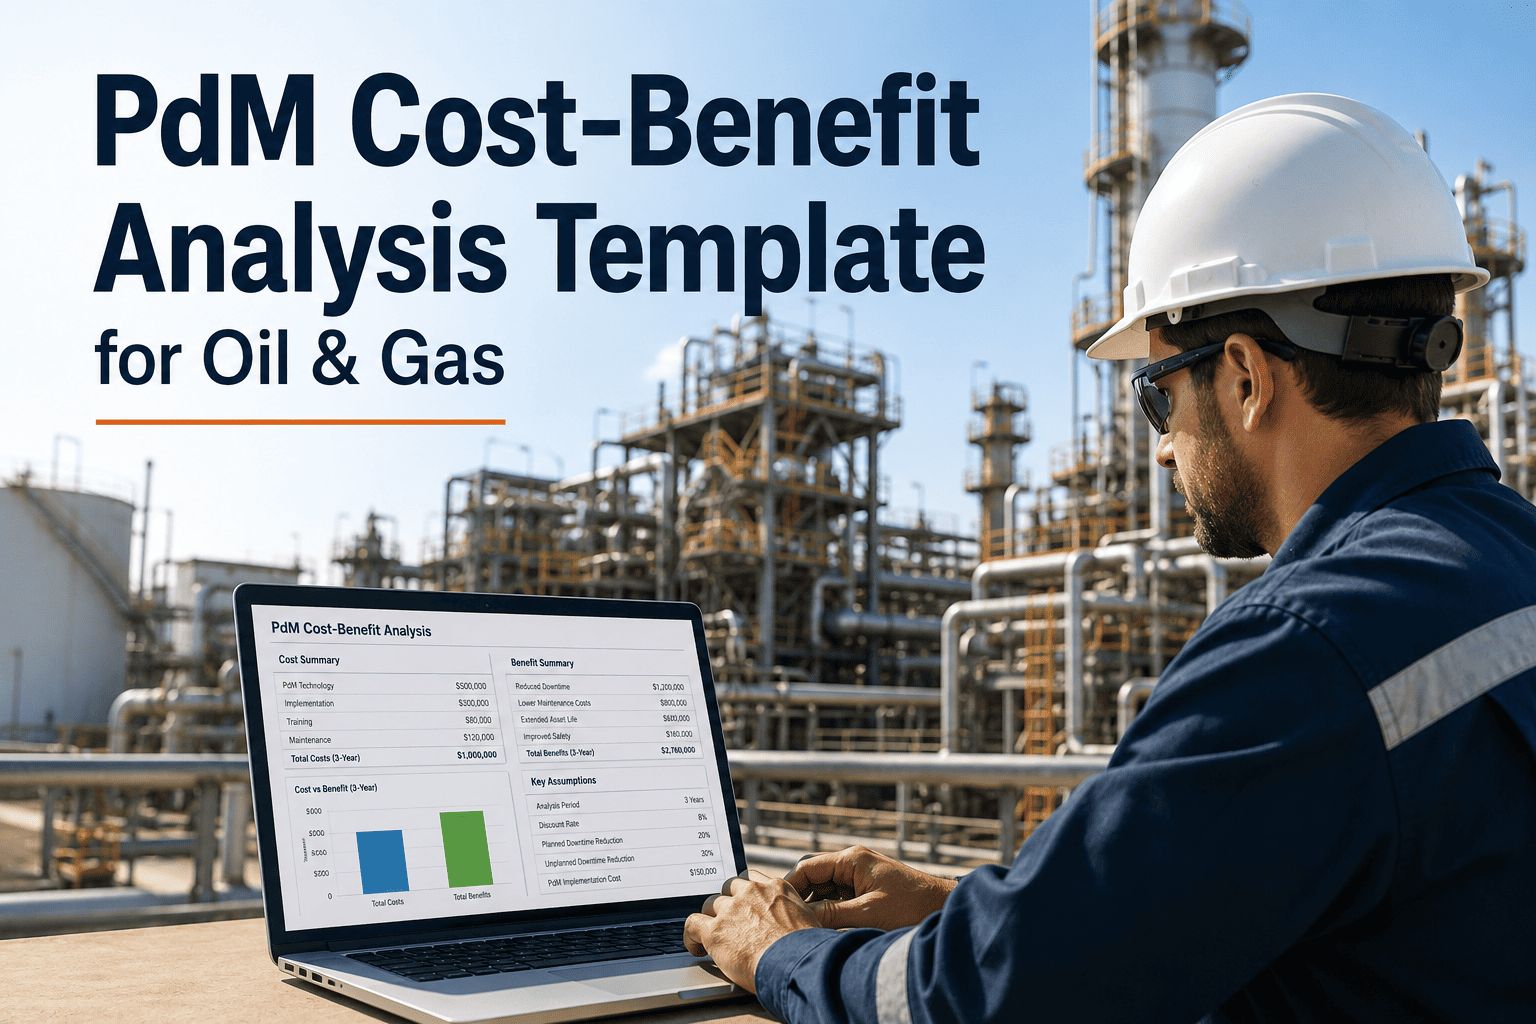
In the high-stakes environment of oil and gas operations, unplanned downtime is not merely a cost—it is a strategic liability. A single pump failure at a midstream facility can cascade into production losses exceeding $500,000 per day, while a compressor trip at a refinery may trigger safety incidents and environmental penalties. Predictive maintenance (PdM) promises to transform this landscape by shifting from reactive firefighting to data-driven foresight. Yet, building a compelling business case for PdM investment requires more than enthusiasm; it demands a rigorous, line-item cost-benefit analysis that speaks the language of CFOs and plant directors. This comprehensive guide delivers a ready-to-use template, grounded in industry benchmarks, to help you justify every dollar spent on sensors, software, and skilled personnel. From initial sensor deployment to long-term total cost of ownership, we dissect the economics of PdM in oil and gas. Book a Demo to see how iFactory's AI platform can accelerate your ROI.
Build Your Predictive Maintenance Business Case
A data-backed template for oil & gas decision-makers. Quantify sensor costs, software licensing, staffing, and risk reduction in one unified model.
Why a Cost-Benefit Template Matters
Oil and gas facilities operate with thin margins and massive capital commitments. A PdM program must demonstrate clear financial returns within a defined payback period—typically 12 to 18 months for most operators. Without a structured template, stakeholders often underestimate hidden costs (e.g., data storage, training, integration) or overestimate savings (e.g., assuming 100% failure avoidance). This section provides a standardized framework to evaluate both sides of the equation.
Scope of This Analysis
Our template covers upstream, midstream, and downstream assets: pumps, compressors, turbines, heat exchangers, and pipelines. We include direct costs (hardware, software, labor) and indirect benefits (reduced safety incidents, extended asset life, lower insurance premiums). The model is designed to be customized with your site-specific data.
Cost Categories: The Full Spectrum of PdM Investment
Sensor & Hardware
Wireless vibration sensors, temperature probes, ultrasonic detectors, and corrosion monitoring units. Average cost per measurement point: $400–$1,200. For a 200-sensor deployment, budget $80,000–$240,000.
High Impact: 85% of programs allocate top spend here
Software & Licensing
PdM analytics platform, data historian, and visualization tools. Annual licensing: $50,000–$200,000 depending on asset count. Cloud storage and compute add $10,000–$30,000 per year.
Recurring: 70% of annual costs
Staffing & Training
Hire or upskill reliability engineers, data scientists, and technicians. Salary range: $90,000–$150,000 per FTE. Training programs: $5,000–$20,000 per person. Typical team: 3–5 people.
Human Capital: 60% of operational expense
Integration & IT
Connecting sensors to existing DCS/SCADA, network upgrades, cybersecurity. One-time integration: $30,000–$100,000. Annual IT support: $15,000–$40,000.
Enabler: 40% of initial project
Quantified Benefits: From Avoided Failures to Strategic Gains
| Benefit Category | Annual Savings (Typical Range) | Assumption Basis |
|---|---|---|
| Unplanned Downtime Reduction | $200,000–$1,500,000 | 30-50% reduction in reactive maintenance events |
| Maintenance Cost Optimization | $100,000–$500,000 | 20-30% reduction in unnecessary preventive tasks |
| Extended Asset Life | $150,000–$800,000 | 15-25% extension in major overhauls |
| Safety & Environmental Risk | $50,000–$300,000 | Reduction in incident investigation, fines, and claims |
| Inventory Carrying Cost | $30,000–$150,000 | Optimized spare parts stock (10-20% reduction) |
Values based on industry benchmarks from IHS Markit and NIST studies. Adjust with your historical data.
The PdM Cost-Benefit Analysis Template
Use the following line-item structure to build your own model. Replace placeholders with site-specific figures. The template is designed for a 3-year horizon with a 10% discount rate.
Year 0: Initial Capital
- Sensor procurement & installation: $________
- Software license (first year): $________
- Integration & IT upgrades: $________
- Staff recruitment & training: $________
- Contingency (10%): $________
Year 1: Operational & Savings
- Software renewal: $________
- Staff salaries (3 FTE): $________
- IT support: $________
- Downtime savings: $________
- Maintenance cost reduction: $________
Year 2: Scale & Optimize
- Additional sensors (50 pts): $________
- Software upgrade: $________
- Training (advanced analytics): $________
- Asset life extension savings: $________
- Safety incident reduction: $________
Year 3: Full Maturity
- Full software suite: $________
- Team expansion (2 more FTE): $________
- Inventory savings: $________
- Insurance premium reduction: $________
- Total cumulative NPV: $________
Ready to Build Your Business Case?
Use our interactive template with live calculations. Our experts can help you populate it with accurate data from your plant.
Risk Reduction: The Intangible That Becomes Tangible
Operational Risk
PdM reduces the probability of catastrophic failures by 40-60%. For a typical refinery, a single unplanned shutdown costs $1M+ per day. The expected value of risk reduction can be modeled as: Probability of failure × Consequence cost × Reduction factor. Example: 0.05 × $5M × 0.5 = $125,000 annual risk savings.
Safety Risk
OSHA fines for serious incidents average $150,000 per violation. PdM minimizes human exposure to hazardous environments during inspections. Using remote monitoring, you can reduce confined space entries by 30%, directly lowering injury probability.
Environmental Risk
EPA penalties for unplanned releases can exceed $100,000 per day. PdM enables early leak detection and prevents spills. The cost of remediation and reputation damage is often 3-5x the direct fine. Including a 20% risk premium in your model is conservative.
Total Cost of Ownership: 5-Year Projection
A comprehensive TCO model includes not just initial outlay but also escalation costs (e.g., sensor replacement, software migration). Below is a representative 5-year projection for a mid-size gas plant (500 assets).
Costs decline as integration matures and hardware stabilizes. Savings ramp up from Year 2 onward, leading to a cumulative positive NPV by Month 18.
ROI Calculation Methodology
01
Define Baseline
Collect 12 months of historical maintenance data: number of failures, mean time to repair, cost per event, and lost production hours. This becomes your 'do nothing' scenario.
02
Estimate PdM Impact
Apply industry benchmarks: 30-50% reduction in unplanned downtime, 20-30% reduction in maintenance costs, 15-25% extension in asset life. Adjust for your asset criticality.
03
Calculate Net Savings
Subtract total PdM costs (hardware, software, labor) from the avoided costs. Use discounted cash flow for multi-year projects. A positive NPV with payback under 18 months is typical.
Pilot Program Economics: Start Small, Prove Value
A pilot on 20 critical pumps can demonstrate ROI with minimal risk. Typical pilot costs: $50,000–$100,000 for sensors, $20,000 for software, $30,000 for integration. Expected savings: $150,000–$300,000 in avoided failures over 6 months. This creates a compelling case for full deployment.
3x
Average ROI on pilot programs
6 mo
Typical payback period
85%
Pilot success rate leads to full rollout
Frequently Asked Questions
What is the typical payback period for a PdM program in oil and gas?
Industry benchmarks indicate a payback period of 12 to 18 months for most mid-to-large facilities. This is based on a 30-50% reduction in unplanned downtime and 20-30% reduction in maintenance costs. Factors like asset criticality, existing data infrastructure, and team readiness can shift this range. For a detailed payback calculator tailored to your plant, book a demo with iFactory to access our proprietary model.
How do I estimate sensor costs accurately?
Sensor costs vary by type: wireless vibration sensors ($400-$800 per point), temperature probes ($200-$500), and ultrasonic detectors ($1,000-$2,000). Installation adds 30-50% depending on hazardous area classification. For offshore platforms, costs can double due to logistics. Use our template to input your specific asset count and environment. For a free consultation on sensor selection, contact iFactory support for expert guidance.
What are the hidden costs of PdM implementation?
Commonly overlooked costs include data storage and compute (cloud fees $10k-$30k/year), cybersecurity upgrades ($15k-$50k), and ongoing training for new hires. Also, integration with legacy DCS/SCADA systems can require custom middleware. Budget a 15-20% contingency for unforeseen IT complexities. To avoid surprises, book a demo to see how iFactory's all-in-one platform reduces hidden integration costs.
How do I justify PdM investment to my CFO?
Present a clear NPV analysis using the template provided. Highlight three key numbers: total investment, annual savings, and payback period. Use industry benchmarks to back your assumptions. Emphasize that PdM reduces capital expenditure by extending asset life and lowers operational risk. For a pre-built CFO-ready presentation, contact iFactory support for our business case toolkit.
What is the ROI of PdM compared to preventive maintenance?
Preventive maintenance (PM) follows fixed schedules, often leading to over-maintenance. PdM reduces unnecessary PM tasks by 20-30%, saving labor and parts. Studies show PdM delivers 5-10x ROI over PM alone. For example, a refinery spending $2M/year on PM can save $400k-$600k by shifting to condition-based strategies. To calculate your specific savings, book a demo with iFactory for a personalized ROI assessment.
Transform Your Maintenance Economics Today
Stop guessing. Start predicting. Our team will help you build a data-backed business case and deploy PdM with measurable results.