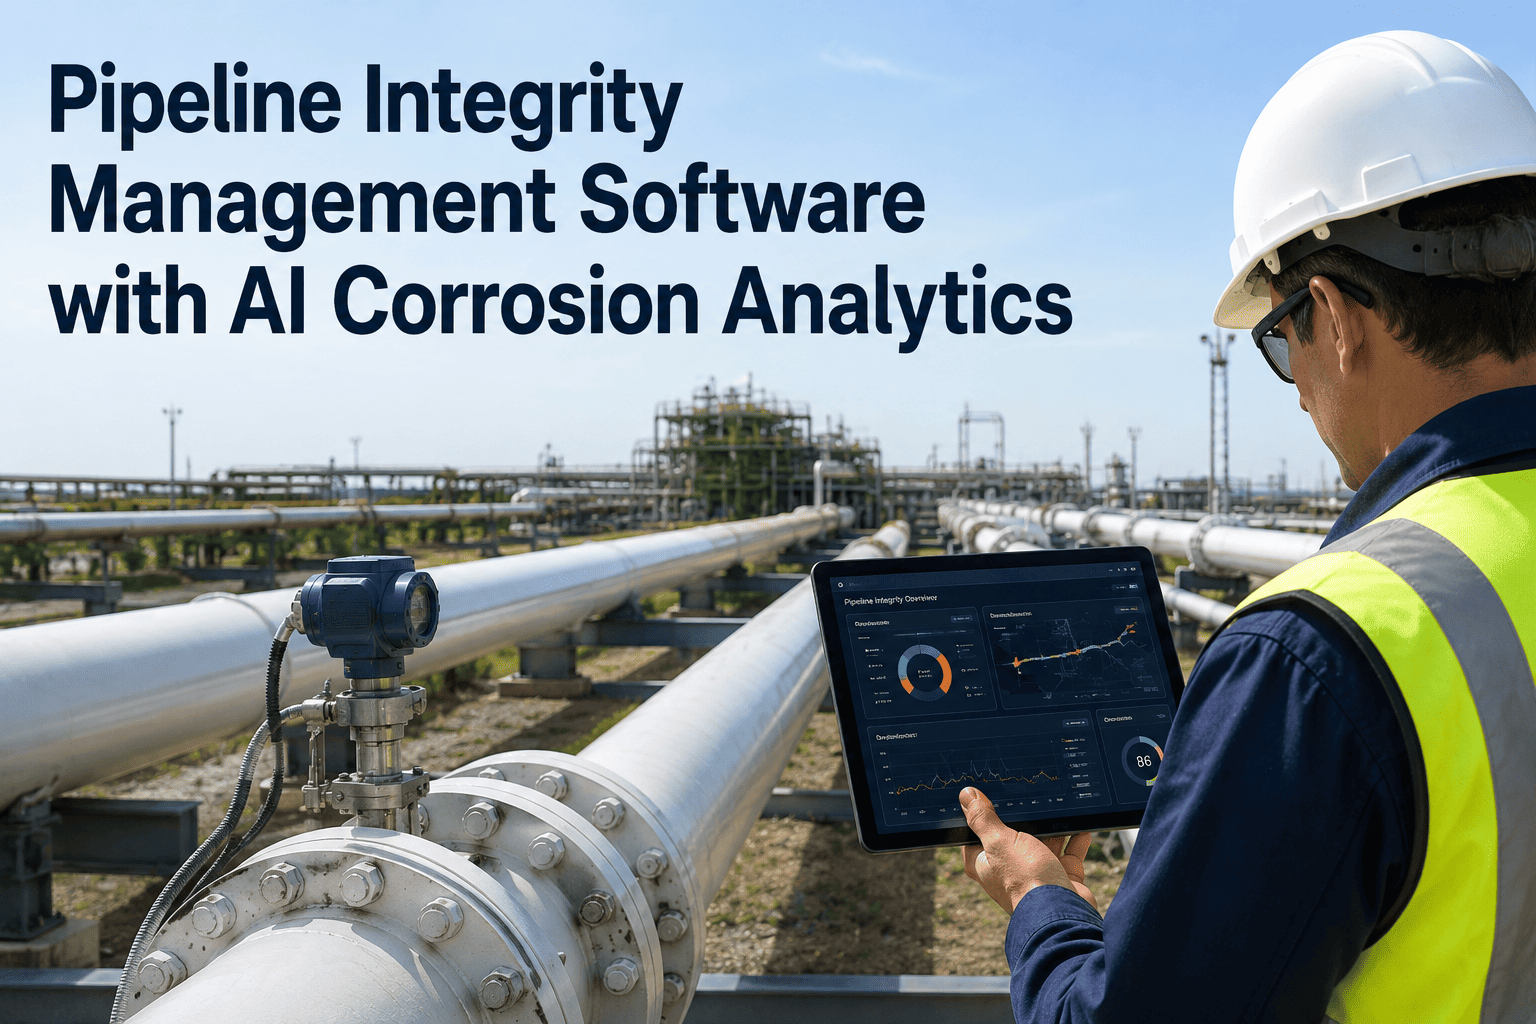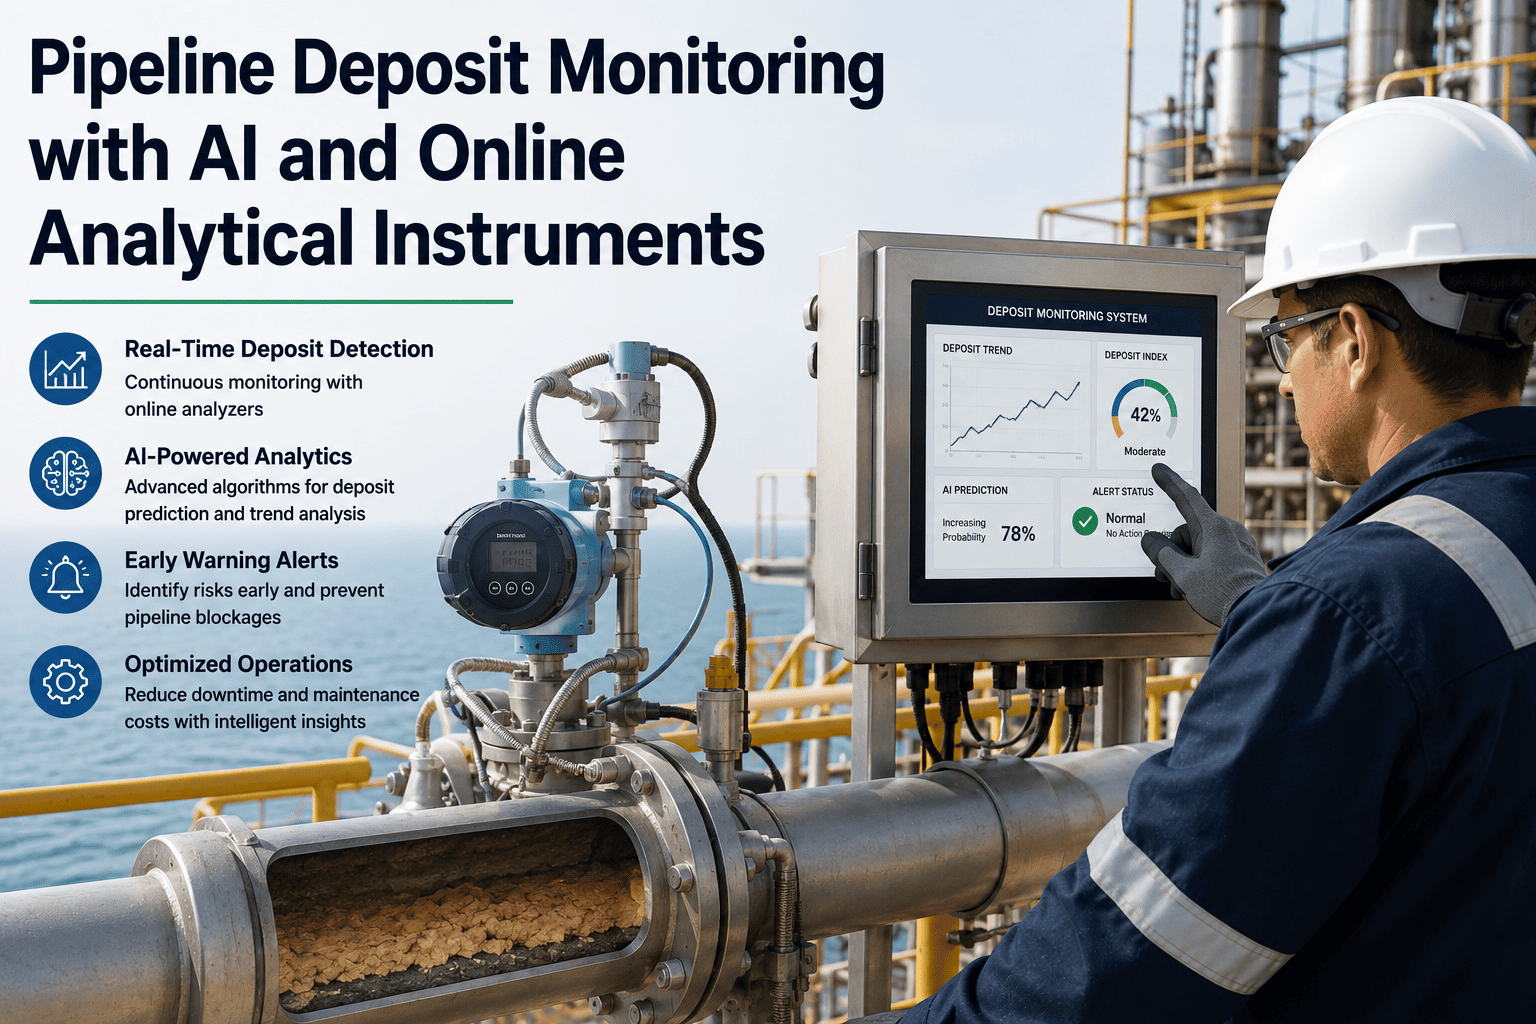
Deposits build up inside a pipeline long before anyone sees the evidence. Paraffin waxes out of crude as it cools, scale precipitates out of produced water, sand and clay settle at low points, and none of it announces itself until a pig run comes back fouled, a corrosion probe shows a spike, or throughput has already dropped. Corrosion probes, particle counters, and online water analyzers have existed for years, but on most pipelines they run as three separate instruments feeding three separate spreadsheets, reviewed on three separate schedules by three separate people. iFactory correlates all three data streams in real time, so a rising particle count, a shifting water chemistry, and a corrosion-rate trend are read together as one deposit signature instead of three unrelated alarms. Book a 30-minute scoping call to see your own instrument data correlated live.
Stop Waiting for the Pig Run to Tell You What Already Happened
A pig run or a manual sample only shows deposit condition at a single point in time, days or weeks after the buildup actually started. iFactory fuses continuous readings from corrosion probes, particle counters, and online water analyzers into a single deposit-trend model, flagging fouling, scale, and corrosion risk while there is still time to adjust a chemical treatment instead of scheduling an unplanned pigging campaign.
Four Kinds of Deposit, One Pipeline
Not all deposits form the same way or respond to the same treatment, and a monitoring program that only watches for one kind will miss the others until they show up as a throughput problem.
Paraffin & asphaltenes
Wax and asphaltenic material drop out of crude as temperature falls below the cloud point, building a soft, insulating layer that thickens with every degree of additional cooling.
Mineral scale
Calcium carbonate, barium sulfate, and iron sulfide precipitate out of produced water as pressure and temperature shift, forming a hard, adherent layer that resists mechanical removal.
Sand & clay
Formation solids carried in the flow settle out at low points and velocity changes, accumulating as a loose bed that traps corrosive water underneath it.
Biofilm & MIC
Bacterial material forms a biofilm that shields the metal surface from inhibitor chemicals and drives microbiologically influenced corrosion underneath the deposit itself.
Three Instruments, One Fused Signal
Each instrument sees a different piece of the deposit picture. Correlated together, the three tell a fuller story than any one of them reading alone.
Corrosion probes
Electrical resistance and linear polarization probes track metal-loss trends continuously, flagging accelerating corrosion rates that often follow once a deposit has trapped corrosive water against the pipe wall.
Particle counters
Laser particle counters continuously size and count solids in the flow stream, catching a rising sand or scale-fines count long before it shows up as bed accumulation downstream.
Online water analyzers
Continuous pH, conductivity, and ion-composition readings track the water chemistry conditions that drive scale precipitation, so a shift toward scaling conditions is visible before scale actually forms.
The Cost of Finding Out at the Pig Trap
A pipeline running at a healthy corrosion rate below roughly 0.25 millimeters a year can still be building a deposit that only shows up as reduced pigging efficiency, a stuck pig, or a throughput drop, none of which a corrosion instrument alone would ever flag.
the generally accepted threshold above which internal corrosion rate is considered elevated and worth investigating
separate instrument types typically already installed on a monitored pipeline, rarely reviewed together on the same schedule
typical gap between scheduled pig runs, during which a deposit can build up entirely unobserved between inspections
of unplanned pigging or chemical-treatment interventions that trace back to a trend visible in instrument data weeks earlier
Correlate Your Own Corrosion, Particle, and Water Data
Bring your existing instrument feeds to the call. iFactory shows a live correlation across your corrosion probe, particle counter, and water analyzer data, mapped against your last several pig runs.
Scheduled Pigging vs Continuous AI-Correlated Monitoring
Pigging and lab sampling remain essential ground truth. What changes is whether deposit trends are only visible on inspection day, or visible continuously between them.
- Deposit condition confirmed only at the pig trap or during a manual sample
- Corrosion, particle, and water chemistry data reviewed separately, on separate cadences
- Chemical treatment dosage adjusted after a problem is already confirmed
- Root cause investigated after the fact, once throughput has already dropped
- Pigging frequency set by calendar, not by actual deposit accumulation rate
- Deposit trend visible continuously between pig runs and lab samples
- Corrosion, particle, and water chemistry streams correlated into one fused deposit signal
- Chemical treatment dosage adjusted proactively as conditions trend toward scaling or fouling
- Root cause narrowed automatically by which instrument moved first
- Pigging frequency recommended from actual accumulation trend, not a fixed calendar
How iFactory Correlates the Three Streams
Five stages turn three independent instrument feeds into one deposit-trend model your team can act on.
Continuous ingestion
Corrosion probe, particle counter, and water analyzer readings stream in on their native intervals, time-aligned to the same pipeline segment.
Baseline modeling
Each instrument's normal operating range is learned per segment, accounting for expected seasonal and production-rate variation.
Cross-stream correlation
The model checks whether a shift in one instrument is echoed in the others, distinguishing a genuine deposit signature from a single sensor drifting alone.
Deposit classification
The correlated pattern is matched against known signatures for scale, wax, sand accumulation, and microbiologically influenced corrosion.
Recommendation & alert
Treatment dosage guidance and pigging-window recommendations route to the flow assurance engineer, tied to the segment and deposit type identified.
Deposit Type, Leading Indicator, and Typical Response
Which instrument moves first is often the fastest clue to what kind of deposit is forming.
What Changes After Correlated Monitoring Goes Live
Figures from typical flow assurance programs within the first 120 days of correlating existing instrument feeds.
The 8-Week Correlated Monitoring Rollout
One pipeline segment, your existing corrosion, particle, and water instrument feeds, from kickoff to a validated deposit-trend dashboard.
Inventory existing corrosion probes, particle counters, and water analyzers, and confirm data access points.
Establish normal ranges per instrument and map historical readings against past pig-run findings.
Train the deposit classification model on your segment's own instrument and inspection history.
Validate alerts against the next scheduled pig run, then hand the dashboard to the flow assurance team.
We had a corrosion probe, a particle counter, and a water analyzer on that line for years, each one logging to its own system. Nobody was cross-checking them daily, so a scale trend that the water analyzer had been showing for three weeks only got noticed once the pig came back covered. Now the three feeds get checked against each other automatically, and we adjust inhibitor dosage before the trend ever reaches the pig trap.
fewer unplanned pigging interventions within the first four months of correlated monitoring
instrument streams fused into a single deposit-trend view per pipeline segment
typical reduction in chemical treatment cost once dosing follows the actual trend
Frequently Asked Questions
Do we need to install new instruments, or can this run on what we already have?
Most pipelines already have corrosion probes, particle counters, or online water analyzers installed somewhere along the route, just not correlated together. iFactory connects to the data these instruments are already producing rather than requiring a new sensor network, though a segment missing one of the three instrument types may need a gap filled for full coverage. Talk to a specialist about auditing what you already have in place.
How does the system tell the difference between a real deposit trend and normal instrument noise?
Each instrument's normal operating range is learned per pipeline segment, accounting for expected seasonal and production-rate variation. A genuine deposit signature is confirmed when a shift in one stream is echoed by a corresponding shift in another, such as a rising particle count alongside a water chemistry trend toward scaling conditions, rather than a single sensor drifting on its own.
Can it tell us which type of deposit is forming, not just that something has changed?
Yes. The correlated pattern across the three instrument streams is matched against known signatures for paraffin, mineral scale, sand and clay accumulation, and microbiologically influenced corrosion, since each deposit type tends to move a different combination of instruments first. That classification is what drives the specific treatment recommendation routed to your team.
Does this replace pigging, or reduce how often we need to pig?
Pigging remains the ground truth for physical deposit removal and inspection, and correlated monitoring does not replace it. What changes is the basis for scheduling: pigging windows shift from a fixed calendar to a recommendation driven by the actual accumulation trend on that segment, which typically reduces unplanned interventions while catching problems the calendar alone would have missed.
How long does it take to get a pipeline segment fully correlated and live?
A single-segment pilot typically runs eight weeks from kickoff, covering an instrument and data audit, baseline modeling against historical readings, correlation model tuning, and a validated dashboard rollout confirmed against a live pig run. Book a scoping call to get a timeline specific to your system.
See Your Corrosion, Particle, and Water Data Correlated
Book a 30-minute scoping call and bring your existing instrument feeds. iFactory correlates your corrosion probe, particle counter, and water analyzer data live against your recent pig-run history, then builds a fixed-timeline pilot proposal for your system.